INVESTOR PRESENTATION - BlackBerry
←
→
Page content transcription
If your browser does not render page correctly, please read the page content below

INVESTOR PRESENTATION Q3FY2021
SAFE  HARBOR   STATEMENT
 Safe Harbor Statement
Some of the statements made within this presentation constitute forward-looking statements and are made pursuant to the safe harbor
provisions of applicable U.S. and Canadian securities laws.

Forward-looking statements are indicated by using words such as expect, will, should, model, intend, believe and similar expressions.
Forward-looking statements are based on estimates and assumptions made by the company in light of its experience and its perception of
historical trends, current conditions and expected future developments as well as other factors that the company believes are relevant.

Many factors could cause the company's actual results or performance to differ materially from those expressed or implied by the forward-
looking statements, including the risk factors that are discussed in the company's annual report on Form 10-K and in our MD&A.

You should not place undue reliance on the company's forward-looking statements. The company has no intention and undertakes no
obligation to update or revise any forward-looking statements, except as required by law.

This presentation includes certain non-GAAP measures. We believe that these non-GAAP measures, which may be defined differently by
other companies, explain our results of operations in a manner that allows for a more complete understanding of the underlying trends in our
business. However, these measures should not be viewed as a substitute for those determined in accordance with GAAP. For a
reconciliation between the non-GAAP measures used in this presentation and our GAAP results, please see our Q3 Fiscal 2021 earnings
press release and supplement available through our website and on EDGAR and SEDAR.                     2

                                                                                                                © 2020 BlackBerry. All Rights Reserved.   2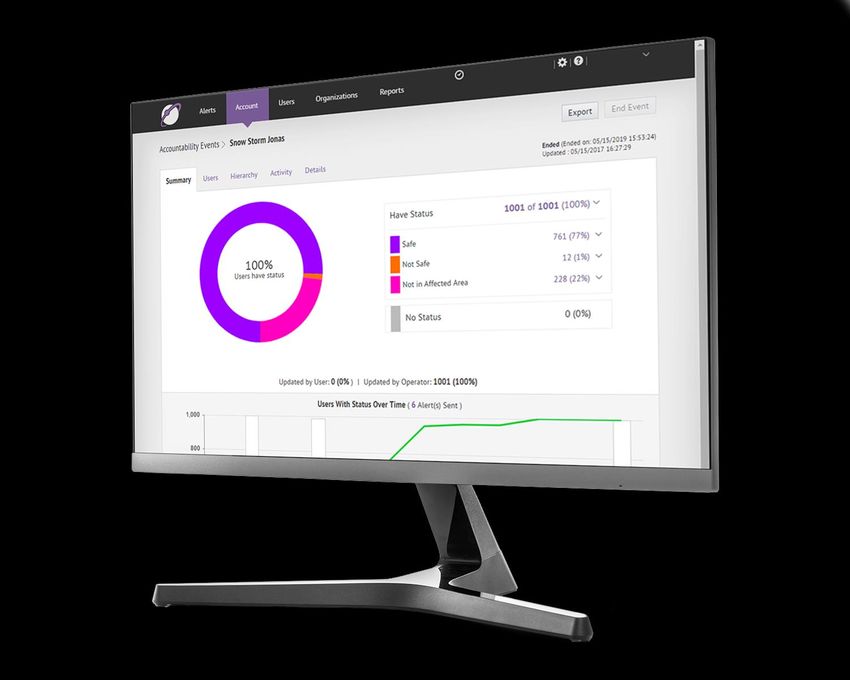
70% of companies       Over 50% of IoT                                     Over 6K vendors,          30% of employees
  allow BYOD           endpoints have                                      creating point-to-         have opened a
                                            BLACKBERRY SECURES
                        been attacked                                     point security gaps         phishing email

Human error is the
 cause of 90% of
  data breaches
                        A new hacking
                        attempt every
                         39 seconds         96%+
                                            OF THE ENTERPRISE
                                                                          97% of cyberattacks
                                                                            are through the
                                                                               endpoint
                                                                                                     79% of employees
                                                                                                       use security
                                                                                                       workarounds

  100M pieces of       24,000 malicious
    malware are                                                            300% increase in
                       third-party apps     THREAT LANDSCAPE                                         4M+ cybersecurity
released every year                                                       cybercrimes during
                           every day                                                                 skills gap globally
                                                                              COVID-19

     90% of           76% of enterprises       1M security alerts are       67B connected           60% of enterprises
  cyberattacks         have been victims        seen daily by over a         endpoints by           have been victims
  go unreported       of phishing attacks     quarter of security teams         2025                  of IoT attacks

                                                                                                Source: Frost & Sullivan, 2020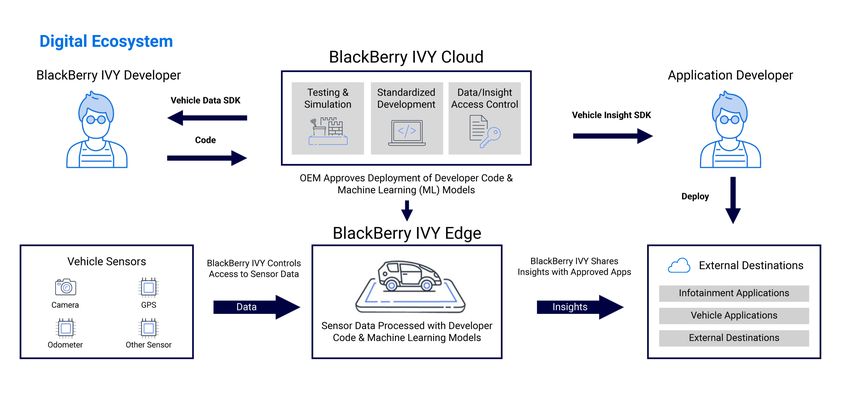
Q3 FY21 Financial Summary

                             $                   %                                                 $
   $224M                 $0.02                  70%                                      $757M
    Non-GAAP             Non-GAAP            Non-GAAP                               Total ending
     Revenue1        Earnings per Share1    Gross Margin1                        Cash & Investments

                                                 %                                                 $
     ~83%               $475M                   90%                                         $31M
Recurring Non-GAAP   Annual Recurring      Dollar-Based Net                                 Adjusted
 Software Product       Revenue2           Retention Rate2                                  EBITDA1,2
    Revenue1,2
                                                        1. See appendix for detail and reconciliation of non-GAAP measures to US GAAP
                                                                                           2. See Form 10-Q for definitions of key metrics
Q3 FY21 Achievements
 AWS and BlackBerry join forces       BlackBerry unveils industry’s first     BlackBerry launches industry’s
 with new intelligent vehicle data     Unified Endpoint Security (UES)      first User Behavior AI technology
    platform, BlackBerry IVY.              Solution for AI-powered                    for cybersecurity,
                                                cybersecurity,               BlackBerry Persona® Desktop.
Multi-year, global agreement to co-       BlackBerry® Cyber Suite.           Uses advanced AI and machine
develop and co-market a software       Delivers security and Zero Trust        learning to deliver continuous
  platform to securely read and          with a zero touch end-user            authentication to validate user
 normalize vehicle data to create        experience through a single          identity in real-time and protect
        actionable insights                        console                       against security breaches

  BlackBerry® Unified Endpoint        BlackBerry QNX has design wins         BlackBerry uncovered massive
  Manager (UEM) software has          with 19 of top 25 Electric Vehicle    Hack-For-Hire Group, BAHAMUT,
   achieved National Security         OEMs, who together have 61% of             targeting governments,
   Agency (NSA) Commercial                        EV market                 businesses, human rights groups
 Solutions for Classified Program                                               and influential individuals
         (CSfC) approval
Investment Highlights

BlackBerry’s Value Proposition
                              BlackBerry will be the must-have software provider for endpoints – how they are built, secured,
                            managed, connected, and integrated via our open and OS agnostic ecosystem. BlackBerry will deliver a
    OUR AMBITION …
                           “whole product” experience that helps organizations realize their digital transformation objectives with
                                                   the highest level of security, innovation and efficiency.

  … CONCENTRATES ON
   WORKING IN THESE
                            Industries that require high-security              Leadership teams who want to                 OEM leadership teams who want to
    INDUSTRIES AND          mobility management, for endpoints               transform their operations for the               manufacture safety-certified
     CUSTOMERS …                      and information                                   digital age                                    endpoints

  … A MARKET FORECAST
TO REACH $38 BILLION USD
       BY 2021 …           Safety-certified, API-enabled endpoints           Secured and managed endpoints                Secure comms between any endpoints

                                     Data science and                                    End-to-end                                           Developer SDKs
… THAT WILL REQUIRE THE              AI/ML algorithms                                    layered security                                     and platform APIs
  FOLLOWING CRITICAL
 DIGITAL CAPABILITIES …                                       Cloud-first and on-                                 Crowd-sourced data lake
                                                              prem deployment                                     of endpoint telemetry

 … DELIVERED PRIMARILY
THROUGH THE FOLLOWING
        ACTIONS.             Zero-trust for unmatched security            Zero-touch for maximum productivity             Connectivity for one global community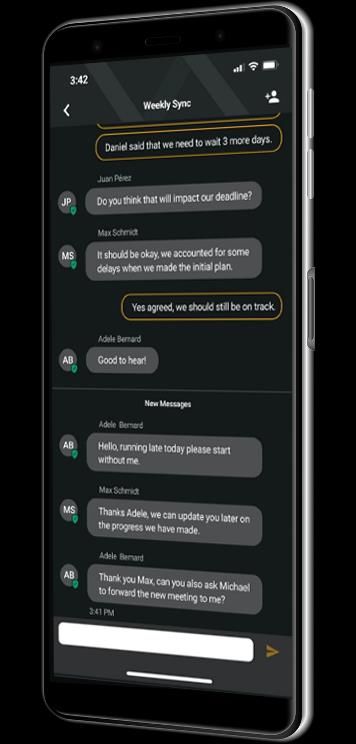
BlackBerry: An Internet of Things Market Leader

   500M+                     175M+                                       19 / 25                                                     38K+
 Endpoints protected     Cars protected by QNX                       Top EV Automakers                                  Patents and applications

                                                                             76%                                                         7%
   AI/ML                       26%                                      (+29 pts)                                                 (+12 pts)
  Industry-leading         Y/Y Software and                    FY20 Gross Margin (and                               FY20 Operating Margin (and
 AI/ML-driven Cyber    Services revenue growth2,3              improvement 2016–20)2                                 improvement 2016–20)2
     software
                                          Notes: 1. FY20 non-GAAP revenue. 2. Non-GAAP. See appendix for detail and reconciliation to US GAAP 3. FY20 vs FY19 non-GAAP revenue
Investment Highlights

Our mission is to enable security from IT to Internet of                                                              Leading software platform for the automotive industry
Things (IoT) in large, critical markets                                                                               Installed in over 175M cars across 45+ automakers
Unique portfolio in a $38B TAM that is organically
                                                                                                                      Unrivaled, broad and diverse blue-chip customer base
growing1
                                                                                                                      7 of G7 governments,18 of G20 governments, 9/10 top
Zero Trust‒based platform for security and                                                                            automakers, 9/10 largest global banks
management of all endpoints and users
                                                                                                                      Transformed into a software-driven business with
Combining next-generation AI with mobile, secure
                                                                                                                      demonstrated operating leverage
communications for IoT
                                                                                                                      ~90% recurring software product revenue with 12 pts
Positioned to secure all IoT endpoints for a                                                                          improvement in operating margin from 2016 to 20203
comprehensive, scalable solution
Effectively secure upwards of 96% of all cyberthreats2

Notes: 1. TAM based on market forecasts from Gartner, IDC, various other third-party sources and internal analyses. 2. Independent research from Frost & Sullivan. 3. Non-GAAP. See appendix for detail and reconciliation to GAAP.
Business Transformation: From Hardware to Software

                                                        FY141                                 FY201

      Revenue
      (% YoY)
                                            $6.8B                                             $1.1B
                                         (38% decline)                                      (20% increase)

       GM %2                                   36%                                             76%
     Adjusted
     EBITDA                             $194M                                                $149M
        %2                                      3%                                              14%

         FCF
          %2
                                        ($393M)                                               $14M
                                                (6%)                                             1%

        M&A

 BlackBerry Has Undergone a Significant Shift in Its Business Model and Financial Profile.
 Notes: 1. Amounts shown are non-GAAP. 2. Percentages are calculated on non-GAAP revenue.
BlackBerry’s Customers and Partners
Top-Tier Customers Top-Tier Partners
18/20
#/#
G20 GOVERNMENTS
9/10
#/#
TOP GLOBAL BANKS
9/10
#/#
TOP AUTOMAKERSStrategic Priorities
FY21 AND BEYOND – FOCUSED ON GROWTH
Unlock synergies from Close pipeline Drive Professional Gain market share in Successfully bring
integration of UEM and opportunities, grow Services both automotive new product
Cylance and deliver on partnerships and expansion safety systems and innovations to
Spark, our end-to-end, increase market other general market
unified platform for share in regulated embedded markets
endpoint security and industry verticals
managementTimeless Model Goals
Goals
Recurring Software Product Revenue2 (%) ~90%
Gross Margin1 (%) ~80–85%
Operating Income1 (%) ~20–25%
Adjusted EBITDA1 (%) ~25–30%
1. See appendix for detail and reconciliation of non-GAAP measures to U.S. GAAP. 2. See Form 10-Q for definitions of key metrics.Opportunities for Long-Term Growth
We have the right strategy, the right technology and are playing in the right markets.
Accelerate Growth • Investing in growth • Sustainable revenue
Opportunities • Opportunities to lead in growth
large markets
• Innovating and investing • Long-term value
Capture the Future in future categories creation
• Recurring revenue growth • Increased earnings power
Scalable Financial • Greater cash flow
• Efficient operating models
Model generationBlackBerry IVY
BlackBerry IVY - Opportunity to harness data in the car
Diverse sensors generate huge amounts of data in unique formats
BlackBerry IVY’s Digital Ecosystem
Enabling a cross-brand, cross-model app & services ecosystem
BlackBerry IVY’s Addressable Market
Access to standardized, intelligent insights leads to endless possibilities

                                                                              Automakers / Suppliers

                                                                                  App Developers

                                                                                    Consumer Services

                                                                                     Smart Cities

                                                                                   EV charging providers

                                                                                Insurance Companies

                                                                         Vehicle maintenance providers
BlackBerry IVY – Strategic Alliance for Co-Development Why did we co-invest in this partnership to jointly build a single solution? • Trusted leader in automotive safety and • Leading global cloud provider with a culture security of innovation • Deep knowledge of embedded automotive • Unmatched machine learning expertise and software systems IoT capabilities • Exceptional track record of delivery, • Proven builder of successful developer integration, and support ecosystems
Spark Suite
                                         INTERACTION LAYER
                                 APPS + AGENTS + CONSOLES + MICRO-SERVICES

                                               Spark Suite

          Unified Endpoint Security                                Unified Endpoint Management

       Endpoint         Endpoint Detection &                        SDK/API &     Digital Rights    Regulated
      Protection            Response                               Custom Apps    Management         Controls
                                               Identity & Access
                                                 Management                  UEM Express Suite

    Mobile Threat           Continuous                                Device                         Secure
      Defense              Authentication                           Management                     Productivity
                                                                                                      Apps
  CROWD-DRIVEN AI SECURITY LAYER                                     ENDPOINT MANAGEMENT LAYER
Why Unify Endpoint Security &
Endpoint Management?
TOO MANY VENDORS MOBILE IS VULNERABLE ENDPOINTS ARE CHANGING
70% 50% 40%
of organizations will have of organizations will have of workers use wearables
a unified console mobile threat defense as primary devices
By 2024, the adoption of Windows 10, By 2023, 50% of organizations will have By 2023, 40% of frontline workers will use
Google Chrome OS and Apple macOS will mobile threat defense (MTD) in place, wearables as their primary computing
drive the need for a combined endpoint growing from less than 20% of devices, an increase from less than 10%
management console in more than 70% organizations in 2020. in 2019.
of organizations.
*Gartner Report, "Predicts 2020: Mobile and Endpoint Technologies," Feb. 3, 2020What is Zero Trust?
AI SECURITY
Behavioral Constant
Analytics Monitoring
HUMAN MACHINE
Continuous Adaptive
Authentication ZERO TRUST Policy
The components work in concert as a foundation for a Zero Trust enterprise security architecture.Secure Embedded OS
to Secure the ‘Edge’
SMART HOME SMART CAR SMART CITY
Artificial Intelligence‒based Security
Complex Domain
Telematics
Controllers
Acoustics
Secure
Gateways
Infotainment
V2X
CLOUD SERVICES Control
Systems
Instrument
• OTA Clusters
• Jarvis Digital
Traditional
Cockpit
ADAS,
Active Safety GrowthBlackBerry QNX
AUTOMOTIVE CONVERGING TRENDS IMPACT
• Cars are becoming ‘smarter.’
• Software is reaching more safety-
critical parts of the car.
Autonomous Digitization • An increasing portion of new cars have
(Levels 2‒5) (Via connectivity) a significant software component.
• Commoditization of hardware and the
emergence of software are key
differentiators.
• An increased need for cybersecurity.
Auto-Mobility Electrification
(Rideshare, etc.) (New everything)Critical Event Management
KEEP YOUR PEOPLE SAFE REDUCE IT DOWNTIME
How do you communicate to your staff, In the event of a system outage, can you
contractors, visitors and students quickly if automatically communicate and coordinate a
there is an incident? response and short-term workarounds to reduce
downtime?
GET CLEAR, TIME-CRITICAL FEEDBACK MINIMIZE DISRUPTIONS
How do you collate feedback from your people as What are the threats you can anticipate and how
they are responding to a critical event, so you have do you keep track of changing threat levels from
the full picture? weather and natural events, cyberattacks and local
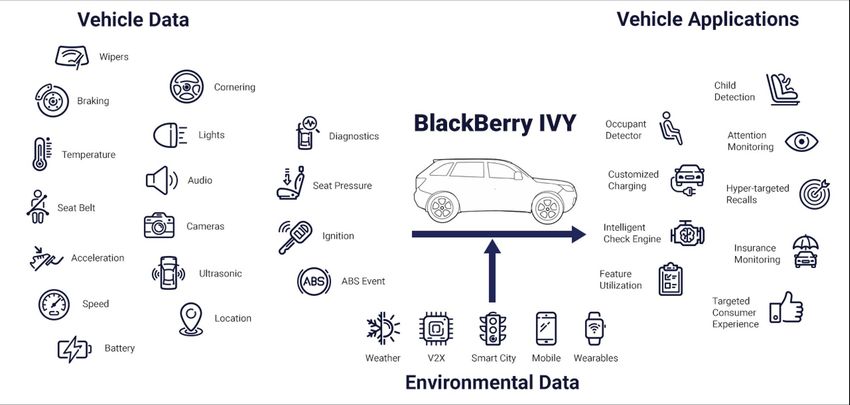
authority warnings?Critical Event Management • Notify anyone, anywhere, on any device. • Gather critical information from your people to achieve situational awareness. • Gain real-time visibility into your personnel status and location. • Communicate and collaborate with other organizations.
Critical Event Management

         END-TO-END CRISIS MANAGEMENT

         Plan             Respond             Collaborate

Alert           Collect             Account           Connect

Secure          Unified             Mobile             Flexible
BlackBerry SecuSUITE
Secure Voice & Messaging Sovereign Network
Built to meet national security standards; Uses a closed virtual network, so you will
offering end-to-end security for voice calls never be bothered by adware or spam
and messages on standard iOS and calls.
Android devices.
Control of Metadata
Encrypted Communication What is collected, who has access.
Protects the content of your
communication with strong encryption. Security Certifications
Regularly undergoes rigorous certification
Contact Verification reviews to meet the strictest standards;
Continually confirms the identities of your its proven technology is trusted by key
contacts and their devices, so you can governments around the world.
talk confidently with protection from
identity spoofing.BlackBerry SecuSUITE
EASY & INTUITIVE TO USE
The app is easy and intuitive to use and offers
high-quality voice on both Wi-Fi and cellular data.
ENTERPRISE INTEGRATION
It can also be easily integrated into your
enterprise telephony system, making it the perfect
addition to a secure working environment.Appendix (Q3 FY21 Financials)
GAAP Income Statement ($M)
                                                           Q1-20          Q2-20          Q3-20           Q4-20      FY 2020       Q1-21        Q2-21       Q3-21

  Software & Services                                  $       168    $       168    $       185     $       170    $      691    $   148     $   151     $   162
  Licensing and Other                                            79             76             82            112           349          58        108           56
Total GAAP Revenue                                             247            244            267             282         1,040        206         259         218
Cost of Sales                                                    70             68             69             70           277          63          60          69
Gross Profit                                                   177            176            198             212           763        143         199         149
  Research and Development                                       71             62             66             60           259          57          57          53
  Selling, Marketing and Admin                                 121            130            129             113           493          90          79          83
  Amortization                                                   49             48             49             48           194          46          46          45
  Impairment of Long-lived Assets                              -                 2              3              5            10        -             21        -
  Impairment of Goodwill                                       -              -              -                22            22        594         -           -
  Debentures Fair Value Adjustment                             (28)           (23)           (20)              5           (66)          1          18          95
  Total Operating Expenses                                     213            219            227             253           912        788         221         276
GAAP Operating Loss                                            (36)           (43)           (29)            (41)         (149)      (645)        (22)       (127)
  Investment Income (Loss), Net                                   3           -                (1)            (1)            1        -             (5)         (1)
Loss before Income Taxes                                       (33)           (43)           (30)            (42)         (148)      (645)        (27)       (128)
  Provision for (recovery of) income taxes                        2              1              2             (1)            4          (9)         (4)          2
GAAP Net Loss                                          $       (35)   $       (44)   $       (32)    $       (41)   $     (152)   $ (636)     $   (23)    $ (130)
  Basic Loss per Share                                 $     (0.06)   $     (0.08)   $     (0.06)    $     (0.07)   $    (0.27)   $ (1.14)    $ (0.04)    $ (0.23)
  Diluted Loss per Share                               $     (0.09)   $     (0.10)   $     (0.07)    $     (0.07)   $    (0.32)   $ (1.14)    $ (0.04)    $ (0.23)

Weighted-average number of common shares outstanding
 Basic                                                     551,845        552,343        554,585         556,668        553,861   557,839      558,882     562,443
 Diluted                                                   612,345        612,843        615,085         556,668        614,361   557,839      558,882     562,443
Non-GAAP Reconciliation ($M) Non-GAAP Adjustments (Pre-Tax and After-Tax) Q1-20 Q2-20 Q3-20 Q4-20 FY 2020 Q1-21 Q2-21 Q3-21 Debentures Fair Value Adjustment (28) (23) (20) 5 (66) 1 18 95 Restructuring Charges 1 1 7 1 10 1 1 - Software Deferred Revenue Acquired 20 17 13 9 59 8 7 6 Software Deferred Commission Acquired (5) (4) (4) (3) (16) (3) (3) (4) Stock Compensation Expense 17 14 15 17 63 14 9 12 Acquired Intangible Amortization 35 36 35 35 141 33 32 32 Business Acquisition and Integration Costs 1 2 - 1 4 - - - Goodwill Impairment Charge - - - 22 22 594 - - LLA Impairment Charge - 2 3 5 10 - 21 - Acquisition valuation allowance (1) - - - (1) - - - Total Non-GAAP Adjustment (Pre-Tax and After-Tax) $ 40 $ 45 $ 49 $ 92 $ 226 $ 648 $ 85 $ 141 GAAP to non-GAAP Gross Profit Q1-20 Q2-20 Q3-20 Q4-20 FY 2020 Q1-21 Q2-21 Q3-21 GAAP Revenue $ 247 $ 244 $ 267 $ 282 $ 1,040 $ 206 $ 259 $ 218 Software Deferred Revenue Acquired 20 17 13 9 59 8 7 6 Non-GAAP Revenue 267 261 280 291 1,099 214 266 224 GAAP Cost of Sales 70 68 69 70 277 63 60 69 Non-GAAP Adjustments to Cost of Sales (2) (2) (4) (2) (10) (2) (1) (1) Non-GAAP Cost of Sales 68 66 65 68 267 61 59 68 Non-GAAP Gross Profit 199 195 215 223 832 153 207 156
Non-GAAP Reconciliation ($M) (Cont.)
Adjusted EBITDA                                                          Q1-20         Q2-20         Q3-20         Q4-20        FY 2020       Q1-21        Q2-21       Q3-21

GAAP Operating Loss                                                     $      (36) $       (43) $        (29) $        (41) $       (149) $     (645) $       (22) $      (127)
   Non-GAAP Adjustments to Operating Income                                     41           45            49            92           227         648           85          141
Non-GAAP Operating Income                                                        5            2            20            51            78           3           63           14
Amortization                                                                    53           54            53            52           212          50           50           49
   Acquired Amortization Intangibles                                           (35)         (36)          (35)          (35)         (141)        (33)         (32)         (32)
Adjusted EBITDA                                                                 23           20             38            68           149          20           81          31

Reconciliation from GAAP Net Loss to Non-GAAP Net
Income and Non-GAAP Earnings per Share                                   Q1-20         Q2-20         Q3-20         Q4-20        FY 2020       Q1-21        Q2-21       Q3-21

GAAP Net Loss                                                           $      (35) $       (44) $        (32) $        (41) $       (152) $     (636) $       (23) $      (130)
  Total Non-GAAP Adjustment (After-Tax)                                         40           45            49            92           226         648           85          141
Non-GAAP Net Income                                                              5            1            17            51            74          12           62           11

Non-GAAP Basic Earnings per Share                                       $     0.01 $       0.00 $        0.03 $        0.09 $        0.13 $      0.02 $       0.11 $       0.02
 Shares outstanding for Non-GAAP income per share
 reconciliation ('000)                                                      551,845     552,343       554,585      556,668       553,861      557,839      558,882     562,443

Non-GAAP Revenue, non-GAAP Gross Profit, non-GAAP Operating Income, non-GAAP Net Income, Adjusted EBITDA, and non-GAAP Earnings Per Share do not have a standardized
meaning prescribed by GAAP and thus are not comparable to similarly titled measures presented by other issuers. The Company believes that the presentation of these non-GAAP measures
enables the Company and its shareholders to better assess the Company's operating results relative to its operating results in prior periods and improves the comparability of the information
presented. This non-GAAP information should not be considered as a substitute for, or superior to, measures of financial performance prepared in accordance with GAAP. You are encouraged
to review the Company's filings on SEDAR and EDGAR. The company makes no commitment to update the information above subsequently.
Amortization And Reconciliation Details ($M) Restructuring Charges Details (Pre-Tax) Q1-20 Q2-20 Q3-20 Q4-20 FY 2020 Q1-21 Q2-21 Q3-21 Cost of Sales $ 1 $ 1 $ 3 $ - $ 5 $ - $ - $ - Selling, Marketing and Administration - - 4 1 5 1 1 - Total Restructuring Charges $ 1 $ 1 $ 7 $ 1 $ 10 $ 1 $ 1 $ - Amortization of Intangibles and PP&E Details Q1-20 Q2-20 Q3-20 Q4-20 FY 2020 Q1-21 Q2-21 Q3-21 Cost of Sales Amortization Property, Plant and Equipment $ 1 $ 2 $ 1 $ 2 $ 6 $ 1 $ 1 $ 1 Intangibles Assets 3 4 3 2 12 3 3 3 Total in Cost of Sales 4 6 4 4 18 4 4 4 Operating Expenses Amortization Property, Plant and Equipment $ 5 $ 4 $ 5 $ 4 $ 18 $ 4 $ 5 $ 4 Intangibles Assets 44 44 44 44 176 42 41 41 Total in Operating Expenses Amortization 49 48 49 48 194 46 46 45 Total Amortization Property, Plant and Equipment $ 6 $ 6 $ 6 $ 6 $ 24 $ 5 $ 6 $ 5 Intangibles Assets 47 48 47 46 188 45 44 44 Total Amortization 53 54 53 52 212 50 50 49 The information above is supplied to provide meaningful supplemental information regarding the Company's operating results because such information excludes amounts that are not necessarily related to its operating results. The Company believes that the presentation of these non-GAAP measures enables the Company and its shareholders to better assess the Company's operating results relative to its operating results in prior periods and improves the comparability of the information presented. This non-GAAP information should not be considered as a substitute for, or superior to, measures of financial performance prepared in accordance with GAAP. You are encouraged to review the Company's filings on SEDAR and EDGAR. The company makes no commitment to update the information above subsequently.
investorinfo@blackberry.com

# B L A C K B E R R Y T R U S T    |   # S E C U R I T Y   |   # P R I V A C Y   |   # C O N T R O L
You can also read