SNC-Lavalin: An Overview - Investor Presentation November 2019
←
→
Page content transcription
If your browser does not render page correctly, please read the page content below

SNC-Lavalin: An Overview
›   Investor Presentation
›   November 2019
Forward-looking statements
Reference in this presentation, and hereafter, to the “Company” or to “SNC-Lavalin” means, as the context may require, SNC-Lavalin Group Inc. and all or some of its subsidiaries or joint
arrangements, or SNC-Lavalin Group Inc. or one or more of its subsidiaries or joint arrangements.
Statements made in this presentation that describe the Company’s or management’s budgets, estimates, expectations, forecasts, objectives, predictions, projections of the future or strategies may
be “forward-looking statements”, which can be identified by the use of the conditional or forward-looking terminology such as “aims”, “anticipates”, “assumes”, “believes”, “cost savings”, “estimates”,
“expects”, “goal”, “intends”, “may”, “plans”, “projects”, “target”, “should”, “synergies”, “vision”, “will”, or the negative thereof or other variations thereon. Forward-looking statements also include any
other statements that do not refer to historical facts. Forward-looking statements also include statements relating to the following: (i) future capital expenditures, revenues, expenses, earnings,
economic performance, indebtedness, financial condition, losses and future prospects; and (ii) business and management strategies and the expansion and growth of the Company’s operations. All
such forward-looking statements are made pursuant to the “safe-harbour” provisions of applicable Canadian securities laws. The Company cautions that, by their nature, forward-looking statements
involve risks and uncertainties, and that its actual actions and/or results could differ materially from those expressed or implied in such forward-looking statements, or could affect the extent to which
a particular projection materializes. Forward-looking statements are presented for the purpose of assisting investors and others in understanding certain key elements of the Company’s current
objectives, strategic priorities, expectations and plans, and in obtaining a better understanding of the Company’s business and anticipated operating environment. Readers are cautioned that such
information may not be appropriate for other purposes.
Forward-looking statements made in this presentation are based on a number of assumptions believed by the Company to be reasonable as at the date hereof. The assumptions are set out
throughout the Company’s 2018 Management Discussion and Analysis (MD&A) and as updated in the first, second and third quarters of 2019. If these assumptions are inaccurate, the Company’s
actual results could differ materially from those expressed or implied in such forward-looking statements. In addition, important risk factors could cause the Company’s assumptions and estimates to
be inaccurate and actual results or events to differ materially from those expressed in or implied by these forward-looking statements. These risk factors are set out in the Company’s 2018 MD&A and
as updated in the first, second and third quarters of 2019.

Non-IFRS financial measures and additional IFRS measures
The Company reports its financial results in accordance with IFRS. However, the following non-IFRS measures and additional IFRS measures are used by the Company: Adjusted net income from
E&C, Adjusted diluted EPS from E&C, Adjusted net income from Capital, Adjusted diluted EPS from Capital, Adjusted consolidated diluted EPS, EBITDA, Adjusted E&C EBITDA and Segment EBIT.
Additional details for these non-IFRS measures can be found in SNC-Lavalin’s MD&A, which is available in the Investors section of the Company’s website at www.snclavalin.com. Non-IFRS financial
measures do not have any standardized meaning under IFRS and therefore may not be comparable to similar measures presented by other issuers. Management believes that, in addition to
conventional measures prepared in accordance with IFRS, these non-IFRS measures provide additional insight into the Company’s financial results and certain investors may use this information to
evaluate the Company’s performance from period to period. However, these non-IFRS financial measures have limitations and should not be considered in isolation or as a substitute for measures of
performance prepared in accordance with IFRS.

                                                                                                                                                                                                                2
SNC-Lavalin: shaping & delivering world-leading concepts & projects

                                                                      3
A global leader in professional services & project management
                                                           Founded in

SNC-Lavalin is…                                             1911
A fully integrated professional services and                Employees
project management company with offices
around the world.                                        ~50,000
SNC-Lavalin connects people, technology and                  Revenue
data to help shape and deliver world-leading
concepts and projects, while offering
comprehensive innovative solutions across the
                                                           ~$10B
asset lifecycle in four strategic sectors.
                                                          Listed on TSX

                                                           “SNC”
                                                            Since 1986

                                                  Investment Grade Credit Rating1

                                                     BBB- & BB+

                       1   Per DBRS and S&P.
                                                                                    4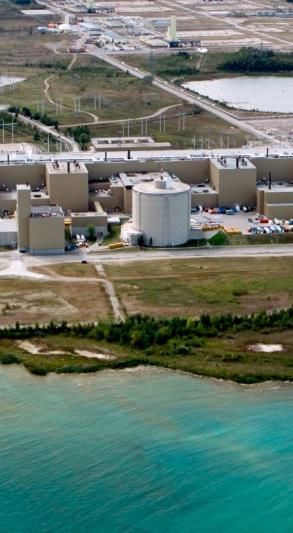
Operating in 4 regions across the world
                                          Breadth of geographic
                                          exposure
                 Europe
                                                     Americas
                ~13,000
                                                     Middle East & Africa
                                                     Asia Pacific
                                                     Europe
   Americas
   ~15,000           Middle
                                 Asia
                      East
                                Pacific   2018 Revenues
                     & Africa
                                ~5,000
                    ~15,000
                                               20%

                                          7%     $10.1B      49%
                                                                   Canada 29%
                                                                   USA 17%
                                               24%                 Latin America 3%

                                                                                      5
Providing a comprehensive end-to-end service offering …

       Consulting     Intelligent networks      Design        Procurement    Project & Construction     Operations    Sustaining Capital   Decommissioning
       & Advisory       & cybersecurity      & Engineering                        Management          & Maintenance

  …in four sectors of activity                                                                                                         Supported by:

  Engineering, Design and                    Infrastructure                 Nuclear                       Resources                         Capital
Project Management (EDPM)

                                                                                                                                                             6
Strategy

           7
New strategic direction
Positioning SNC-Lavalin for long-term sustainable success

         Exit LSTK*
         construction work
                                       Goals of New Strategic Direction:
                                       ›   Simplified business                            Grow
         Reorganize                    ›   Reduced risk                                 Engineering
         the Company                   ›   Focus on strengths                            Services
                                       ›   Generate consistent earnings and cash flow

         Restructure
         Resources segment

             *LSTK: Lump-sum turnkey
                                                                                                      8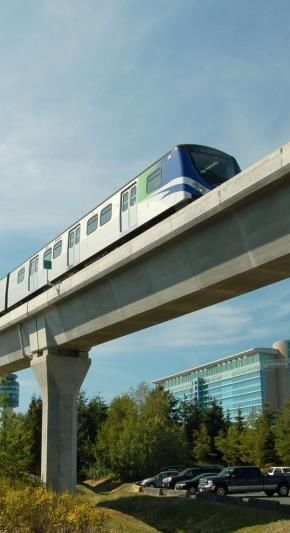
Why exit the LSTK model?
› The current LSTK contracting model within the industry is
  broken as it places undue risk on the company
                                                                          “The volatility and
› Many of SNC-Lavalin’s industry peers have also exited                   unreasonable risk
  LSTK                                                            associated with lump-sum,
› By exiting this contracting model and running off the LSTK
  project backlog as efficiently as possible, SNC-Lavalin will
                                                                 turnkey projects have been
  be able to significantly reduce risk while optimizing free           the root cause of the
  cash flow generation from the higher performance parts of
  the business                                                      Company’s performance
› The world is moving to a digitized, technology                                     issues.”
  environment. Given our innovative solutions, SNC-Lavalin
  is well positioned to capture the benefits of this change.                    - Ian L. Edwards

                                                                                                   9
Expected phase out of the main LSTK construction projects in
SNCL Projects backlog
                                                                 Backlog Phasing
                             1,400
  Backlog (in C$ millions)

                             1,200                                                                           Infrastructure EPC
                                                                                                             Projects
                             1,000
                                                                                                             Resources
                              800

                              600

                              400

                              200

                                0
                                           2019        2020           2021            2022            2023           2024
                                     (last 3 months)
                                                              Expected Annual Conversion to Revenue

                                                                                                                                  10
Reorganized the Company into two clear businesses
2
SNCL Engineering Services SNCL Projects
(growth & future) (controlled exit)
› Infrastructure LSTK projects run off
› Resources LSTK projects run off
EDPM Nuclear Infrastructure Capital
Business › Resources Engineering Services (exploring a
combination of closures and divestitures and
Services lines potential transition to services-based
business)
11Restructuring Resources segment
› De-risking and Optimizing the Business
1. Running off existing Resources
LSTK backlog
2. Exploring all options for Oil & Gas production
and processing fabrication facilities
3. Right-sizing and assessing a transition
to services
12New strategy demonstrating results: SNCL Engineering Services
Dynamic, high-performing business delivering strong margins
Revenue Segment EBIT Segment EBIT Ratio
252.9
1,574 1,582 16.0%
1,419
184.8 192.5 13.0%
12.2%
SNCL Engineering Services ($M) SNCL Engineering Services ($M) SNCL Engineering Services
Q3 2018 Q2 2019 Q3 2019 Q3 2018 Q2 2019 Q3 2019 Q3 2018 Q2 2019 Q3 2019
13SNCL Engineering Services:
Future growth opportunities
14EDPM growth opportunities
› Transformational projects shaping the future
› Hinkley Point C
› Multi-Use Corridors
Initiative
› Freight Rail
Infrastructure Project
› Quebec City Tramway &
Montreal Port Terminal
Hinkley Point C Freight Rail Infrastructure Project Quebec City Tramway
United Kingdom Australia Canada
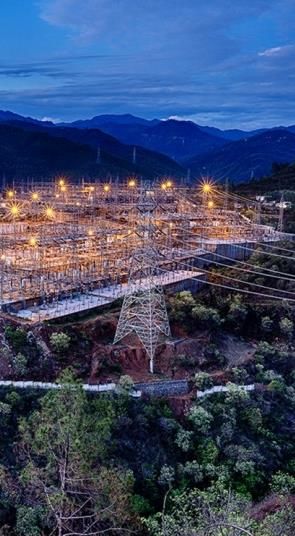
15Nuclear growth opportunities
Building on our industry-leading position in CANDU-
related services and products
› CANDU
› Non-CANDU
› Decommissioning
Darlington Hunterston B Oyster Creek
16Infrastructure Services growth opportunities
SNC-Lavalin has a global market-leading position in rail and transit
› Ottawa LRT
› Montreal Airport
Confederation Line Montreal Airport
17Valuation
18Based on peers, SNCL Engineering Services is a 9 – 10x EBITDA business
EDPM › 2020E EBITDA Margin Benchmarking (1) Average EV / 2020E EBITDA (1)
Average:
14%
11.0x
Nuclear
Average: 11.7x
13%
Infra. Services
Average:
10% 7.2x
(2)
SNCL Engineering Services’ EBITDA ~9 – 10.0x
Margin Currently Commands a ~9 - 10x
› Source: Capital IQ, Company Fillings Valuation in the Market, Based on Peers
Notes:
1. All peers presented on a post IFRS-16 basis. Adjustments made to enterprise value by adding operating
leases, and to EBITDA by adding back incremental lease D&A are made, where applicable
2. Represents average of Q3 2019 YTD segment EBITDA margin for EDPM, Nuclear and Infrastructure Services
19Company’s view of value today
2020E E&C EBITDA
Multiple
9.0x 10.0x
SNCL Engineering
Using average E&C peer EBITDA
›
Services Enterprise Value ~$5,100
~$6,075 ~$5,690
~$6,750
multiple of 9x – 10x, SNCL Engineering ($M) (1)
Services’ equity value is ~$7.2 – $7.9B
Net Debt ($M) (2) ~($1,250) ~($1,250)
~($1,250) ~($1,250)
Current SNC-Lavalin market valuation
implies cumulative legal costs and Value of 407 Stake &
losses of ~$3.0 – $3.7B Other Capital Investments ~$2,400
~$2,400 ~$2,400
~$2,400
($M) (3)
While it is difficult to predict a precise
outcome for the remainder of the LSTK Implied Equity Value
($M / sh.)
~$6,300 //~$36
~$7,200 ~$41 ~$6,800 //~$39
~$7,900 ~$45
backlog, every $100M of profit / loss on
these projects would represent ~$0.55
Current SNC Market Cap.
per share of value on a pre-tax basis ($M / sh.)
~$4,600 //~$26
~$4,200 ~$24 ~$4,600 //~$26
~$4,200 ~$24
Market Implied LSTK and
~$3,000 / ~$17 ~$3,700
~$2,200 //~$13
~$21
Legal Costs
~42% Discount ~32% Discount
($M / sh.) ~47% Discount
Notes:
1. Assumes analysts’ consensus SNCL Engineering Services 2020E E&C EBITDA of $675M (when analysts’ numbers are available and
on an IFRS 16 basis)
2. Composed of recourse and limited recourse debt of ~$1.6B, capital leases of ~$0.6B, and cash of ~$0.9B, as of 9/30/2019
3. Assumes analysts’ consensus
20Managing & pricing risk
21Manageable LSTK risks and financial impact
› Nigel White, EVP Project Oversight, appointed to manage backlog run off;
› Undertook a comprehensive review of SNCL Projects with focus on LSTK backlog and the project management controls;
› Working with sector presidents and delivery teams to introduce measures to enhance risk management and optimize
outcomes;
› Establishing an oversight team to strengthen on-site project delivery teams and introducing enhanced controls and strategies;
› Vast majority of the remaining $3.2 billion of the LSTK contracts are in Infrastructure, worth approx. $2.7 billion (84%)
› Composed largely of Canadian light rail projects, where the Company has had a history of profitable performance.
› Remaining LSTK backlog is in Resources (primarily oil and gas)
› Majority of Resources LSTK are expected to be run off over the next two years;
› LSTK risk is manageable. We will work to quickly identify issues as they emerge and deal with them effectively.
22SNCL Projects backlog details
SNCL Projects Resources
Total Backlog Reimbursable &
(September 30, 2019) Engineering Service
Contracts
$1.0B
Resources 37%
Main Projects
Resources
Lump-sum turnkey 2 in North America
construction contracts
3 in MENA
$4.2B $0.5B
Main Projects
Infrastructure REM (LRT)
Infrastructure Lump-sum turnkey
63%
EPC Projects construction contracts Trillium (LRT)
$2.7B Eglinton (LRT)
Husky White Rose
Backlog corresponds to the “Remaining performance obligations” (“RPO”), which is based on IFRS 15, Revenue from
Contracts with Customers (“IFRS 15”).
23Main LSTK construction projects in SNCL Projects backlog
Resources Country Completion % Expected substantial Backlog as at Client
Project (SNC-Lavalin completion year Sept. 30, 2019
portion)
($M)
Project #1 MENA 55 2021LSTK – 2014 to 2019 project revenues & gross margin % by activity
20
15 Clean Power
10 Others
LRT
Project Performance % 5
0 M&M O&G
-5
Hospital
Roads and Bridges
-10
-15 Thermal Power
-20
1.0 1.5 2.0 2.5 3.0 3.5 4.0 4.5 5.0 5.5
Project Revenues, in $B
M&M: Mining Metallurgy
O&G: Oil & Gas
LRT: Light Rail Transit systems Note: includes completed and near completion projects
25In summary
26Solid Q3 results a step in the right direction
Q3 results show
considerable improvement
over previous quarters
Net Income Adjusted Net Debt Reduced SNCL Engineering SNCL Projects
Income from E&C Services Delivers
Strong Results
$2.8 billion $165.3 million, $2.4 billion Year-over-year and SNCL Projects
up 33% year-over-year quarter-over-quarter Segment EBIT of
mainly due to sale of decrease improvements in backlog, ($45M), performance
10.01% stake in Highway in debt; net recourse debt revenue, Segment EBIT better than the past
407 ETR for net gain of to EBITDA ratio is 3.4x(1), and Segment EBIT Ratio three quarters
$2.6 billion within covenant.
(1) In accordance with the terms of the Company’s Credit Agreement
27Considerably strengthened balance sheet
› $2.4 billion decrease in debt
› Cash balance of $939 million
› Net recourse Debt to EBITDA ratio of 3.4x(1),
within covenant
Strengthening balance sheet by focusing on the
high-margin areas of the business that generate
consistent earnings and cash flow
(1) In accordance with the terms of the Company’s Credit Agreement
28Conclusion
New strategy showing positive results; Company
remains focused on delivery and execution
4 Pillars Areas of Focus
1. Exit LSTK Construction Work › Continued delivery on Company strategy
2. Focus on Engineering Services Work › Effective risk management and LSTK execution
3. Restructure Resources Segment › Leverage Company strengths
4. Strengthen Balance Sheet › Enhance visibility
› Demonstrate results
29Appendices
30Capital investments portfolio
Name Description Held Concession Location Equity
Since Years Participation
1. 407 EDGGP 32 km H407 East extension (Phase 1) 2012 33 Canada (Ontario) 50%
2. Carlyle Global Infras. Opportunity Fund LP Holding investments in infrastructure projects 2018 n/a United States 8.1%
3. Eglinton Crosstown 19 km light rail line 2015 36 Canada (Ontario) 25%
4. Highway 407 (407 ETR) 108 km electronic toll road 1999 99 Canada (Ontario) 6.76%
5. Highway Concessions One PL Fund (Roads) 2012 n/a India 10%
6. InPower BC John Hart 126 MW generating station 2014 19 Canada (B.C.) 100%
7. Myah Tipaza Seawater desalination plant 2008 n/a Algeria 25.5%
8. Rideau Light rail transit system 2013 30 Canada (Ontario) 40%
9. SKH 1,227 MW gas-fired power plant 2006 n/a Algeria 26%
10. SSL New Champlain bridge corridor 2015 34 Canada (Quebec) 50%
11. TC Dôme 5.3 km electric cog railway 2008 35 France 51%
12. TransitNEXT 12 km light rail line 2019 30 Canada (Ontario) 100%
Ownership through SNC-Lavalin Infrastructure Partnership LP
13. Chinook 25 km six-lane road 2010 33 Canada (Alberta) 10%
14. InTransit BC Rapid transit line 2005 35 Canada (B.C.) 6.7%
15. MIHG McGill University Health Centre 2010 34 Canada (Quebec) 10%
16. Okanagan Lake Floating bridge 2005 30 Canada (B.C.) 20%
17. Rainbow Restigouche Hospital Centre 2011 33 Canada (N.B.) 20%
NBV1 = $399M FMV2 ~$2.4B
1 Net Book Value as at September 30, 2019
2 Average Fair Market Value as per analysts calculations, as at November 25, 2019
31Q3 2019 financial performance (vs Q3 2018)
Net income attributable to SNC-Lavalin Shareholders of $2.8B Q3 Adjusted net income from E&C of $165M, or $0.94/share
› Net gain of $2.6B ($14.74/share) on the disposal of a 10.01% stake in › Recognition of $83M ($0.47/share) in income tax recoveries on capital losses,
Highway 407 ETR following the disposal of a 10.01% stake in Highway 407 ETR
Revenue of $2.4B Backlog1 of $15.6B as at September 30, 2019
› 11.5% increase in SNCL Engineering Services, due to Infrastructure › 9.8% increase to $11.4B in SNCL Engineering Services (YTD19 book-to-bill
Services and EDPM ratio of 1.2)
› 25.7% decrease in SNCL Projects, due to the continuing backlog run off of › Q3 bookings for SNCL Engineering Services = $1.8B
certain LSTK construction projects › 11.3% decrease to $4.2B in SNCL Projects, as a result of the Company’s
decision to cease bidding on LSTK construction contracts
Total segment EBIT of $208M
› Positive Segment EBIT in SNCL Engineering Services of $253M, an
Liquidity
increase of 36.8% (35.5% excluding Capital)
› $939M of cash and cash equivalents
› Negative Segment EBIT in SNCL Projects of ($45M)
› $1.6B of recourse and limited recourse debt, a reduction of $2.4B since June
30, 2019
Corporate SG&A expenses from E&C of $12.8M › Net recourse debt to adjusted EBITDA ratio, as per the Company’s Credit
› Compared to a recovery of $15.0M in Q3 2018 Agreement of 3.4x
› Q3 2018 included a $16.2M favorable impact from revised estimates on › Operating cash flows for Q319 negative $51M
legacy sites environmental liabilities and other asset retirement obligations › Operating cash flows from SNCL Engineering Services (excl. Capital) of $350M,
representing a ~85% Segment EBIT conversion
1 Backlog represents the Remaining Performance Obligations, an IFRS measure
32Operating cash flows YTD 2019
(in M$)
Q1 2019 Q2 2019 Q3 2019
› Operating cash flow was negative $668M with Q3
negative $51M
($51) › Operating cash flow generation from SNCL
Engineering Services (excl. Capital) of $350M
› SNCL Engineering Services Segment EBIT (excl.
Capital) conversion of 88%
› Operating cash flow generation from Capital of
$128M
($249)
› Operating cash flows used from SNCL Projects of
($720M)
› Operating cash flows used from other Corporate
($367) items (i.e. interest expense, Corporate SG&A,
restructuring…) of ($426M)
33Strong balance sheet as at September 30, 2019
Credit facilities Debt
Revolving Facility Recourse
› $2,516M undrawn under the $2,600M $300M Series 1 Debenture Cash
revolving Facility maturing May 2022 › Maturity: November 2020 $939M
› Interest rate: 2.689%
› $3,000M uncommitted bilateral facilities $175M Series 3 Debenture
› Maturity: March 2021 Debt to EBITDA Ratio
› Current maximum leverage ratio of 4x › Interest rate: floating rate Net recourse debt to EBITDA ratio in accordance with
$200M Series 4 Debenture the terms of the Company’s Credit Agreement as
amended, was 3.4x.
› Maturity: March 2023
› Interest rate: 3.235%
Term Loan
Target
› $500M non-revolving 5-year Gross recourse debt to adjusted EBITDA from E&C
ratio in the range of 1.0x to 1.5x
Limited Recourse
› CDPQ loan of $400M
342019 Segment EBITDA
SNCL Engineering Services Segment
Q1 2019 Q2 2019 Q3 2019 YTD 2019 EBITDA %
(in thousands of $)
EDPM
(Engineering, Design and Project Management)
Revenues 982,955 972,092 969,844 2,924,891
Segment EBITDA 108,256 108,697 131,578 348,531 11.9%
Nuclear
Revenues 223,694 241,866 213,416 678,976
Segment EBITDA 13,367 35,915 43,044 92,326 13.6%
Infrastructure Services
Revenues 235,362 285,794 318,677 839,833
Segment EBITDA 11,783 11,817 40,639 64,239 7.6%
Capital
Revenues 72,177 74,746 79,604 226,527
Segment EBITDA 65,446 69,261 77,195 211,902 93.5%
SNCL Engineering Services - Total
Revenues 1,514,188 1,574,498 1,581,541 4,670,227
Segment EBITDA 198,852 225,690 292,456 716,998 15.4%
352019 Segment EBITDA
SNCL Projects Segment
Q1 2019 Q2 2019 Q3 2019 YTD 2019 EBITDA %
(in thousands of $)
Resources
Revenues 585,232 479,154 561,971 1,626,357
Segment EBITDA (49,027) (170,002) (37,960) (256,989) (15.8%)
Infrastructure EPC Projects
Revenues 263,773 230,525 288,651 782,949
Segment EBITDA (1,342) (119,968) 7,386 (113,924) (14.6%)
SNCL Projects - Total
Revenues 849,005 709,679 850,622 2,409,306
Segment EBITDA (50,369) (289,970) (30,574) (370,913) (15.4%)
362018 preliminary revised figures1
On a comparable basis with our new 2019 reorganized structure2
SNCL Engineering Services Segment
Q1 2018 Q2 2018 Q3 2018 Q4 2018 Total EBIT % Q1 2019
(in thousands of $)
EDPM
(Engineering, Design and Project Management)
Revenues 879,010 913,604 912,998 970,785 3,676,397 982,955
Segment EBIT 73,500 98,708 83,812 98,725 354,745 9.6% 80,229
Nuclear
Revenues 230,027 233,351 217,512 251,726 932,616 223,694
Segment EBIT 30,696 39,120 35,524 38,518 143,858 15.4% 10,792
Infrastructure Services
Revenues 201,527 208,605 222,172 280,400 912,704 235,362
Segment EBIT 7,679 15,599 10,326 19,251 52,854 5.8% 9,759
Capital
Revenues 64,197 57,199 66,171 77,090 264,657 72,177
Segment EBIT 56,420 50,824 55,125 62,606 224,975 85.0% 65,399
SNCL Engineering Services - Total
Revenues 1,374,761 1,412,759 1,418,855 1,580,001 5,786,374 1,514,188
Segment EBIT 168,295 204,251 184,788 219,099 776,432 13.4% 166,180
1 Unaudited
2 Announced by the Company on July 22, 2019
372018 preliminary revised figures1
On a comparable basis with our new 2019 reorganized structure2
SNCL Projects Segment
Q1 2018 Q2 2018 Q3 2018 Q4 2018 Total EBIT % Q1 2019
(in thousands of $)
Resources
Revenues 757,099 794,648 844,141 605,476 3,001,364 585,232
Segment EBIT 52,348 15,797 49,564 (374,304) (256,595) (8.5%) (61,398)
Infrastructure EPC Projects
Revenues 299,534 319,712 299,996 377,025 1,296,268 263,773
Segment EBIT 8,131 (4,467) 5,931 9,703 19,298 1.5% (6,088)
SNCL Projects - Total
Revenues 1,056,633 1,114,360 1,144,136 982,502 4,297,632 849,005
Segment EBIT 60,479 11,330 55,495 (364,601) (237,297) (5.5%) (67,486)
1 Unaudited
2 Announced by the Company on July 22, 2019
38SNC-Lavalin
Denis Jasmin Tel.: 514-393-8000 Ext. 57553
Vice-President, Investor Relations E-mail: denis.jasmin@snclavalin.com
www.snclavalin.com
Firm Analyst Rec. Tel Market Details
AltaCorp Capital Chris Murray Buy 647-776-8246
BMO Capital Markets Devin Dodge Hold 416-359-6774 Price as of November 25, 2019 $23.72
Canaccord|Genuity Yuri Lynk Buy 514-844-3708
Shares outstanding – Diluted 175.6M
CIBC World Markets Jacob Bout Buy 416-956-6766
Desjardins Securities Benoit Poirier Buy 514-281-8653
Market capitalization $4.2B
Laurentian Bank Securities Mona Nazir Buy 647-252-5609
National Bank Financial Maxim Sytchev Buy 416-869-6517 52 - week high / low $50.50 / $15.47
Raymond James Frederic Bastien Hold 604-659-8232
RBC Capital Markets Derek Spronck Buy 416-842-7833 Dividend per share $0.02 / quarter
Scotia Capital Mark Neville Buy 514-350-7756
TD Newcrest Michael Tupholme Buy 416-307-9389 Dividend yield ~ 0.3%
39You can also read