Evolution 2020 Moving Forward in Energy and Specialty Chemicals - www.superiorplus.com - Superior Plus
←
→
Page content transcription
If your browser does not render page correctly, please read the page content below

Evolution 2020
Moving Forward in Energy and
Specialty Chemicals

                www.superiorplus.com
                             TSX:SPB
Forward-Looking Statements and Information

    This presentation is for information purposes only and is not intended to, and should not be construed to constitute, an offer to sell or the solicitation of an offer to buy, securities of Superior Plus Corp.
    (“Superior"). This presentation and its contents should not be construed, under any circumstances, as investment, tax or legal advice. Any person accepting delivery of this presentation acknowledges
    the need to conduct their own thorough investigation into Superior and its activities before considering any investment in its securities.

    Certain information included herein and certain oral statements made by management are forward-looking information within the meaning of applicable Canadian securities laws. Forward-looking
    information may include statements regarding the objectives, business strategies to achieve those objectives, expected financial results (including those in the area of risk management), economic or
    market conditions, and the outlook of or involving Superior Plus Corp., Superior Plus LP (‘Superior LP”) and its businesses. Such information is typically identified by words such as “anticipate”, “believe”,
    “continue”, “could”, “estimate”, “expect”, “plan”, “intend”, “forecast”, “future”, “guidance”, “may”, “predict”, “project”, “should”, “strategy”, “target”, “will” or similar expressions suggesting future
    outcomes.

          1 Energy                                                               2 Specialty                                                                3 Construction
    Forward-looking information is provided for the purpose of providing information about management’s expectations and plans about the future and may not be appropriate for other purposes.
    Forward-looking information herein is based on various assumptions and expectations that Superior believes are reasonable in the circumstances. No assurance can be given that these assumptions and

          ) Services                                                             ) Chemicals                                                                ) Products
    expectations will prove to be correct. Those assumptions and expectations are based on information currently available to Superior, including information obtained from third party industry analysts and
    other third party sources, and the historic performance of Superior’s businesses. Such assumptions include anticipated financial performance, current business and economic trends, the amount of
    future dividends paid by Superior, business prospects, availability and utilization of tax basis, regulatory developments, currency, exchange and interest rates, trading data, cost estimates, our ability to
                                                                                                                                                              Distribution
    obtain financing on acceptable terms, the assumptions set forth under the “Financial Outlook” sections of our 2016 first quarter Management Discussion & Analysis (“Q1 MD&A”) and are subject to the
    risks and uncertainties set forth below.

    By its very nature, forward-looking information involves numerous assumptions, risks and uncertainties, both general and specific. Should one or more of these risks and uncertainties materialize or
    should underlying assumptions prove incorrect, as many important factors are beyond our control, Superior's or Superior LP's actual performance and financial results may vary materially from those
    estimates and intentions contemplated, expressed or implied in the forward-looking information. These risks and uncertainties include incorrect assessments of value when making acquisitions,
    increases in debt service charges, the loss of key personnel, fluctuations in foreign currency and exchange rates, inadequate insurance coverage, liability for cash taxes, counterparty risk, compliance
    with environmental laws and regulations, reduced customer demand, operational risks involving our facilities, force majeure, labour relations matters, our ability to access external sources of debt and
    equity capital, and the risks identified in (i) our Q1 MD&A under the heading "Risk Factors" and (ii) Superior's most recent Annual Information Form. The preceding list of assumptions, risks and
    uncertainties is not exhaustive.

    When relying on our forward-looking information to make decisions with respect to Superior, investors and others should carefully consider the preceding factors, other uncertainties and potential
    events. Any forward-looking information is provided as of the date of this document and, except as required by law, neither Superior nor Superior LP undertakes to update or revise such information to
    reflect new information, subsequent or otherwise. For the reasons set forth above, investors should not place undue reliance on forward-looking information.

    Readers should be cautioned that the information contained in the financial outlooks contained herein may not be appropriate for other purposes. In this presentation, we refer to certain financial
    measures such as EBITDA, EBITDA from operations, enterprise value and Adjusted Operating Cash Flow that are not determined in accordance with International Financial Reporting Standards
    ("Canadian GAAP"). For more information about these non-GAAP, additional GAAP and other measures, see the Appendix to this presentation. All financial information is expressed in Canadian dollars
    unless otherwise specified.

1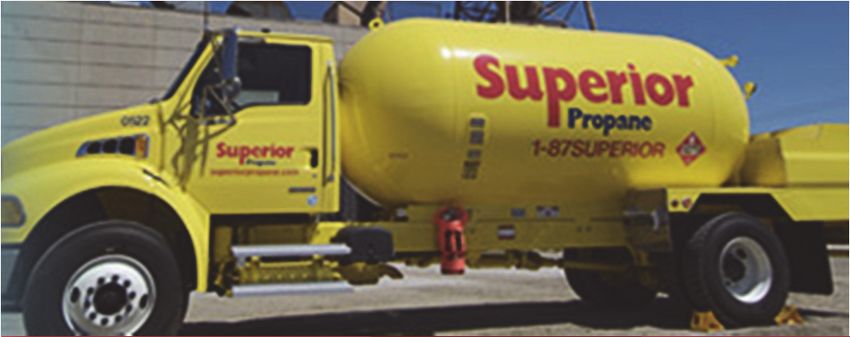
Superior Plus at a Glance
Shares outstanding 142.2 million
TSX share price (1) $11.13
Performance Versus S&P/TSX to June 30, 2016 (5)
Market capitalization (1) $1.6 billion
190.0%
Enterprise value (1) $2.4 billion
Percentage Return
140.0%
Monthly dividend per share $0.06
90.0%
Dividend yield (1) 6.5%
40.0%
Payout Ratio (2) 55%
-10.0%
30-Dec-11
31-Oct-12
31-Oct-14
31-Oct-15
29-Feb-12
30-Apr-12
31-Dec-12
31-Oct-13
28-Feb-13
30-Apr-13
31-Dec-13
28-Feb-14
30-Apr-14
31-Dec-14
28-Feb-15
30-Apr-15
31-Dec-15
29-Feb-16
30-Apr-16
30-Jun-12
31-Aug-12
30-Jun-13
31-Aug-13
30-Jun-14
31-Aug-14
30-Jun-15
31-Aug-15
30-Jun-16
EBITDA from operations (2)(3) $335.2 million
Debt/EBITDA (2)(4) 3.4x SPB Common Stock S&P/TSX
(1) As at July 12, 2016
(2) See Non-GAAP Financial Measures.
(3) 2015 Annual Report
(4) As at March 31, 2016.
(5) Per Bloomberg, includes reinvested dividends
A track record of shareholder value creation
2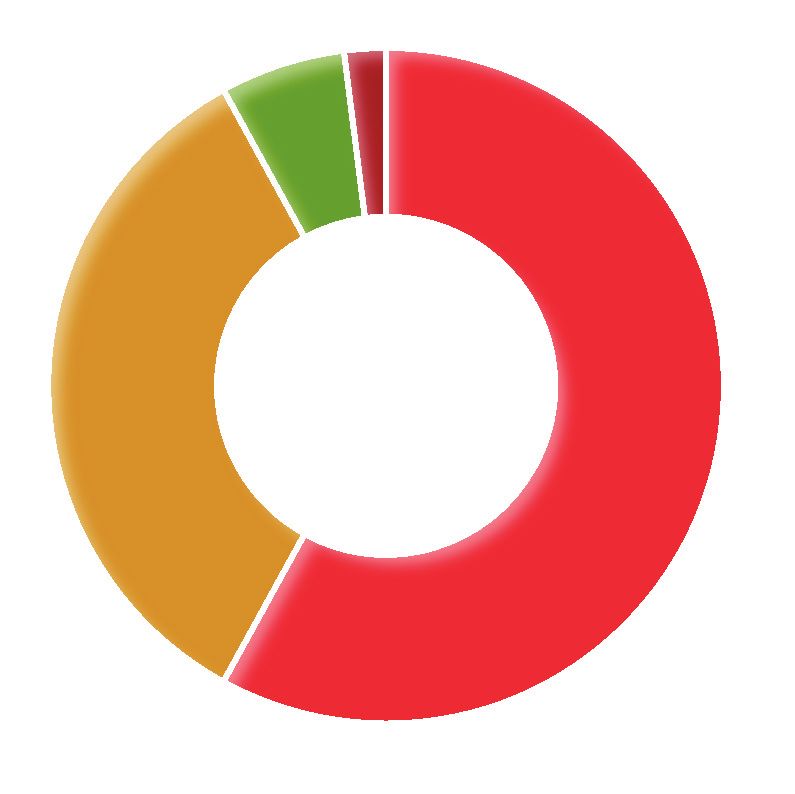
Recent Developments

    • October 6, 2015 announcement to acquire Canexus Corporation
      (“Canexus”)

    • October 28, 2015 closing of equity issuance for net proceeds of
      $138 million

    • June 30, 2016 announcement terminating the Arrangement Agreement
      with Canexus

    • July 5, 2016 announcement of the agreement to sell Construction Products
      Distribution business for approximately $420 million CAD
        • Anticipated to close in late Q3/early Q4

3
Our Businesses

             Energy Distribution                                                               Specialty Chemicals

             • Leading distributor and marketer of propane in Canada                           Production and sales of:
                                                                                               • Sodium Chlorate products in North America
             • Distribution of retail and wholesale propane and distillates in the
               Northeast U.S.                                                                  • Chlor-Alkali and related products in North America
             • Wholesale propane marketing                                                     • Sodium Chlorate in Chile, South America
                                                                                               • Exports represent 10-15% of production

                                                                                                      Energy Distribution and Chemicals have:
                                                                                                            >    Solid industry positions
                                            CANADA
                                            Revenue – 35% (1)                                               >    Attractive acquisition opportunities
                                                                                                            >    Sustainable free cash flow models
                                                                                                            >    Opportunities for geographic and
                                        USA & Other                                                              market expansion
                                        Revenue – 65% (1)

(1) Based   on 2015 Annual results excluding Construction Products Distribution. USA includes results from Chile, representing ~5% of gross revenue.

4
A Look Back at 2015

                 Significant achievement of Destination 2015 objectives
                       > Achievement of target capital structure

                       > Improved efficiency and cost structure in all businesses

                       > Re-location of head office to Toronto

                       > Implementation of ERP system in Construction Products Distribution
                          with new management team based in Dallas
                                                                                 EBITDA from Operations (1)
                                           $400

                                           $350

                                           $300

                                           $250
                                Millions

                                           $200
                                                                                                                            $325.9    $335.2
                                           $150                                                           $280.6
                                                                               $279.1
                                                     $253.9
                                           $100

                                           $50

                                            $0
                                                      2011                      2012                       2013             2014       2015
(1)   Per 2015 Annual Report and excludes the impact of realized gains or (losses) on foreign currency hedging contracts.

  5
Financial Highlights
Reduced Leverage: Reduced Interest Burden:
Total Debt/EBITDA (1) Interest Expense (1)
7.0 $90.00 31% 35%
$80.00 28%
6.0 26% 30%
$70.00
5.0 21% 25%
$60.00
Millions
4.0 $50.00 20%
15% 14%
$40.00 $79.2 15%
3.0 6.0x $68.9 $71.7
5.1x $30.00 $58.7
2.0 4.3x 3.9x $48.0 $47.1 10%
3.5x 3.2x $20.00
1.0 $10.00 5%
0.0 $0.00 0%
2010 2011 2012 2013 2014 2015 2010 2011 2012 2013 2014 2015
Total debt/EBITDA Interest Expense As % of EBITDA from operations
Dividend reduced
twice from $1.62
to $0.60 cents per Conservative Dividend Policy:
share Annual dividend raised
from 60 cents per share
Dividends paid as a % of AOCF (1)(2): to 72 cents per share
$160.00 120%
$140.00 96%
100%
$120.00 76%
80%
Millions
$100.00
$156.8 $136.7 45% 60%
$80.00 35% 38%
34%
40%
$60.00 $92.8
$67.1 $73.7 $77.0
$40.00 20%
$20.00 0%
2010 2011 2012 2013 2014 2015
(1) Per Annual Reports. (2) See Non-GAAP Financial Measures.
Dividends Paid % of AOCF after non-recurring items
Sustainable dividend well supported by free cash flow
6Our Vision – Evolution 2020
“We will focus on improving our operations and building our future.”
Internal Growth:
> Effective sales and marketing to target 2% growth above the industry
> Differentiate our products through industry-leading customer service
> Leverage our superior logistics and technology to build strong partnerships
> De-commoditize our goods and services through differentiation and digitalization
Cost Control:
> A culture of continuous improvement
> Maintain a sustainable and competitive cost profile
Acquisitions:
> Strategic and accretive with disciplined approach
> Expanding and diversifying our customer base
> Implementing best-in-class integration
Talent Management:
> The right people directed to organizational competencies
> Compensation aligned to performance
Well-positioned for growth above the industry
7Superior Plus – Corporate Office
Superior Plus head office team serves to further enhance value driven initiatives
Superior Plus Corporate Team
Luc Desjardins, President & Chief Executive Officer
Continuous over-riding focus:
Beth Summers, VP & Chief Financial Officer > Culture
Leadership Darren Hribar, Chief Legal Officer > Values
John Engelen, VP Mergers and Acquisitions
> Leadership
Julien Houle, VP Human Resources
Head Office Toronto, Ontario
Focus drives value creation
2015 Consolidated
EBITDA from $335.2 million
Operations Services provided by Plus office:
> Talent Management
Employees • ~4,500 employees in Canada, US and Chile
> M&A opportunities
> Marketing, Sales & IT initiatives
Value creation not reached without
the best people
(1) Per 2015 Annual Report and 2015 AIF.
Corporate office now located closer to divisions and
8 capital marketsSuperior Plus Operations – Energy Distribution
Superior Plus Energy Distribution Energy Distribution - 2015 Gross
Profit by Segment (1)
Greg McCamus, President
2%
Shawn B. Vammen, Senior Vice President,
Leadership Superior Gas Liquids 6%
Keith Wrisley, President, U.S. Refined Fuels
Mississauga, Ontario
Head Offices Calgary, Alberta
Rochester, New York
• Distribution and retail marketing of propane-related
58%
products and services 34%
Products and
• Distribution of liquid fuels including heating oil
Services
and propane gas
• Wholesale marketing services of natural gas liquids
End Markets Across Canada and Northeastern United States
Canadian propane distribution
2015
EBITDA from $169.9 million U.S. refined fuels distribution
Operations Other services
Fixed price energy
• 1,379 in Canada
Employees
• 1,056 in United States
(1) Per 2015 Annual Report and 2015 AIF.
Continuing improvement in our day-to-day operations
9Energy Distribution – Investing in
a Sustainable Cost Structure
Energy Distribution EBITDA and Gross Profit (1)(2)
$600
$503 $505
$500
$446
$416 $414
$400
In $'000s
$300
$200 $170 $166
$116 $128
$104
$100
$0
2011 2012 2013 2014 2015
EBITDA from operations Gross profit
A continuing emphasis on operational efficiency produces:
> Year-over-year growth in EBITDA from operations
> Consistent gross profit in the face of declining volumes
> Potential for significantly higher cash flow at normal sales volumes
(1) Per Annual Reports and Management Information.
(2) EBITDA from operations, gross profit, and gross margins exclude the results from Fixed-price Energy Services.
10Energy Distribution – Investing in
a Sustainable Cost Structure
Marketing, Sales, IT and intelligent pricing strategies drive competitive advantage
Canadian Propane Distribution (1) U.S. Refined Fuels (1)
Propane volume in millions of litres sold
1,400 25 2,000 11.2 12.0
20.1 21.7 1,800
1,200 9.7 10.0
Profit margin in cents per litre
Profit margn in cents per litre
18.2 18.8 20 1,600
US refined fuels volume in
17.1 8.0
mIllions of lItres sold
1,000 1,400 7.9 7.7
8.0
15 1,200
800
1,000 6.0
1,305 1,292 1,331 1,316 1,741
600 1,176 10 800 1,599 1,633 1,581 1,563
600 4.0
400
5 400
2.0
200 200
0 0 0 0.0
2011 2012 2013 2014 2015 2011 2012 2013 2014 2015
US refined fuels sales volumes US refined fuels sales margin
Canadian propane distribution sales volumes
Canadian propane distribution sales margin
Investment in cost control mitigates
Consistent improvement in profit
reduction in demand from abnormally
margin per litre
warm weather
(1) Per 2015 Annual Report. Results from Canadian Propane Distribution do not include Supply Portfolio Management.
Our investments are producing significant results
11Energy Distribution – Looking Ahead to 2016
Input EBITDA
Factor Impact Discussion 600
Down 16% Down 15%
500
Q1 2016 Canada 13% warmer than Q1 2015
Q1 2016 in US markets 26% warmer than 400
Warmer
Q1 2015
than 300
Reduced demand for heating impacts sales
Average 512 494
volumes 200 429 422
Temperature
Residential heating demand is 70% of US
refined fuels gross profit 100
Lower 0
Reduced demand from decline in oilfield Canadian volumes in million litres US volumes in million litres
Energy
activity
Prices Q1 2015 Q1 2016
Lower
25
Energy Reduced wholesale cost of propane up 19%
Prices
20
up 1%
Reduced Canadian propane and U.S. Refined Fuels
Cents per litre
Operating should benefit from ongoing 15
Costs continuous improvement initiatives 23.1
10 19.5
16.0 16.1
Sales and Volume growth from sales and marketing
5
Marketing initiatives as well as tuck-in acquisitions
0
Canadian gross profit per litre US gross profit per litre
Q1 2015 Q1 2016
(1) Per 2016 First Quarter Report.
Growing margins in the face of dramatic
12 industry headwindsSuperior Plus Operations –
Specialty Chemicals
Specialty Chemical Revenue by
Customer Type (1)
Superior Plus Specialty Chemicals
18%
Ed Bechberger, President
Rich McLellan, VP Finance 5%
Leadership
Thomas Barrett, VP Sales & Marketing
John Christie, VP Operations 5%
Head Offices Etobicoke, Ontario
65%
7%
• Production and sales of Sodium Chlorate
and related products
Products and
• Production and sales of Chlor-Alkali and
Services Pulp & Paper Oil & Gas Water Treatment Distribution Other
related products
• Production and sales of chlorine dioxide generators
Specialty Chemical EBITDA Margins (2)
59% United States, 24% Canada, $140.00 22.0% 25.00%
End Markets
EBITDA from operations in $millions
17% International in 2015 19.3%
$120.00 18.9% 18.4%
17.4% 20.00%
$100.00
Facilities Eight across North America and one in Chile
EBITDA margin
$80.00 15.00%
2015 $60.00 $123.6
$119.5 $112.2 $117.4 10.00%
EBITDA from $117.4 million $100.0
Operations $40.00
5.00%
$20.00
Employees 556 full-time employees
$0.00 0.00%
(1) 2014 data
2011 2012 2013 2014 2015
from 2015 Investor Day presentation.
(2) Per Annual Reports.
13Specialty Chemicals – Looking Ahead to 2016
Input EBITDA Revenue per 000 MT (1)(2)
Factor Impact Discussion $1,000
down 7%
$800
Lower
Reduced demand and pricing for
Commodity $600
hydrochloric acid from oilfield activity
Prices
$400 $823 $766
End of $200
Tronox Lower sales volumes of sodium chlorate
Agreement $0
Revenue per 000 MT
End of Q1 2015 Q1 2016
Reduced plant expenses and fees related to
Tronox
Tronox
Agreement Cash Operating Cost per 000 MT (1)(2)
Higher US$ Benefit from U.S. operations and sales, $250.00 down 9%
versus C$ offset by impact of hedges
$200.00
Lower $150.00
Bleached
Lower demand for sodium chlorate
Pulp $100.00 $193 $175
Production
$50.00
$0.00
(1) MT
Cash cost per 000 MT
– Metric tonne
(2) Data taken from 2016 First Quarter Report.
Q1 2015 Q1 2016
14Construction Products Distribution
> Sale of division announced July 5, 2016 to Foundation Building Materials
> Why now?
• Attractive valuation: high multiple and weaker CAD beneficial to Superior
• U.S. construction in early stages of recovery, driving higher transaction multiple
> Rational for divestiture:
• Simplifies business model – CPD was the most cyclical of Superior’s businesses
• Significant deleveraging
• Capital to grow Energy Distribution and Specialty Chemicals
Divestiture timing:
• Q3 2016 – satisfaction of conditions and financing by purchaser
• Q4 2016 – conclusion of process
15Superior Plus: Goals for 2016
Goals for 2016
> Execution on key themes of Evolution 2020
• Internal growth
Superior Plus • Continuous improvement programs
• Talent management
• Sustainable capital structure and cash flow profile
> Continuous focus on cost improvement
> Growth of wholesale business
Energy Distribution > Investment in sales and marketing in support of growth
> Strategic tuck-in acquisitions
> Focus on plant optimization and logistics
> Developing advanced sales and marketing approach
Specialty Chemicals > Maintaining excellent customer partner relationships
> Continue to develop export market
Construction Products > Completion of ERP system conversion project
Distribution > Completion of sales process
16Why Invest in Superior Plus
Industry Leadership:
> Experienced management team with best in class operations
> Continued efforts to create value through differentiation and digitalization
> Economies of scale creates procurement and logistics advantages
Proven Business Model:
> Focus on customer service excellence in all our businesses
> A culture of continuous improvement and differentiation
> Culture, Values, People
Strong Financial Profile:
> Achieving target leverage ratio
> Capital and liquidity to fund future growth
> Strong free cash flow generation
> Attractive and supported dividend yield
Compelling Growth Prospects:
> Numerous unique organic growth opportunities currently under evaluation
> Disciplined and focused capital allocation strategy underpins M&A process
Building on our success
17Questions
www.superiorplus.com
TSX:SPBNon-GAAP Financial Measures
Throughout the presentation, Superior has used the following terms that are not defined by GAAP, but are used by management to evaluate the performance of Superior and its businesses. Since non-
GAAP financial measures do not have standardized meaning prescribed by GAAP and are therefore unlikely to be comparable to similar measures presented by other companies, securities regulations
require that non-GAAP financial measures are clearly defined, qualified and reconciled to their nearest GAAP financial measures. Except as otherwise indicated, these Non-GAAP financial measures are
calculated and disclosed on a consistent basis from period to period. Specific adjusting items may only be relevant in certain periods. The intent of non-GAAP financial measures is to provide additional
useful information to investors and analysts and the measures do not have any standardized meaning under IFRS. The measures should not, therefore, be considered in isolation or used in substitute for
measures of performance prepared in accordance with IFRS. Other issuers may calculate non-GAAP financial measures differently.
Investors should be cautioned that EBITDA, EBITDA from operations and AOCF should not be construed as alternatives to net earnings, cash flow from operating activities or other measures of financial
results determined in accordance with GAAP as an indicator of Superior’s performance.
1 Energy
Non-GAAP financial measures are identified and defined as follows:
Adjusted Operating Cash Flow
2 Specialty 3 Construction
) Services ) Chemicals ) Products
AOCF is equal to cash flow from operating activities as defined by IFRS, adjusted for changes in non-cash working capital, other expenses, non-cash interest expense, current income taxes and finance
costs. Superior may deduct or include additional items in its calculation of AOCF; these items would generally, but not necessarily, be items of a non-recurring nature. AOCF is the main performance
Distribution
measure used by management and investors to evaluate Superior’s performance. AOCF represents cash flow generated by Superior that is available for, but not necessarily limited to, changes in working
capital requirements, investing activities and financing activities of Superior.
EBITDA
EBITDA represents earnings before taxes, depreciation, amortization, finance expense, and certain other non-cash expenses, and is used by Superior to assess its consolidated results and those of its
operating segments. The EBITDA of Superior’s operating segments may be referred to as EBITDA from operations.
EBITDA from operations
EBITDA from operations is defined as EBITDA excluding gains/(losses) on foreign currency hedging contracts. For purposes of this presentation, foreign currency hedging contract gains and losses are
excluded from the results of the operating segments.
Payout ratio
Payout ratio represents dividends as a percentage of AOCF less other capital expenditures, CRA payments and capital lease repayments and is used by Superior to assess its financial results and leverage.
Payout ratio is not a defined performance under GAAP. Superior’s calculation of payout ratio may differ from similar calculations provided by comparable entities. Forecasted payout ratio for 2016 as per
slide 2 on this presentation is based on midpoint of Adjusted Operating Cash Flow guidance. See Q1 Report for further detail.
Dividends paid as a percentage (%) of AOCF after non-recurring items
Represents dividends paid as a percentage of AOCF after non-recurring items. Dividends paid as a percentage of AOCF after non-recurring items is not a defined performance under GAAP.
For additional information with respect to financial measures which have not been identified by GAAP, including reconciliations to the closest comparable GAAP measure, see Superior's Q1 2016 MD&A,
available on SEDAR at www.sedar.com
19You can also read