JPM European High Yield & Leveraged Finance Conference - 10th September 2020 - RIVER HOMES - MADRID DELIVERED Q4 2019 - Neinor Homes
←
→
Page content transcription
If your browser does not render page correctly, please read the page content below
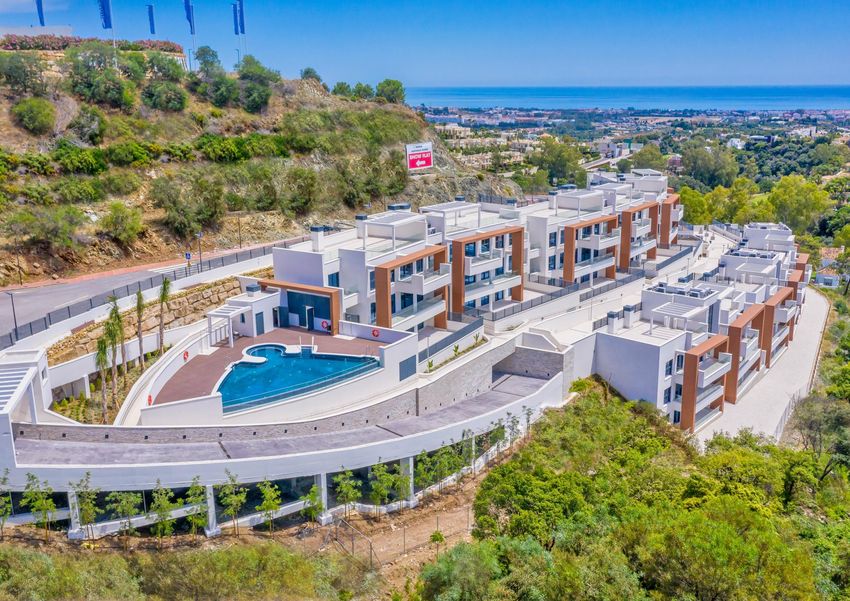
RIVER HOMES – MADRID
                               DELIVERED Q4 2019

  JPM European High Yield &
Leveraged Finance Conference

       10th September 2020
DISCLAIMER
This Presentation has been prepared by Neinor Homes, S.A. (“Neinor”) for information purposes only and it is not regulated information or information which has been subject to prior registration or control by the Spanish Securities Market Commission. “Presentation”
means this document, its contents or any part of it, as well as any oral presentation, any question or answer session and any written or oral material discussed or distributed during meetings carried out in connection with this document This Presentation may not be
reproduced in any form, used or further distributed to any other person or published, in whole or in part, for any purpose without the express and prior written consent of Neinor. Failure to comply with this obligation may constitute a violation of applicable securities
laws and/or may result in civil, administrative or criminal penalties.
Neither Neinor nor any of its employees, officers, directors, advisers, representatives, agents or affiliates shall have any liability whatsoever (in negligence or otherwise, whether direct or indirect, in contract, tort or otherwise) for any loss howsoever arising from any use
of this Presentation or its contents or otherwise arising in connection with this Presentation.
Neither this Presentation nor any part of it constitutes a contract, nor may it be used for incorporation into or construction of any contract or agreement.
This Presentation may include forward-looking statements about revenue and earnings of Neinor and about matters such as its industry, business strategy, goals and expectations concerning its market position, future operations, margins, profitability, capital
expenditures, capital resources and other financial and operating information. The words “believe”, “expect”, “anticipate”, “intends”, “estimate”, “forecast”, “project”, “will”, “may”, “should” and similar expressions may identify forward-looking statements. Other
forward looking statements can be identified from the context in which they are made. These forward-looking statements are based on numerous assumptions regarding the present and future business strategies of Neinor and the environment in which Neinor expects
to operate in the future. These forward-looking statements involve known and unknown risks, uncertainties and other factors, which may cause the actual results, performance or achievements of Neinor, or industry results, to be materially different from those
expressed or implied by these forward-looking statements. Forward-looking statements should not be taken as forecasts or promises and they should not be taken as implying any indication, assurance or guarantee that the assumptions on which such forward-looking
statements have been prepared are correct or exhaustive or, in the case of the assumptions, fully stated in the Presentation. As a result, you should not place undue reliance on these forward-looking statements as a prediction of actual results or otherwise.
The information in this Presentation, which does not purport to be comprehensive, has not been independently verified and will not be updated. The information in this Presentation, including but not limited to forward-looking statements, applies only as of the date of
this Presentation and is not intended to give any assurances as to future results. Neinor expressly disclaims any obligation or undertaking to disseminate any updates or revisions to the information, including any financial data and any forward-looking statements
contained in this Presentation, and will not publicly release any revisions that may affect the information contained in this Presentation and that may result from any change in its expectations, or any change in events, conditions or circumstances on which these
forward-looking statements are based or any change in whichever other events or circumstances arising on or after the date of this Presentation.
Market data and competitive position used in this Presentation not attributed to a specific source are estimates of Neinor and have not been independently verified. In addition this Presentation may contain certain information in relation to other companies operating in
the same sector and industry. This information has been derived from publicly-available sources and Neinor accepts no responsibility whatsoever and makes no representation or warranty expressed or implied for the fairness, accuracy, completeness or verification of
such information.
Certain financial and statistical information contained in this Presentation is subject to rounding adjustments. Accordingly, any discrepancies between the totals and the sums of the amounts listed are due to rounding. Certain management financial and operating
measures included in this Presentation have not been subject to a financial audit or have been independently verified by a third party. In addition, certain figures contained in this Presentation, which have also not been subject to financial audit, may be combined and
pro forma figures.
The financial information contained herein may include items which are not defined under the International Financial Reporting Standards as adopted by the European Union (IFRS-EU) and which are considered to be “alternative performance measures”. Other
companies may calculate such financial information differently or may use such measures for different purposes, limiting the usefulness of such measures as comparative measures. Such financial information must be considered only in addition to, and not as a
substitute for or superior to, financial information prepared in accordance with IFRS-EU.
IMPORTANT INFORMATION: This Presentation does not constitute or form part of any purchase, sales or exchange offer, nor is it an invitation to draw up a purchase, sales or exchange offer, or advice on any stock issued by Neinor. In particular, this Presentation and the
information contained herein do not form part of or constitute (i) an offer to acquire or subscribe shares, in accordance with the Spanish Securities Market Act and its implementing regulation or (ii) an offer to purchase, sell or exchange securities, a solicitation of any
offer to purchase, sell or exchange securities or a solicitation of any kind of voting rights in the United States or any other jurisdiction.
The securities of Neinor have not been and will not be registered under the U.S. Securities Act of 1933, as amended (the “US Securities Act") or the laws of any state or other jurisdictions of the United States. Such securities may not be offered or sold in the United States
except on a limited basis, if at all, to Qualified Institutional Buyers (as defined in Rule 144A under the US Securities Act, as amended) in reliance on an exemption from, or transaction not subject to, the registration requirements of the US Securities Act. The securities of
Neinor have not been and will not be registered under the applicable securities laws of any state or jurisdiction of Australia, Canada, Japan or Switzerland and, subject to certain exceptions, may not be offered or sold within Australia, Canada, Japan or Switzerland or to
or for the benefit of any national, resident or citizen of Australia, Canada, Japan or Switzerland.
The information contained in this Presentation does not constitute investment, legal, accounting, regulatory, taxation or other advice and the information does not take into account your investment objectives or legal, accounting, regulatory, taxation or financial
situation or particular needs. You are solely responsible for forming your own opinion and conclusions on such matters and the market and for making your own independent assessment of the information included in this Presentation. You are solely responsible for
seeking independent professional advice in relation to the information contained herein and any action taken on the basis of the information contained herein. No responsibility or liability is accepted by any person for any of the information or for any action taken by
you or any of your officers, employees, agents or associates on the basis of the information included in this Presentation.

                                                                                                                                                                                                                                                                                         2
LEADING THE HOMEBUILDING SECTOR SINCE 2015

                                  2016                                            2018                                             2020
  LONE STAR ACQUIRES          MAJOR LAND
        NEINOR                ACQUISITIONS                                 A PROFITABLE COMPANY                               EXECUTION INSPITE COVID
                                                                                                      +1,3K UNITS DELIVERED
                                                      IPO MARCH 2017        +1K UNITS DELIVERED                                +100M EBITDA TARGET
                          INDUSTRIALISED PROCESS                                                          EBITDA €100M+
BASQUE DEVELOPER WITH                                                           56MN EBITDA                                   LAUNCH NEINOR RENTAL
                           REGIONAL PRESENCE:      EXPANSION INTO MALAGA
                                                       AND VALENCIA        FIRST STRATEGIC LAND       NEW BUSINESS PLAN,         WITH 1.2K UNITS
30 YEARS OF HISTORY AND      MADRID, BILBAO,
                                                                               ACQUISITIONS          MANAGEMENT RESHUFFLE          TARGET 5k
                             BARCELONA AND
A 4,000-UNIT LAND BANK          CORDOBA

         2015                                              2017                                               2019

                                PRIVATE COMPANY                                                   PUBLIC COMPANY

                                                                                                                                                 3
NEINOR HOMES: OUR NATIONAL FOOTPRINT
    Neinor’s Land Bank is concentrated in the Top7 provinces by housing demand in Spain
 Region (City where regional office is)
 % over GAV value of Land Bank Assets
     Neinor Regional Office

                                                                                 10,500+ units land bank
    North
   (Bilbao)                                                        East
c.2,200 units
     21%
                                                                (Barcelona)          c. 6,000 units
                                                                 c.1,300 units
                                                                    12%            under commercialization

     Center                                                                          c. 5,000 units
    (Madrid)
   2,000 units                                                                     under construction & FP
      19%

                                                                                       3,000 units
   S. West                                                     Levante           Pre-sold (€980m+ order book)
 (Córdoba)                                                   (Valencia)
 1,400 units                                                c.1,100 units
     13%                                                         11%                   1,269 units
                                                S. East                               Deliveries in 2019
                                               (Málaga)
                                              2,500 units
                                                 24%

                                                                                                                4
NEINOR HOMES: RESIDENTIAL DEVELOPMENT
      Robust capabilities reflected in key metrics, demonstrating the industrial power
      embedded in the company.

                             • 98% multi-family / 95% first residence
          Product            • Typical unit: 3 bed-room, 114 sqm, ASP: EUR 350k
                             • Three qualities: Alpha (€1,500/sqm cons. cost), Beta (€1,400/sqm) and Gamma (€1,100/sqm)

                             • Best in class and Innovative “go to market” model – 20 Neinor Stores in Spain
          Sales              • 80% of leads generated online
                             • Strong inhouse capabilities, with a very scalable model
                             •   C. 5,000+ WIP units / c. €850m CapEx committed
                             •   8,000+ licenses obtained / 600+ submitted awaiting license
          Construction
                             •   Working with 35+ construction companies.
                             •   6 regional offices with developer DNA, 273 employees.

      BP de-risked until 2022 with targets unchanged in spite Covid19.

           ACTUAL                                           RAMP-UP                                RUN-RATE
                                                                    Revenues        EBITDA

                                                                                                  900                             950

P&L                                      500
                                                                      600                                             ~40% CAGR
           382

                                                                                                               150+                        175
                        56
                        52                            70+                          100+

                 2018                          2019                         2020                        2021                        Run-Rate

                                                                                                                                                 5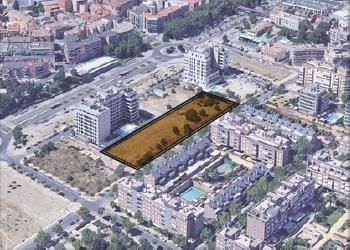
2020-22 VISIBILITY

                                       STATUS                             WIP STATUS1                      REVENUE VISIBILITY

                                      15% DELIVERED
                                                                                                                                                • c.600 units delivered or in delivery process
                                                                                           LPO(3)
                                                                                     20%                 CURRENT PRE-SALES                           • 254 units delivered by Jun. 30th
         2020                                                   FAÇADE
                                                                           57%
                                                                WORKS                 24% CFO(2)                     83%                             • c.350 units in delivery process
                                                                                                                                                • Awaiting LPO3 for 400 units

                                        100% WIP
                                       100% LICENSES
                                                                     FOUNDATION
                                                                       WORKS
                                                                                                           CURRENT PRE-SALES
                                                                             11%                                 50%
                                                                                                                                                • 55% of units started façade works
         2021                                                                        55% FWAÇADE
                                                               STRUCTURE
                                                                WORKS
                                                                           34%              ORKS          EXPECTED PRESALES BY                  • 50% of units already pre-sold
                                                                                                               YEAR-END
                                                                                                                 ~65%

                            PENDING                                                                        CURRENT PRE-SALES
                            LICENSES
                                        26%            WIP                                                       30%                            • c.1,900 units with license
                                                                                            FOUNDATION
                                                46%                                  53%
         2022                                                 STRUCTURE
                                                               WORKS
                                                                           47%                WORKS
                                                                                                            EXPECTED PRESALES
                                                                                                                                                • c. 50% units WIP
                                        28%
                           LICENSES
                                                                                                               BY YEAR-END                      • Pre-sales on track to end of year target
                                                                                                                  ~40%

1Status as of end of June 2CFO stands for Certificado Final de Obra, last milestone before requesting the first occupancy license (LPO, see next footnote). 3 LPO stands for Licencia de Primera Ocupación, the municipal
certificate that allows developers to notarize and deliver the units to the buyers.                                                                                                                                         6
H1 2020 EXECUTIVE SUMMARY
     Profitability despite the COVID outbreak:
     €100m+ revenues / 28% gross development margin / €15m EBITDA
     Guidance reiterated: +€100m EBITDA

     Sales and Construction Progress:
     Pre-sales of 686 units in 1H20 (332 in Q2).
     Order book +3k units and +€1bn revenues. No spike in cancelations.
     Estimated delays in construction works of 1-month due to Covid.

     Rental Platform: 300 units in Construction + 300 to start works in
     the upcoming months. €100M financing secured.

     Capex and corporate financing:
     100% developer financing committed for 2020, 2021 and most 2022
     developments - c. €280m signed YTD (c. €250m since April1)
     New €40m corporate line to strengthen cash position
                                                                          7
LEADING THE HOMEBUILDING SECTOR SINCE 2015
Despite a strong macro deceleration housing demand has proven more resilient than expected.
Until 2019 new housing transactions stood at 50k vs L15Y average of 162k (less 70%)…
Before Covid19
old was better … while existing transactions made nearly a full recovery standing near c500k units (c10% below peak).
than new
New housing transactions represent 10% of total vs 30% historically.
Changes in housing preferences (53% give more value to exterior spaces, 13.6% want to move to a house
… but with exterior space, 16.2% value room size1) likely to invert transaction mix towards new houses.
preferences
might have Higher unemployment and lower consumer confidence should hit housing demand but mostly in the
changed lower segment of demand. (Neinor stands at +€300k/unit).
Financing constraints by banks should drag supply in the short to medium term favouring market
consolidation.
Total Housing Transactions
1.000
(new vs existing)
800
(Thousands)
600
400
200
0
2004 2005 2006 2007 2008 2009 2010 2011 2012 2013 2014 2015 2016 2017 2018 2019
New Existing
Source: Fomento 8
1 IKEA July 2020 survey, “Perception of our homes after confinement”FINANCING AND DEBT POSITION
Capex and corporate financing: 1H20 Leverage Position
€M H1 2020 FY 2019 Q2'20 vs FY'19
Corporate debt refinanced and to be Gross Debt
Non-Current Bank Borrowing
381.7
90.0
365.7
50.0
16.0
40.0
4.4%
80.0%
fully repaid by 23 (€90M). Corporate Financing 90.0 50.0 40.0 80.0%
Current Bank Borrowing 291.7 315.7 (24.0) -7.6%
Developer Loan 239.7 169.6 70.1 41.3%
Limited financing risk on constr. Capex Land 111.1 110.9 0.3 0.2%
for 20-22 deliveries. Capex
Land Financing
128.6
51.4
58.8
70.5
69.8
(19.2)
118.8%
-27.2%
Corporate Financing - 74.3 (74.3) -100.0%
Strong liquidity position with €130M VAT Financing 0.1 0.0 0.1 n.s.
Interests 0.6 1.2 (0.6) -50.9%
on the BS to tackle growth Current financial Assets - 12.8 (12.8) n.s
opportunities. Cash & Equivalents
Net Debt
132.9
248.8
173.4
179.5
(40.5)
69.3
-23.4%
38.6%
MAX LTV of 30-35% vs 1H20 at 19%. Net Debt 248.8 179.5 69.3 38.6%
Adjustments 76.0 81.1 (5.2) -6.4%
Dividend payment postponed for Deferred Land Payment 38.2 37.7 0.5 1.3%
prudency. Restricted Cash 37.8 43.5 (5.7) -13.0%
Net Debt Adjusted 324.8 260.7 64.1 24.6%
1 Including c. €130m signed in JulyNEINOR RENTAL: RATIONALE AND MID-TERM GOAL
Flexible Add-on:
Launching fully-financed
No equity requirement
Seed portfolio of c. +€250mn NAV in platform valuation
Attractive Economics:
Selected locations with solid rental market economics
Initial projects with high profitability
Developed at 6-7% gross yield on cost vs market yield 3-4%
+€100mn NAV accretive (8% uplift potential)
Medium Term Goal:
Ring Fence the rental platform. Become a market leader
Target ~5,000 units, generating ~€40m FFO
Financing secured for 600 rental units – (€100M) + expected closing
of the funding needed for the further 600 units soon
Optionality: even if kept on balance, rental would generate 15% ROE
10AN EVEN STRONGER MACRO CASE FOR THE RENTAL SECTOR
(%) of Rented Primary Housing
48.6%
Supportive 30.2%
35.6% 35.0% 37.8% 33.9%
27.6%
Long Term 15.6%
22.9%
Macro Trends
2001 2019
2017
Attractive Average Household Size (# members) Supportive Demand of Average Tenant Age
New Residential units
demographics 29
52 Years
2.7 2.5 2.4 100-150K resi units Years
and
2.3 2.3 2.2 2.0
Germany
need per year Spain4
affordability 2006 2017 2031 2017 2017 2017 2017 Affordability Expected to Improve as Age of Tenant Base
Progressive conversion to European household size standards with plenty of room for growth Converges to EU Averages
Population Population GDP per Unemploy Investment ➢ TOP 6 PROVINCES IN SPAIN CONCENTRATE:
Province Top 20 - Number of inhabitants (millions) -21% -14% -7% to 0% to 7% to 14% to
increase (#) increase (%) capita ment rate interest to - to -7% 0% 7% 14% 21%
Madrid 85.315 +1,30% 34.041 10,3%
14% o C. 50% of total country population
6,66
o C. 90% of the Spain population
Barcelona 55.229 +0,98% 29.885 11,3%
Geographical
5,66 increase per year (+1%/year)
Valencia 2,57 17.138 +0,67% 22.882 14,6% o C. 50% of total GDP
Concentration Sevilla 1,94 2.502 +0,13% 19.665 21,4%
➢ THE EFFECT IS EXPONENTIAL, IN 10 YEARS:
Effect Alicante 1,86 19.864 +1,08% 19.066 13,6%
o Same regions will increase
Málaga 1,66 20.664 +1,26% 18.036 18,1% population by +7-21% (as reflected
Murcia 1,49 15.389 +1,04% 20.766 14,2% in the map)
o The rest of Spain will concentrate a
Cádiz 1,24 1.441 +0,12% 17.231 23,8%
loss of population of 0-21%
Vizcaya 1,15 3.023 +0,26% 30.901 10,9%
Source :INE
Balears, Illes 1,15 20.552 +1,82% 27.134 8,2%
Rental Prices y-o-y Quarter
11.231 Growth
+1,01%(%)1 20.221 22,9% 15.0€ Rent price evolution trend
Resilient rents
Palmas, Las 1,12
Coruña, A 1,12 245 +0,02% 23.343 10,5%
8,7%
capturing the SC. de Tenerife 1,03 14.473 7,8%
+1,42% 20.712 19,4% 12.0€
demand with Asturias 5,6%
1,02
5,1%
5,8%-5.444 -0,53% 21.981
5,1%
14,4%
9.0€
unaffordabilit
Zaragoza 0,96 9.882 +1,03% 27.011 10,3%
Pontevedra 0,94 893 +0,09% 21.612 13,2%
y to buy Granada 0,91 2.603 +0,29% 17.894 23,5%
6.0€
Tarragona 0,80 8.762 +1,10% 29.964 12,2% 3.0€
CórdobaQ2 17 Q4
0,78 17 Q2 18 Q4 18-2.261 Q2 -0,29%
19 Q4 19
17.964 25,3% 2006 2007 2008 2009 2010 2011 2012 2013 2014 2015 2016 2017 2018 2019
Girona 9.097 +1,19% 28.674 8,0%
Spain Valencia Andalusia Catalonia Basque C. Madrid
0,77 11A Appendix ALBORADA HOMES – MALAGA Delivered Q2 2020
H1 2020 FINANCIALS HIGHLIGHTS
                   EBITDA of €15M and Net Income of €7M

                                                                                         Quarterly Progress
    Financial KPIs
                                                                                                Revenues

                    P&L
                                        €101m            €15m               €7m            51                51

                                        Revenues         EBITDA           Net Income     Q1 2020         Q2 2020

                                                                                                 EBITDA
                                        €1.3bn            82%
                    Balance Sheet      Development
                                                                           €133m            8                7
                                                     Of Development
                                                                             Cash¹
                                          Stock       Stock is Active                    Q1 2020         Q2 2020

                                                                                                Net Income

                                        €249m            €325m               19%            4
                      Leverage                                                                               3
                                        Net Debt     Adjusted Net Debt       LTV
                                                                                         Q1 2020         Q2 2020

                                                                                                   LTV

                                        €1.4bn           €11.4m              58%          18%              19%
                      Servicing
                                          AuM            Revenues        EBITDA Margin   Q1 2020         Q2 2020

1   Includes €38m of restricted cash                                                                               13
NEINOR RENTAL SEED PORTFOLIO: TOP PERFORMING RENTAL MARKETS
OPERATING ASSUMPTIONS LOCATION OF INITIAL 611 UNITS FINANCIAL CONSIDERATIONS
• Delivery: ’21: 113# /’22: 498# • €95m CapEx, 100% financed with banks
• Occupancy: 95% in Year 2 • Gross Yield on Cost: 6-7%
284
• Monthly rent 2019 psm: €9,1 • Tax efficient (@4% CIT and reduced VAT)
214
• Monthly rent 2019 per unit: €1,045 • PRS decided as the most profitable use – Brings
• Stabilized rent: €8.7m forward the use of plots
113
• FFO: ~€4.8m • ROE: 15%
SELECTED LOCATIONS IN TOP-PERFORMING RENTAL MARKETS WITH GROWTH POTENTIAL
Hacienda Homes – Málaga Sky Homes – Valencia SS de los Reyes – Madrid Parla – Madrid
• In Malaga city, walking distance from • In Valencia city. Main expansion • One of the wealthiest regions of • Parla is a dormitory city South of
main universities, the Malaga Justice neighborhood in front of La Fe Madrid A. Com., 5 mins car/Tube/bus Madrid with c. 130,000 inhabitants,
complex and Virgin Victoria Hospital Hospital with 6,000+ employees and from major office hub of North demographic growth and almost
• Great tube and bus connections 300,000 patients per year. Madrid (Telefonica, BBVA, etc) and 50% below 35 years old. Plots in a
• Non-existent new product rental nearby Infanta Sofia Hospital fully consolidated neighborhood
• Very low rental stock in an area with
avg. +10% annual rent increase over supply in an area with avg. 8% • Limited rental supply, with avg. 7% • Direct trains to center every 15 min.
the last 4 years annual rent increase the last 4 years annual rent increase last 4 years • Limited rental supply in the area,
• Contrasted sales demand with avg of 4 • Contrasted sales demand with avg of • Contrasted sales demand with avg of with avg. 8% annual rent increase
units/sold per month last 2 years 7 units/sold per month last year 6,5 units/sold per month last 2 years last 4 years 14
(Phase 1) (Phase 1) (Dehesa, Alea, Bulevar)You can also read