For Puerto Rico, There is a Better Way - A Second Look at the Commonwealth's Finances and Options Going Forward Authored by Jose Fajgenbaum, Jorge ...
←
→
Page content transcription
If your browser does not render page correctly, please read the page content below
BASED ON PUBLIC INFORMATION

For Puerto Rico, There is a Better Way
A Second Look at the Commonwealth’s Finances and Options Going Forward

Authored by Jose Fajgenbaum, Jorge Guzman, and Claudio Loser

July 2015
BASED ON PUBLIC INFORMATION

Disclaimer

This presentation has been prepared by Centennial Group International (“Centennial”) for the exclusive use of the party to whom
Centennial delivers this presentation, using information made publicly available by the entities that are the subject of such presentation
(together with its subsidiaries and affiliates, the "Commonwealth") and other publicly available information. Centennial has not
independently verified the information contained herein, nor does Centennial make any representation or warranty, either express or
implied, as to the accuracy, completeness or reliability of the information contained in this presentation. Any estimates or projections as
to events that may occur in the future (including projections of revenue, expense, and net income) are based upon the best judgment of
Centennial from information made publicly available by the Commonwealth (including its advisors and representatives) and other
publicly available information as of the date of this presentation. There is no guarantee that any of these estimates or projections will be
achieved. Actual results will vary from the projections and such variations may be material. Nothing contained herein is, or shall be relied
upon as, a promise or representation as to the past or future. Centennial is not undertaking to provide any legal, regulatory, accounting,
insurance, tax or other similar professional advice in this presentation. Nothing contained herein is, or shall be relied upon as, such
advice. Centennial and its affiliates expressly disclaim any and all liability relating or resulting from the use of this presentation.

This presentation has been prepared solely for informational purposes and is not to be construed as a solicitation or an offer to buy or
sell any securities or related financial instruments. No investment, divestment or other financial decisions or actions should be based
solely on the information in this presentation and Centennial is not, by making this report available, providing investment, legal, tax,
financial, accounting or other advice to you or any other party.

This material must not be copied, reproduced, distributed or passed to others at any time without the prior written consent of
Centennial.

                                                                                                                                           1
BASED ON PUBLIC INFORMATION
Bios
Jose Fajgenbaum is Director of Centennial Group Latin America. Prior to joining the Centennial Group, he worked at
the IMF for more than 30 years, where he advanced from economist to Deputy Director. His key role included leading
missions to surveillance countries, such as Brazil, Israel, Russia and South Africa, as well as to countries with economic
countries supported by the IMF, such as Brazil in the early 1990s, the Dominican Republic, Kenya, Malawi, Peru and
Trinidad and Tobago. He holds a BA from the National University of Cuyo, an MA in economics from the University
of Chicago, and completed his Doctoral studies in economics at the University of Chicago.
Jorge Guzman is a consultant for Centennial Group Latin America. He worked at the IMF for 27 years as a
macroeconomist, including as mission leader to countries with IMF-supported structural adjustment programs in
Latin America and the Caribbean. He holds a B.S. in Electrical Engineering from the U.S. Military Academy (“West
Point”) and a Ph.D. in Economics from Georgetown University.
Claudio Loser is Founding Director and Chief Executive Officer of Centennial Latin America. He is a well-known
authority on Latin American economies and institutions. During his career at the International Monetary Fund he held
many senior positions, including Director of the Western Hemisphere Department. Under his leadership, the
Department was actively involved in a wide range of surveillance, technical assistance, and research activities. Recently
he has worked closely with the G-24, the Andean Finance Corporation (CAF), the Rio Group of Latin American
Cooperation, and with a number of other financial corporations, dealing with developments in Latin America and the
evolving relations between these countries and the IMF. He is a Senior Fellow at the Inter-American Dialogue, a
Washington-based forum for opinion leaders and policymakers on Western Hemisphere affairs. He teaches
international economics and finance at the George Washington University. He has published in many journals, mostly
on Latin American economic issues. He graduated from the University of Cuyo, Argentina and received his Masters of
Arts and PhD from the University of Chicago in 1967 and 1971, respectively.
2BASED ON PUBLIC INFORMATION
Executive summary
Puerto Rico can avoid a costly default even after consideration of the Krueger Report (the
“Report”)
• Puerto Rico has a deficit problem, not a debt problem
• Deficit is fixable and extensive history exists of other governments that made similar or greater fiscal adjustments
and subsequently grew their economies
• Path laid out by the Governor has significant risks and is not the answer to Puerto Rico’s deficit problem
– Ignores legal limitations and the priority granted to GO and Commonwealth guaranteed debt by the Puerto
Rico Constitution
– Ignores large and long lasting economic costs
– Ignores significant costs to on-island retail and institutional investors who hold substantial amounts of the
Commonwealth’s obligations
• Puerto Rico has ~18 different debt issuing entities that make up the $72 billion of outstanding debt. Each entity
has its own legal particularities and financial capacities and thus each should be considered individually
3BASED ON PUBLIC INFORMATION
Puerto Rico government has begun to make a fiscal adjustment
Puerto Rico’s true deficit has been shrinking
• Deficit estimated to be only 1.3% of GNP in FY2015
Central Government Overall Balance and GNP Growth
0 1.2%
FY2013 FY2014 FY2015P
Central Government Overall Balance ($US Millions)
1.0%
($500)
1.0%
0.8%
($1,000)
(932)
GNP Growth
0.6%
($1,500) 0.6%
0.4%
($2,000)
(2,066) 0.2%
($2,500)
0.0%
(2,580) 0.0%
($3,000) -0.2%
Source: “Puerto Rico – A Way Forward” - 7/13/2015
4BASED ON PUBLIC INFORMATION
Krueger Report shows path forward without need for a default
Report demonstrates the ability of Puerto Rico to generate a growing surplus
• Report suggests several measures for both fiscal and structural reform
• Fiscal reform measures
– Revenue increases of $3 billion per year by 2020, $4 billion per year by 2025
– Adoption of increased SUT
– Income tax surcharge on corporations receiving exemptions, eventual move to flat rate
– Step up in property taxes (real property values were last assessed in 1958)
– Increased individual income taxes from higher labor participation
– Expense cuts of $2 billion per year by 2020, $2.5 billion by 2025
– Freeze formula-based General Fund appropriations
– Reduce number of teachers to fit the size of the student population
– Reduce subsidy to University of Puerto Rico
– Cut excess Medicaid benefits
• Structural reform measures
– Amend local labor laws regarding overtime, vacation time, mandatory bonuses, and others
– Make welfare benefits consistent with local labor market conditions
– Reduce transportation costs by seeking Jones Act exemption
– Reduce energy costs via PREPA reform
– Modernize / improve processes to facilitate new business startups in Puerto Rico
– Specifically, property registrations, new business permits and tax collections
Source: Commonwealth reports
5BASED ON PUBLIC INFORMATION
Krueger Report shows path forward without need for a default (continued)
Report includes reform measures that can lead the Commonwealth to fiscal surpluses
• Below chart shows central government overall balance after including revenue and expenditure reforms and the
GNP effects of such reform as included in the Report
– Assumes status quo with respect to ACA and Act 154
• Financing should be utilized to provide bridge to implement reform measures
Central Government Overall Balance After Reform Measures
$5,000
4,303 • Transition to fiscal
surplus, after
Overall Balance After Reform Measures ($US Millions)
$4,000 3,860
payment of interest,
3,355 by FY2017
$3,000
2,947 • Positive overall
2,519 balances (i.e.
2,311 FY2017 and
$2,000
1,814 later) allow debt
1,250
levels to be paid
down
$1,000
379
0
(519)
($1,000)
FY2016 FY2017 FY2018 FY2019 FY2020 FY2021 FY2022 FY2023 FY2024 FY2025
Source: “Puerto Rico – A Way Forward” - 7/13/2015
6BASED ON PUBLIC INFORMATION
Puerto Rico has room to increase revenues
Puerto Rico’s federal and state tax collections are low compared to US states
• Commonwealth has opportunity to increase revenue while maintaining tax levels inline with the US states
• Below chart shows state and federal taxes as a percent of GDP for the US states, Puerto Rico is shown both as a
percent of GNP and GDP
State and Federal Tax Collections as a % of GDP/GNP (1)
40%
35%
30%
25%
20%
15%
10%
5%
0%
Rhode Island
Alabama
Texas
North Dakota
Vermont
Ohio
Mississippi
Virginia
Kansas
Illinois
Idaho
Iowa
Louisiana
Colorado
Missouri
Minnesota
Kentucky
Indiana
Pennsylvania
Nebraska
South Carolina
Wyoming
South Dakota
Montana
Nevada
Hawaii
Maine
Connecticut
Alaska
North Carolina
Washington
Michigan
Tennessee
Delaware
Puerto Rico (GDP)
New Mexico
Oregon
Utah
West Virginia
Arizona
Oklahoma
Florida
Maryland
Massachusetts
Arkansas
Georgia
California
Wisconsin
New Jersey
New York
Puerto Rico (GNP)
New Hampshire
Sources: Commonwealth reports, IRS and US Bureau of Economic Analysis
Notes:
(1) For FY2013.
7BASED ON PUBLIC INFORMATION
Puerto Rico has room to increase revenues (continued)
Improve tax collection rates
• Estimated that Puerto Rico sales tax compliance is 56% (1) compared with an average of 83% (2) in the 50 states
• Extrapolation would suggest an incremental $1.1(3) billion available if Puerto Rico sales tax collection rates
could be improved to the 50 state average
– Sales tax is only a small part of the broader tax collections
• An increase in compliance rates would provide additional revenue to the government without increasing the
burden on the existing tax base
• Increased fiscal flexibility associated with improved tax compliance can be used to facilitate further GNP growth
in the medium-term
Source: Commonwealth reports , KPMG and IRS
Notes:
(1) KPMG - Commonwealth of Puerto Rico Tax Reform Assessment Project Unified Tax Code of Puerto Rico: Tax Policy Implementation Options General Explanation of Principal Options 10/31/2014.
(2) IRS gross tax compliance rate.
(3) $1.1 billion equals difference between the 10.5% SUT collected at 56% and 83% compliance levels assuming ~$40.3 billion in tax base.
8BASED ON PUBLIC INFORMATION
Puerto Rico has room to lower expenses
Total governmental expenditures increased 29% or $4.4 billion in the past decade while
population declined 6%
• Government expenditures have not been adjusted to reflect Commonwealth’s current situation
Total Governmental Expenditures and Population (1)
3,900
$21
Governmental Expenditures ($US Billions)
3,827 3,850
$20 $19.6
Population (in Thousands)
3,800
$19
$18 3,750
$17 3,700
$16 3,650
3,615
$15.2
$15 3,600
FY2004 FY2005 FY2006 FY2007 FY2008 FY2009 FY2010 FY2011 FY2012 FY2013
Total Governmental Expenditures Population
Sources: Commonwealth reports
Notes:
(1) Total governmental expenditures equal to Governmental Funds total expenditures as reported in the Commonwealth’s annual audited financials.
9BASED ON PUBLIC INFORMATION
Puerto Rico has room to lower expenses (continued)
Education expenditures increased 39% or $1.4 billion in the past decade while total school
enrollment declined ~25%
Education Expenditures and School Enrollment (1) (2)
764,861
$5.0 750,000
$4.8
Education Expenditures ($US Billions)
700,000
School Enrollment
$4.5
650,000
$4.0
600,000
$3.5 573,494
$3.5 550,000
FY2004 FY2005 FY2006 FY2007 FY2008 FY2009 FY2010 FY2011 FY2012 FY2013
Education Expenditures School Enrollment
Sources: Commonwealth reports
Notes:
(1) Education expenditures equal to Governmental Funds education expenditures as reported in the Commonwealth’s annual audited financials.
(2) FY2004 – FY2012 school enrollment per the Commonwealth’s 6/30/2012 audited financials, FY2013 total enrollment unavailable and estimated based on historical growth rates, i.e. 573,494 =
588,384 * (100% – 2.5%).
10BASED ON PUBLIC INFORMATION
Puerto Rico has other additional opportunities to improve liquidity
Public private partnerships and real estate value
• Commonwealth should consider the successful public private partnership precedents set by PR-22/PR-5, the
Luiz Munoz Marin International Airport, and the Teodoro Moscoso Bridge as a roadmap for additional PPP’s
• Government real estate such as buildings and ports has the potential for billions in additional revenue
– PBA, PRCCDA, and PRIDCO owned buildings total ~$4.1 billion in carrying value
– Ports Authority and Port Authority of the Americas capital assets not already under a concession agreement
total ~$1.0 billion
$6.0
$5.1
$5.0
$4.0
$US Billions
$3.0 $2.5
$2.0
$1.0
0
FY2016 Financing Gap Potential Value of Real Estate
Source: Commonwealth reports and press reports
11BASED ON PUBLIC INFORMATION
Puerto Rico can make a fiscal adjustment and grow
Countries in comparable situations have grown after fiscal adjustment
• Contrary to conventional wisdom that fiscal adjustment programs cause recessions and political costs to
governments, the Independent Evaluation Office of the IMF found that the average growth rate in the first
program year improved over the previous year and in the second year improved further, surpassing the average
of the pre-program decade
– Based on a review of 133 programs with an average targeted fiscal adjustment of 2% of GDP over two years
• IMF has found that
– Fiscal adjustment programs generally have had a positive effect on GDP growth
– Fiscal balances in program countries improved substantially faster than in the non-program countries
• Puerto Rico should eliminate its fiscal deficit in order to regain normal market access
– Given lack of economic growth, Puerto Rico must bring the Governmental Funds into full balance using
fiscal adjustment measures
– Recent and proposed measures, if implemented, would allow Puerto Rico to obtain fiscal surpluses
Source: IMF and Commonwealth reports
12BASED ON PUBLIC INFORMATION
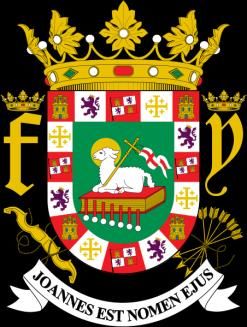
Puerto Rico can make a fiscal adjustment and grow (continued)
Below examples show that deficit reductions of ~2% of GDP can be accompanied with
strong positive economic growth
• All countries included in the chart below made a fiscal adjustment without recourse to debt restructuring
Improvements in GDP Growth and Fiscal Performance (1) (2)
12.0%
10.1%
10.0%
8.9%
8.0%
6.0% 5.4%
5.3%
4.8%
4.0% 4.2%
4.0% 3.4%
3.3%
2.8%
2.5% 2.4% 2.4% 2.4% 2.3%
2.1% 2.1%
2.0% 1.5% 1.7% 1.5%
1.5%
1.4% 1.3% 1.3%
1.1%
0.3% 0.5% 0.4% 0.5% 0.5%
0.0%
Brazil Brazil Colombia Croatia El Honduras Ireland Mexico Panama Paraguay Peru Poland Spain Turkey Uruguay
1998 2002 2000 2001 Salvador 2004 2011 2004 2005 2006 2002 2004 2012 2002 2002
2009
Change in Annual GDP Growth (%) Cummulative Improvement in Fiscal Balance (% GDP)
Sources: IMF and J.P. Morgan
Notes:
(1) Shows cumulative improvement in fiscal balance from year prior to program to year after program and improvement in average GDP growth before and after program.
(2) Paraguay had an initial fiscal surplus position. Panama, Poland and Spain did not have programs with the IMF when they engaged in their adjustment effort.
13BASED ON PUBLIC INFORMATION
Path laid out by the Governor has significant costs and risks
An attempt to impair GO bonds would be costly and unsuccessful
• GO constitutional priority
– Puerto Rico’s Constitution provides that GO and Commonwealth guaranteed debt service shall be paid first before
other expenditures
– Priority granted by Article VI of the Puerto Rico Constitution
– No state in recent history has defaulted on its GO bonds
• Disregards ability to clawback ~$1.0 billion of revenues annually
– Revenue currently appropriated to HTA, PFC, PRCCDA and PRIFA totals ~$1.0 billion annually
– Commonwealth obligated to redirect revenue for payment of GO debt service
– Clawback-able revenues could cover the vast majority of the ~$1.2 billion in annual GO debt service
$1.5
$1.2
$1.0
$1.0
$US Billions
$0.5
0
Clawback-able Revenues FY2016 GO Debt Service
Source: Commonwealth reports, Bloomberg and EMMA
14BASED ON PUBLIC INFORMATION
Costs of default will be high
Restructuring will come at the expense of the Commonwealth and its people
• Argentina, as a result of its fight with creditors and ensuing uncertainty regarding economic policy in the country has
seen foreign direct investment collapse and large capital flight of well over $150 billion
– Locked out of international capital markets after pursuing a unilateral restructuring and as a result still cannot
obtain foreign financing at reasonable interest rates
– Only financing by China at undisclosed rates is preventing a sharp decline in international reserves
– Combination of non-market and non-creditor friendly policies has resulted in a collapse in confidence and economic
recession
• Detroit’s bankruptcy fees totaled ~$180 million or 17% of FY2013 general fund revenue
– Costs to Puerto Rico expected to be much higher due to larger, more complex capital structure, lack of established
bankruptcy process, and GO and Commonwealth guaranteed constitutional protections
– Puerto Rico has ~18 different debt issuing entities each with different complexities and structural issues
• Three major banks, Banco Popular, First BanCorp and Oriental, lost $900 million in combined market cap in the week
following the Governor’s announcement
– Stocks were down 10%, 26% and 31% respectively in four days following the Governor’s speech
• Creditors that may be impacted by the Governor’s plan are largely on-island, and include many retail holders
– Local investor who bought GDB bonds worth $10,000 has seen the value of those holdings shrink to ~$4,000
– Local investor who bought GO bonds worth $10,000 has seen the value of those holdings shrink to ~$6,500
– Reported that UBS no longer allows clients to use Puerto Rico bond funds or closed-end fund shares as collateral
– Significant amount of these clients are on-island
Source: City of Detroit financials, press reports, Bloomberg, and EMMA
15BASED ON PUBLIC INFORMATION
Government should take the initiative to create a better Puerto Rico
Reforms should be coupled with measures to grow the economy
• Government has opportunity to consolidate entities, improve IT systems, and strengthen controls and
accounting
• Additionally the government can focus on growing underutilized parts of the economy and improving areas the
World Bank ‘Doing Business’ profile (1) cites as opportunities to enhance competiveness
• Tourism industry
– Growth in tourism has lagged many Caribbean peers and Puerto Rico’s status affords it large advantages
over other destinations that require a passport to travel to
• Agriculture industry
– Agriculture represents 1% of GNP currently and opportunity exists to replace the large amount of imported
food consumed with food grown/raised on-island
– Potential to generate billions in local revenue by utilizing greater amount of farmland
• Existing port infrastructure
– Puerto Rico has one of the largest port systems in the Caribbean
– Infrastructure exists to receive Post-Panamax size ships
Source: Commonwealth reports and press reports
Note:
(1) http://www.doingbusiness.org/data/exploreeconomies/puerto-rico/~/media/giawb/doing%20business/documents/profiles/country/PRI.pdf
16BASED ON PUBLIC INFORMATION
Contact information
http://www.centennial-group.com/
Washington, DC:
Watergate Office Building
2600 Virginia Ave, NW, #201
Washington, DC 20037
202-393-6663
17You can also read