Investor Presentation - TSX:DRT August 2019 "Doing It Right This Time" - DIRTT ...
←
→
Page content transcription
If your browser does not render page correctly, please read the page content below
“Doing It Right This Time”

Investor Presentation
                             August 2019
                             TSX:DRT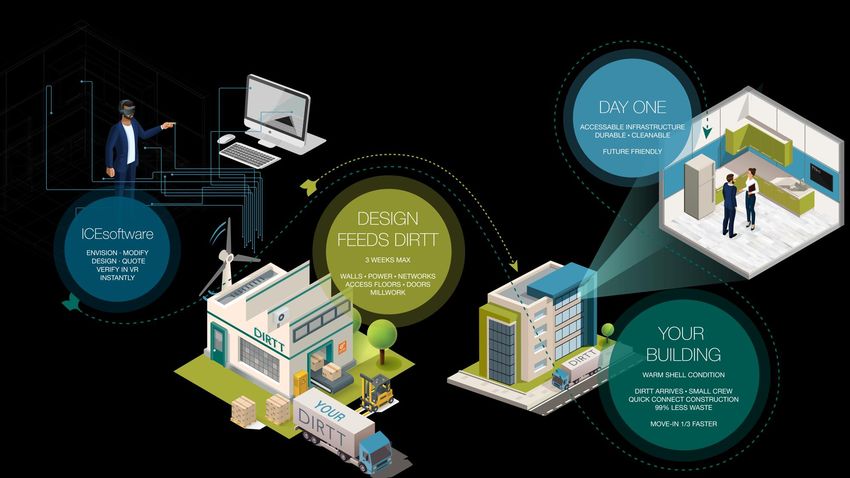
Advisories
General
This presentation is not, and does not constitute, an offer to sell or the solicitation, invitation or recommendation to purchase any securities in any jurisdiction, and neither this presentation nor anything contained herein shall form the basis of any contract or
commitment.

Forward-Looking Information
This presentation contains certain forward-looking statements and forward-looking information (collectively, "forward-looking information") within the meaning of applicable securities laws. Forward-looking information is not historical fact and is generally, but not
always, identified by words such as "expects", "expected", "proposes", "anticipates", "believes", "estimates", "intends", "plans", "project", "continues", "outlook", "potential" or similar words and expressions, or that events or conditions "will", "would", "may", "could"
or "should" occur including, without limitation, statements regarding the Company’s business plans and objectives; estimates of domestic and international economics; and growth strategy and opportunities.

Forward-looking information contained in this presentation is based on management’s expectations and assumptions regarding, among other things: the Company’s ability to manage its growth; competition in the Company’s industry; the Company’s ability to
enhance current products and develop and introduce new products; the Company’s ability to obtain components and products from suppliers on a timely basis and on favorable terms; the Company’s ability to obtain qualified staff and equipment in a timely and
cost-efficient manner; the regulatory framework governing taxes in Canada and the United States of America and any other jurisdictions where the Company currently or may conduct its business in the future; future development plans for the Company’s assets
unfolding as currently envisioned; future capital expenditures to be made by the Company; future sources of funding for the Company’s capital program; the Company’s ability to list on an accredited exchange in the United States of America; the impact of
increasing competition on the Company; the Company’s ability to remediate product deficiencies and the Company’s success in identifying other risks to its business and managing the risks mentioned below. Many of the foregoing assumptions are subject to
change and are beyond our control.

By its nature, such forward-looking information involves significant known and unknown risks and uncertainties, which could cause results or outcomes to differ materially from those anticipated. These risks and uncertainties include, but are not limited to:
maintaining and managing growth; history of financial losses; risks related to new technology; competition risk; operating results and financial condition fluctuations; risks related to intellectual property; risks related to additional capital requirements; customer base
and market acceptance; software and product defects and design risks; availability of key supplies; dependence on key personnel; changes in management; availability of manufacturing labour; capacity of manufacturing facilities; commodity price risk; credit risk;
the effect of government regulation; risks related to international expansion; risks related to physical facilities; legal risks; foreign currency and fiscal matters; risks related to future acquisitions; risks related to forward-looking information; reliance on third parties;
and conflicts of interest. The foregoing list of risks and uncertainties is not exhaustive. The effect of any one risk or uncertainty on particular forward-looking information is uncertain because these factors are independent, and management's future course of
action would depend on an assessment of all available information at that time. Further information regarding the assumptions and risks inherent in the making of forward-looking information can be found in the Company’s Annual Information Form and other
continuous disclosure documents. Copies of the Annual Information Form and the Company’s other continuous disclosure documents are available on the Company's website at www.dirtt.net and on SEDAR at www.sedar.com and prospective investors and
others should refer to such materials before making any investment decision.

Although the Company believes the assumptions and expectations used in the forward-looking information contained in this presentation are reasonable, due to the risks, uncertainties and assumptions inherent in forward-looking information, there can be no
assurance that these assumptions and expectations will be correct and prospective investors in our securities should not place undue reliance on such forward-looking information contained in this presentation. In addition, this presentation may contain forward-
looking information attributed to third party industry sources. Accordingly, readers are cautioned that if one or more of these risks or uncertainties materialize, or should assumptions and expectations underlying forward-looking information prove incorrect, actual
results or outcomes could differ materially from those described in this presentation.

The forward-looking information contained in this presentation is expressly qualified by the foregoing cautionary statements. Unless otherwise stated, forward-looking information included in this presentation is made as of the date of this presentation and the
Company undertakes no obligation to update or revise any forward-looking information to reflect new events or circumstances or otherwise, except as required by applicable law.

Notice to Residents of the United States of America
The securities of DIRTT have not been registered under the United States Securities Act of 1933, as amended (the "U.S. Securities Act") or securities laws of any state of the United States of America, its territories or possessions or areas subject to its jurisdiction
("U.S.") and may not be offered or sold in the U.S. except in certain transactions exempt from the registration requirements of the U.S. Securities Act and in compliance with any applicable securities laws of the jurisdictions where the offering or sale is being
made.

Currency and Presentation of Financial Information
Unless otherwise indicated, references to "CDN$" or "$" are to Canadian dollars and references to "US$" are to U.S. dollars. Unless otherwise indicated, all financial information relating to the Company in this presentation
has been prepared in Canadian dollars using International Financial Reporting Standards ("IFRS").

2
Non-IFRS Measures
The term "Adjusted Gross Profit", “Adjusted Gross Profit %”, "Adjusted EBITDA", "Adjusted EBITDA %", "Adjusted Operating Expenses", “Adjusted Net Income” and “Net cash flows provided by operating
activities before changes in non-cash working capital” are financial measures used by DIRTT that are not standard measures under International Financial Reporting Standards ("IFRS") as adopted by the
Canadian Institute of Chartered Accountants. DIRTT’s method of calculating Adjusted Gross Profit, Adjusted Gross Profit %, Adjusted EBITDA, Adjusted EBITDA %, Adjusted Operating Expenses,
Adjusted Net Income and Net cash flows provided by operating activities before changes in non-cash working capital may differ from the methods used by other issuers. Therefore, these non-IFRS
measures may not be comparable to the same measures presented by other issuers.

Adjusted Gross Profit is gross profit before deductions for depreciation and amortization of equipment, tooling and intangible assets for manufacturing-related assets. Adjusted Gross Profit % is Adjusted
Gross Profit divided by revenue. We use these measures to assess our manufacturing and operating performance. As manufacturing volumes and revenue rise, production synergies tend to permit
improvements in gross profit, subject to variability in monthly manufacturing volumes and product/service revenue mix.

Adjusted EBITDA is net income before interest, taxes, depreciation and amortization, plus: non-cash foreign exchange gains or losses on debt revaluation; stock based compensation expenses;
reorganization costs; and any other non-recurring gains or losses. Adjusted EBITDA % is calculated as Adjusted EBITDA divided by revenue. We use these measures as a performance measure as they
are widely used by securities analysts and investors to evaluate financial performance, as well we use these measures to assess our ability to generate cash flows, service debt, pay current taxes and fund
capital expenditures.

Adjusted Operating Expenses is Operating Expenses before deductions for depreciation and amortization of non-manufacturing related assets, stock-based compensation expenses and reorganization
costs. We use this as a measure of the efficiency and effectiveness of our sales and marketing efforts and overall administrative support efforts by comparing them to prior period results.

“Adjusted Net Income” is net income (loss) excluding the tax effected impact of reorganization costs and stock-based compensation fair value adjustment.

"Net cash flows provided by operating activities before changes in non-cash working capital" are net cash flows provided by operating activities and adding back the change in non-cash working capital.

For a reconciliation of these non-IFRS measures see DIRTT’s annual and interim Management Discussion and Analysis, complete copies of which are available on the Company’s website at www.dirtt.net
and on SEDAR at www.sedar.com.

3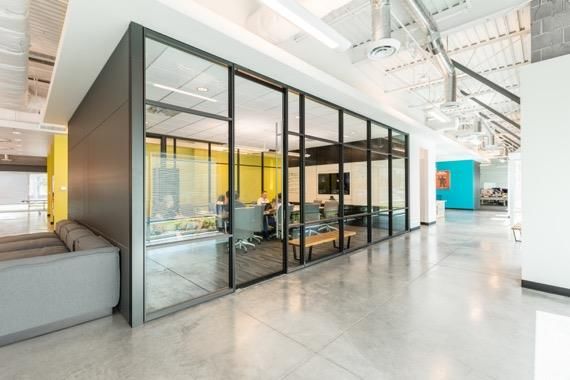
What is DIRTT?
                 TSX:DRT                              A different approach to commercial interior construction
                                                      driving cost and schedule certainty, faster move-in and
Preparing to List on Nasdaq Fall                      ultimately increased customer satisfaction.
              2019

           $367M Revenue                                      Proprietary prefabricated interior wall and millwork system, 100%
                TTM Q3/18-Q2/19                               customizable and easily modified post installation

      >14% Revenue CAGR
                    2015-2018                                 Enabled by proprietary software platform that integrates the design,
                                                              sale, pricing and manufacturing process
      $55M Adj EBITDA
    15% Adj EBITDA Margin                                     Sold through an extensive North American dealer network that
                TTM Q3/18-Q2/19
                                                              provides pre-construction, design, installation and post-installation
                                                              reconfiguration services
       218 Patents Granted

  Note: all figures in CAD$, unless otherwise noted
     4
Investment Thesis – Why DIRTT
                      •   Patented, proprietary product design and software
        Proven        •   Project base includes >170 Fortune 500 clients

        Large
                      •   Displacing US$150B conventional construction market
    Underpenetrated   •   Less than 1% penetrated currently
        Market

                      •   New, proven executive team driving improvements across the
        New               organization
     Management       •   Setting the stage now for scalable growth, with an enhanced
                          sales and marketing organization and recently announced
                          capacity expansion

       Financial      •   $77M cash, no debt
       Strength       •   Cash flow positive business

5
Value Proposition

    Higher Quality                        Faster Execution                         Better Value

• Superior customer satisfaction with    • 2 week manufacturing lead time    • Day 1 construction costs often less
  3D/VR experience prior to                                                    than conventional construction
  construction                           • Speed and cleanliness of
  ✓Eliminates change orders                installation                      • Less expensive than conventional
  ✓Maximizes client satisfaction at                                            over the life of the project
   move-in                               • Shorter construction cycle time
                                           ✓Less reliance on on-site labor
• Modularity allows flexibility to         ✓Typical DIRTT budget is 30%
  change as needs evolve,                   labor vs. 70% in conventional
  maintaining client satisfaction with
  their space over time
                                         • Reduces time to occupancy
• Higher quality materials

6
Proprietary Design
Unique modular design allows for infinite flexibility to create custom interiors in Commercial, Healthcare, Education and Government

                                                                                Custom
                                              Flexible Medical                  Millwork,
     Aluminum                                     Gas for                     Willowglass       MDF tiles
                           Modular
      Frames                                     Healthcare                  surfaces with     finished in           MDF tiles in
                          Electrical &
                                                                              HD printed      veneer and             Healthcare
     (recycled denim         Data             (Proprietary, modular, fully
        insulation)                              approved in DIRTT’s             image,       chromacoat
                                                   accessible walls)           integrated
                                                                              technology
                                           Same Solution, Different Markets

7
Doing It Right This Time (DIRTT)
      PLAN                            DESIGN                    MANUFACTURE                   BUILD                              USE

     Integrated process: Design, specification, pricing,                      Schedule compression: Speed and accuracy with offsite
     manufacturing, delivery and installation of a project all                manufacturing, fast and clean installation within three weeks
     coordinated from one technology file. No technology gaps                 of finalizing design. Design feeds directly to production facilities,
     to manage between multiple applications.                                 mitigating risk of human error and eliminating timing delays.

     Visual certainty: What you see is what you get:                          Sustainability: Custom, prefab manufacturing drastically
     interactive 3D and virtual reality provides full                         reduces waste and eliminates deficiencies; modularity of
     understanding of project during design phase                             space allows long-term adaptability

     Higher quality: With faster schedule and certainty in                    Cost certainty: Immediate, accurate pricing information
     design, budget goes to higher-quality materials and finishes             available from the outset and throughout the design process
     rather than labor, re-work and contingencies

    PREDICTABLE PROCESS                                                  PREDICTABLE OUTCOMES

8
The DIRTT Process

9
NON-RESIDENTIAL
NORTH AMERICA
MARKET
Market Opportunity
US$150 Billion*
DIRTT is displacing conventional construction
Conventional Construction DIRTT
uncertainty certainty
Flips the traditional budget
Skilled labor shortage on site equation to reduce labor cost
Price quoted prior to order,
DIRTT
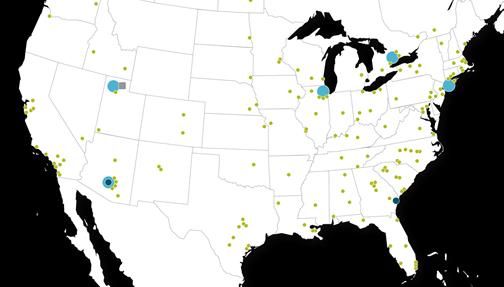
Pressure on project costs eliminating cost overrunsDIRTT Partner Locations DIRTT’s Approach to Market
DIRTT
DIRTT Partners
with ICE Software
Design | Manage | Install | Execute On-site
Each Partner is required to invest in:
▪ DIRTT Champion DIRTT Sales GCs, Architects,
▪ DIRTT Project Manager
DIRTT Partners
Reps Designers
▪ DIRTT Designer
▪ Proprietary ICE® Software Package
▪ Green Learning Center (GLC)
11Near-Term
Opportunity
Priorities 2019 a Transitional Year
Establishing the corporate infrastructure to seize the market opportunity
Manufacturing Sales & Marketing
Cost Discipline
Excellence Transformation
Complete Nasdaq listing in Fall 2019 2018-2019
2019-2020 2019-2021
• Eliminating non-value • Improving productivity • Aggressive sales growth
add expenditures and and financial return through:
creating long term through: ✓Strategic customer
efficiency through: ✓Formal tracking of segmentation
✓ROI discipline safety, quality, delivery, ✓Targeted lead
✓Improved accountability inventory and generation
Complete 3-5 year strategic plan and and authority framework productivity ✓National Accounts
communicate to investors in Fall 2019 ✓Scalable corporate ✓Eliminating bottlenecks Strategy
function and operational ✓Stronger and scalable
inefficiencies sales organization
✓Introduction of strategic • CCO joining Fall 2019 to
sourcing and logistics lead the transformation
planning
• 4 plant location in
th
process –in service early
2021
Execute on operational improvements
12Financial Performance
Adjusted EBITDA
Revenue (CDN Millions) $60.0 18.0%
$400 $356 $367 16.0%
$50.0
$350 14.0%
$293
$300 $267 $40.0 12.0%
$250 $236 10.0%
$30.0
$200 $187 8.0%
$20.0 6.0%
$150
4.0%
$100 $10.0
2.0%
$50
$- 0.0%
$- 2014 2015 2016 2017 2018 TTM
2014 2015 2016 2017 2018 TTM
Adj EBITDA (CDN Millions) Adj EBITDA %
3 Year CAGR >14% (2015-2018) Adjusted EBITDA
• 2019 guidance 5%-10% revenue growth, expectation to • Operating expense discipline yielded inflection in
be at the lower end of the range profitability
• Implementation of sales and marketing strategy • Manufacturing optimization starting to deliver
expected to drive future growth benefits
13Key Takeaways
• Patented, proprietary product design and software
• Fully customizable, flexible commercial solution suitable across market segments
Proven • Proven business model; 2015 – 2018 revenue CAGR >14%
• Project base includes >170 Fortune 500 clients
Large • Displacing $150B Conventional Construction market
Underpenetrated • Less than 1% penetrated currently
Market
• New proven executive team driving improvements across the organization
New • Setting the stage now for scalable growth, with an enhanced sales and marketing
Management organization and recently announced capacity expansion
• $77M cash, no debt
Financial
• Cash flow positive business
Strength • Low capex requirement
14Appendix 15
Leadership

     Kevin O’Meara                                       Geoff Krause
     Chief Executive Officer                             Chief Financial Officer
     •   Joined DIRTT in September 2018                  •   Joined DIRTT in May 2018
     •   Extensive operating experience in               •   25 years of financial management
         building products industry including                experience at public and private
         co-founding and scaling Builders                    growth companies
         FirstSource (NASDAQ: BLDR)                      •   Joined from Pure Technologies after
     •   20 years’ experience in construction-               its successful sale to Xylem Inc. in
         related industries, including as                    January 2018
         president and CEO of Atrium
         Corporation
16
Summary of Consolidated Financial Results
For the period-ended June 30 Three months Six months
($ thousands, except per share amounts) 2019 2018 % Change 2019 2018 % Change
Revenue 85,577 80,666 6 171,908 161,415 7
Gross profit 35,450 32,751 8 69,563 68,167 2
Gross profit % 41.4% 40.6% 2 40.5% 42.2% (4)
Adjusted Gross Profit1 36,842 34,703 6 72,747 71,949 1
Adjusted Gross Profit %1 43.1% 43.0% - 42.3% 44.6% (5)
Operating expenses3 29,050 30,952 (6) 69,989 61,266 14
Operating expenses %3 33.9% 38.4% (12) 40.7% 38.0% 7
Adjusted Operating Expenses1 27,102 26,616 2 51,024 51,614 (1)
Adjusted Operating Expenses %1 31.7% 33.0% (4) 29.7% 32.0% (7)
Operating income3 6,400 1,799 256 (426) 6,901 NA
Adjusted EBITDA1, 2 9,149 8,174 12 20,163 20,889 (2)
Adjusted EBITDA %1, 2 10.7% 10.1% 6 11.7% 12.9% (8)
Income tax expense 2,474 917 170 2,437 2,613 (7)
Net income (loss)3 2,984 778 284 (4,831) 4,340 NA
Net income (loss) per share - basic and diluted3 0.03 0.01 200 (0.06) 0.05 NA
1. See “Non-IFRS Measures”
2. In 2019, Adjusted EBITDA and Adjusted Operating Expenses were impacted by the prospective adoption of a new accounting standard for operating leases, which increased 2019 three
and six month depreciation expense by $1.4 million and $2.8 million and finance costs by $0.3 million and $0.7 million, respectively, with a corresponding reduction in rent expense. This
resulted in an increase of 2019 three and six month Adjusted EBITDA by $1.7 million and $3.5 million, or 2%, over the respective periods in 2018
3. Includes $2.2 million recovery and $6.9 million expense of stock-based compensation for the three and six month periods ended June 30, 2019
17Additional Financial Highlights
($ thousands) Jun 30, 2019 Dec 31, 2018
Cash and cash equivalents 76,868 72,865
Trade and other receivables 37,280 59,852
Inventory 24,488 25,442
Property, plant and equipment 47,207 50,104
Intangible assets 18,620 18,992
Right-of-use assets1 25,909 -
Trade accounts payable and other liabilities 30,413 42,673
Other current liabilities2 9,990 9,262
Long-term debt3,4 - 7,674
Lease liabilities1,3 28,699 -
1) Right-of-use asset and lease liability resulted from
prospective adoption of a new accounting standard for
For the three month period-ended operating leases effective January 1, 2019
Jun 30, 2019 Jun 30, 2018 2) The liability for cash-settleable stock options was $3.7
($ thousands) million for Q2 2019
Net cash flows provided by operating activities before 3) Current and long-term portions
8,316 6,083 4) Repaid on January 31, 2019
changes in non-cash working capital5 5) See “Non-IFRS Measures”
Net cash flows provided by operating activities 10,564 (709)
Capital expenditures (3,909) (6,640)
18Thank you DIRTT Environmental Solutions 7303 30th Street SE Calgary, Alberta T2C 1N6 ir@dirtt.net
You can also read