Q2 2021 Earnings Presentation - August 12, 2021 - Investor Relations | First ...
←
→
Page content transcription
If your browser does not render page correctly, please read the page content below

Q2 2021
Earnings Presentation

August 12, 2021

Disclaimer
FORWARD LOOKING STATEMENTS
This presentation contains “forward-looking statements” within the meaning of the Private Securities Litigation Reform Act of 1995. These forward-looking statements reflect our current views with respect to, among other things, our
operations and financial performance. Forward-looking statements include all statements that are not historical facts. These forward-looking statements relate to matters such as our industry, business strategy, goals, and expectations
concerning our market position, future operations, margins, profitability, capital expenditures, liquidity and capital resources, and other financial and operating information. In some cases, you can identify these forward-looking
statements by the use of words such as “anticipate,” “assume,” “believe,” “continue,” “could,” “estimate,” “expect,” “intend,” “may,” “plan,” “potential,” “predict,” “project,” “future,” “will,” “seek,” “foreseeable,” “guidance,” the negative
version of these words, or similar terms and phrases.
These forward-looking statements are subject to various risks, uncertainties, assumptions, or changes in circumstances that are difficult to predict or quantify. Such risks and uncertainties include, but are not limited to, the
following: the impact of COVID-19 and related risks on our results of operations, financial position, and/or liquidity; our operations in a highly regulated industry and the fact that we are subject to numerous and evolving laws and
regulations, including with respect to personal data and data security; our reliance on third-party data providers; negative changes in external events beyond our control, including our customers’ onboarding volumes, economic drivers
which are sensitive to macroeconomic cycles, and the COVID-19 pandemic; potential harm to our business, brand, and reputation as a result of security breaches, cyber-attacks, or the mishandling of personal data; the continued
integration of our platforms and solutions with human resource providers such as applicant tracking systems and human capital management systems as well as our relationships with such human resource providers; disruptions,
outages, or other errors with our technology and network infrastructure, including our data centers, servers, and third-party cloud and internet providers and our migration to the cloud; our ability to obtain, maintain, protect and enforce
our intellectual property and other proprietary information; our substantial indebtedness could adversely affect our ability to raise additional capital to fund our operations, limit our ability to react to changes in the economy or our
industry, and prevent us from meeting our obligations; and our Sponsor (Silver Lake Group, L.L.C., together with its affiliates, successors, and assignees) controls us and may have interests that conflict with ours or those of our
stockholders.
For additional information on these and other factors that could cause First Advantage’s actual results to differ materially from expected results, please see our prospectus, dated June 22, 2021, filed with the Securities and Exchange
Commission (the “SEC”) pursuant to Rule 424(b)(4) of the Securities Act of 1933, as such factors may be updated from time to time in our periodic filings with the SEC, which are accessible on the SEC’s website at www.sec.gov. The
forward-looking statements included in this presentation are made only as of the date of this presentation, and we undertake no obligation to publicly update or review any forward-looking statement, whether as a result of new
information, future developments, or otherwise, except as required by law.

NON-GAAP FINANCIAL INFORMATION
This presentation contains “non-GAAP financial measures” that are financial measures that either exclude or include amounts that are not excluded or included in the most directly comparable measures calculated and presented in
accordance with accounting principles generally accepted in the United States (“GAAP”). Specifically, we make use of the non-GAAP financial measures “Adjusted EBITDA,” “Adjusted EBITDA Margin,” “Adjusted Net Income,” and
“Adjusted Diluted Earnings Per Share.”
Adjusted EBITDA, Adjusted EBITDA Margin, Adjusted Net Income, and Adjusted Diluted Earnings Per Share have been presented in this presentation as supplemental measures of financial performance that are not required by or
presented in accordance with GAAP because we believe they assist investors and analysts in comparing our operating performance across reporting periods on a consistent basis by excluding items that we do not believe are
indicative of our core operating performance. Management believes these non-GAAP measures are useful to investors in highlighting trends in our operating performance, while other measures can differ significantly depending on
long-term strategic decisions regarding capital structure, the tax jurisdictions in which we operate, and capital investments. Management uses Adjusted EBITDA, Adjusted EBITDA Margin, Adjusted Net Income, and Adjusted Diluted
Earnings Per Share to supplement GAAP measures of performance in the evaluation of the effectiveness of our business strategies, to make budgeting decisions, to establish discretionary annual incentive compensation, and to
compare our performance against that of other peer companies using similar measures. Management supplements GAAP results with non-GAAP financial measures to provide a more complete understanding of the factors and trends
affecting the business than GAAP results alone.
Adjusted EBITDA, Adjusted EBITDA Margin, Adjusted Net Income, and Adjusted Diluted Earnings Per Share are not recognized terms under GAAP and should not be considered as an alternative to net income (loss) as a measure of
financial performance or cash provided by (used in) operating activities as a measure of liquidity, or any other performance measure derived in accordance with GAAP. The presentations of these measures have limitations as
analytical tools and should not be considered in isolation or as a substitute for analysis of our results as reported under GAAP. Because not all companies use identical calculations, the presentations of these measures may not be
comparable to other similarly titled measures of other companies and can differ significantly from company to company.
We define Adjusted EBITDA as net income before interest, taxes, depreciation, and amortization, and as further adjusted for loss on extinguishment of debt, share-based compensation, transaction and acquisition-related charges,
integration and restructuring charges, and other non-cash charges. We define Adjusted EBITDA Margin as Adjusted EBITDA divided by total revenues. We define Adjusted Net Income for a particular period as net income before taxes
adjusted for debt-related costs, acquisition-related depreciation and amortization, share-based compensation, transaction and acquisition-related charges, integration and restructuring charges, and other non-cash charges, to which
we then apply the related effective tax rate. We define Adjusted Diluted Earnings Per Share as Adjusted Net Income divided by adjusted weighted average number of shares outstanding—diluted. For reconciliations of these non- 2
GAAP financial measures to the most directly comparable GAAP measures, see the reconciliations included at the end of this presentation.

Scott Staples
Chief Executive Officer   Company Overview, Q2 2021 Highlights

                                                                 3
First Advantage – Successful IPO

    FA    NASDAQ Ticker

6/23/21   IPO Date

 29.3M    Shares Offered

$15.00    Offering Price

 +31%     First Day Stock
          Performance

 $3.0B    First Day Closing
          Market Cap

                                                                 4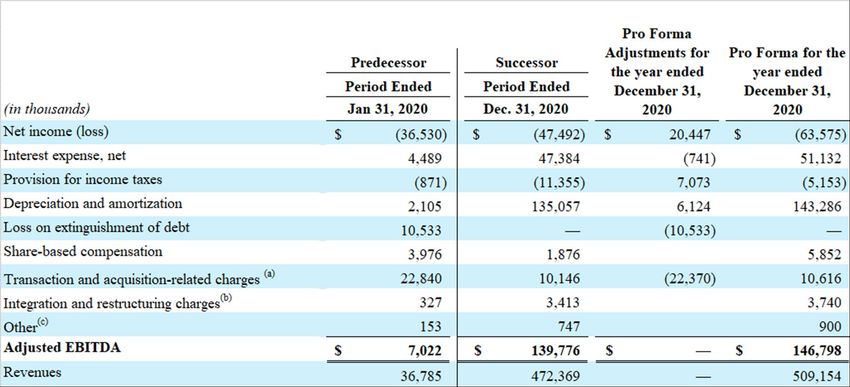
Key Strategies
                                               OUR CUSTOMERS
Company Snapshot
                                           30K                               75M                                   55                            ~95%                            12 Year
                                          Customers                            Screens                       of Fortune 100                          Gross                              Average
                                                                                                                                                                                        Tenure 2
Leading Global Provider                    in 2020                             in 2020                     165 of Fortune 500                       Retention
                                                                                                                                                     Rate 1
of Technology Solutions
for Screening, Verifications,
Safety, and Compliance
Related to Human Capital                       OUR TECHNOLOGY

                                               1                              65+                              600+                               2,200                            480M+
OUR MARKET                              Core Platform                   Human Capital
                                                                     Management Software
                                                                                                           Automated and / or
                                                                                                            Integrated Data
                                                                                                                                              Robotic Process
                                                                                                                                              Automation Bots
                                                                                                                                                                                      Records in
                                                                                                                                                                                      Proprietary
                                                                         Integrations                          Providers                     Currently Deployed                       Databases
                Total
$13B            Addressable
                Market                         OUR FINANCIALS (LTM Q2’21)

                of Whitespace         $600M                                  29%                            $181M                                  30%                                46%
  $7B           and Attractive
                Growth
                                           Revenue
                                     88% North America
                                      12% International
                                                                             Revenue
                                                                           Y/Y Growth 4
                                                                                                           Adjusted EBITDA 3                   Adjusted EBITDA
                                                                                                                                                   Margin 3
                                                                                                                                                                                  Adjusted EBITDA
                                                                                                                                                                                   Y/Y Growth 3, 4

                                 1. Average retention rate from 2018 to 2020.
                                 2. Tenure for Top 100 customers.
                                 3. See appendix for Adjusted EBITDA and Adjusted EBITDA Margin reconciliation.
                                 4. LTM Q2’20 period is presented on a pro forma basis for the “Silver Lake Transaction” and the related refinancing (On January 31, 2020, a fund managed by Silver Lake
                                    acquired substantially all of the Company's equity interests from the Predecessor equity owners, primarily funds managed by Symphony Technology Group).                5
                                    See appendix for pro forma reconciliation.
Quarterly Highlights

1   Favorable macro-economic and jobs trends and tailwinds, including hiring
    growth, new job creation, increasing turnover, and greater worker mobility

2   Increased momentum from our existing customers driven by broad-based hiring
    and screening growth across key verticals and geographies

3   Continued strength in new customer wins fueled by verticalized go-to-market
    teams, differentiated technology solutions, and global capabilities

4   Substantial rebound in international markets

    Continued margin expansion from robotic process automation, utilization of our
5   proprietary data and intelligent routing technology, further operational
    efficiencies, and G&A leverage

6   Completed UK screening business acquisition in March 2021
                                                                                     6
Differentiated and Embedded Technology Platform

                       Transforming a Complex Ecosystem into a Seamless Customer Experience
                              Criminal           Drug / Health   Executive    Biometrics Education / Work   Fleet /    Extended     Continuous   Hiring Tax
                             Background           Screening      Screening    & Identity   Verifications    Driver     Workforce    Monitoring   Incentives
                               Checks                                          Checks                     Compliance   Screening

                                                                                                                                                                       600+ Automated
 65+ HCM Software
                                                                                                                                                                      and / or Integrated
Partner Integrations                                             Machine Learning, Proprietary Databases & RPA                                                     3rd Party Data Providers

                                                            TM                                                 TM                                             TM

                                  AI-Powered Applicant                                  Global Ordering and                        Dynamic Customer Data &
                                       Experience                                       Processing Platform                          Analytics Dashboard

                                                                     AI, Compliance Rules Engine & Analytics

                       Employee            Volunteer                                                                                            Security
                                  Driver              Contingent /   Tenant                      Recruiter Risk Compliance        Vendor
                                                                                                                          Human          Safety
                                                   Freelance Workers                                                    Resources
                                                                                                                                  Mgmt.

                                    Applicant Users                                                            Corporate Users
                                                                                                                                                                                              7
Vertical Strategy Key to Differentiation and Growth

                                                         Key Verticals

   Deep customer        Vertical sales and        Technology & Business Services
  relationships and     customer success
 strategic dialogues        approach
                                                       Retail & E-Commerce

                                                            Healthcare

                                                  Financial Technology / Services
Accelerant for upsell       Products and
   and cross-sell        solutions driven by
                                                  Transportation & Home Delivery
                             innovation

                                                        Flexible Workforce

                                                                                    8
David Gamsey
EVP, Chief Financial Officer   Q2 2021 Financial Results, Outlook

                                                                    9
Q2 Financial Results

                           Revenues                                                           Adjusted EBITDA and Margin 1                          Adjusted Diluted EPS 1
  $ in millions,
  except per share data

                                                                                                                         $56.3
                                                    $174.8                                                    + 77.9%
                                                                                                                                    39%

                                                                                                                                                                          $0.25
                               + 66.5%                                                                                              37%

                                                                                                                                                            + 177.8%
                                                                                                                                    35%

                $105.0                                                                               $31.7
                                                                                                                                    33%

                                                                                                                        32.2%                      $0.09
                                                                                                                                    31%

                                                                                                     30.1%
                                                                                                                                    29%

                                                                                                                                    27%

                                                                                                                                    25%

              Q2 2020                             Q2 2021                                           Q2 2020             Q2 2021                   Q2 2020                Q2 2021

• Organic growth of 60%; acquisition related                                         • Driven primarily from revenue growth               • Positively impacted by lower outstanding
  growth of 7%                                                                       • Margin expansion attributed to increased             debt and lower interest rates, resulting in
• Accelerated hiring continued through Q2                                              automation, cost discipline, and operating           lower interest expense; partially offset by
  2021                                                                                 leverage                                             higher foreign taxes

• Broad-based growth across key verticals                                                                                                 • Adjusted effective tax rate of 25.7% and
  and geographies                                                                                                                           28.0% in Q2 2020 and Q2 2021,
                                                                                                                                            respectively
• Favorable FX impact on revenues of less
  than $1 million

1. See appendix for a reconciliation of Adjusted EBITDA, Adjusted EBITDA Margin, and Adjusted Diluted EPS.                                                                                10
Established Track Record with COVID-19 Resiliency
Revenues1
$ in millions
COVID-19
$174.8
$156.5
$136.8 $132.1
$121.6 $123.8 $126.7
$109.7 $110.8 $105.0
Q1 '19 Q2 '19 Q3 '19 Q4 '19 Q1 '20 Q2 '20 Q3 '20 Q4 '20 Q1 '21 Q2 '21
7.8% (Full Year) 1.1% (13.7%) 10.5% 23.6% 19.2% 66.5%
Year/Year Growth (%)
• Demonstrated resiliency during COVID-19 downturn
• Deep customer relationships; focus on enterprise customers; upsell/cross-sell
• Diverse, attractive industry verticals
• Verticalized sales force driving market share gains
• UK screening business acquisition closed on March 31, 2021
1. Q1’20 is presented on a pro forma basis for the Silver Lake Transaction and the related refinancing. See appendix for pro forma reconciliation. 11Established Track Record with COVID-19 Resiliency
Adjusted EBITDA and Margin1,2
$ in millions
COVID-19
$56.3 80%
$44.6
70%
$43.3 60%
$36.6
$33.4 $33.5 $31.8 $31.7 50%
$25.1 $27.2 40%
30%
30.1% 31.6% 32.2%
27.4% 27.1% 25.1% 24.6% 28.5% 27.7% 20%
22.9% 10%
0%
Q1 '19 Q2 '19 Q3 '19 Q4 '19 Q1 '20 Q2 '20 Q3 '20 Q4 '20 Q1 '21 Q2 '21
8.4% (5.1%) 29.3% 40.3% 34.5% 77.9%
Year/Year Growth (%)
• Expanding utilization of proprietary databases and increasing automation with third-party data providers
• Technological innovations including robotic process automation initiatives
• Strong procurement team
• Leveraging existing G&A infrastructure
• Variable and flexible cost structure; reacted quickly during COVID-19 crisis
• Disciplined balance between cost efficiency and strategic investments; continuing to invest in technology and sales
while leveraging G&A costs
1. See appendix for Adjusted EBITDA and Adjusted EBITDA Margin reconciliation.
2. Q1’20 is presented on a pro forma basis for the Silver Lake Transaction and the related refinancing. See appendix for pro forma reconciliation. 12Cash Flow, Balance Sheet & Capital Allocation
CASH FLOW FROM NET LEVERAGE AT CAPITAL ALLOCATION
OPERATING ACTIVITIES JUNE 30, 2021 PRIORITIES
Pursue M&A opportunities
$ in millions • Acquisitions that are strategic, accretive, and generate
strong ROI
• Vertical expertise
$32.4
• International expansion
+ 49.2% Debt $565 • Enterprise Risk Services
• Data and/or technology
$21.7 Cash $257
Continue to invest in organic growth
• Focus on maintaining and enhancing industry
LTM Adjusted EBITDA1 $181
leadership position through technology and automation
• Continued investment in Sales, Solution
Net Leverage 1.7x Engineering, and Customer Success
• New product innovation
Q2 2020 Q2 2021 Maintain conservative leverage
• Target long-term leverage range of 2x - 3x
• No remaining mandatory quarterly principal payments
due under first lien credit facility agreement
Strong cash flow and liquidity position provides flexibility to pursue multiple growth opportunities
1. See appendix for LTM Adjusted EBITDA reconciliation; net leverage calculated as (Debt – Cash) / LTM Adjusted EBITDA 13Full Year 2021 Guidance1
Full Year 2021
20204 Guidance Y/Y % Growth
$ in millions As of 8/12/21
Revenues $509.2 $640 to $650 +26% to 28%
Adjusted EBITDA2 $146.8 $186 to $190 +27% to 29%
Adjusted Net Income2,3 $65.6 $110 to $113 +68% to 72%
Capital Expenditures
(consisting of purchases of property and equipment $17.7 $25 to $26 +41% to 47%
and capitalized software development costs)
1. Actual results may differ materially from First Advantage’s Full Year 2021 Guidance as a result of, among other things, the factors described under “Forward-Looking Statements” in this presentation.
2. A reconciliation of the foregoing guidance for the Non-GAAP metrics of Adjusted EBITDA and Adjusted Net Income to GAAP net income (loss) cannot be provided without unreasonable effort because of the inherent difficulty of accurately
forecasting the occurrence and financial impact of the various adjusting items necessary for such reconciliation that have not yet occurred, are out of our control, or cannot be reasonably predicted. For the same reasons, the Company is
unable to assess the probable significance of the unavailable information, which could have a material impact on its future GAAP financial results.
3. Assumes adjusted effective tax rate will be in the range of 26.5% to 27.5% for 2021.
4. 2020 is presented on a pro forma basis to give effect to the Silver Lake Transaction and the related refinancing as if it had occurred on January 1, 2020. See appendix for pro forma reconciliation. Capital Expenditures represents
the mathematical addition of purchases of property and equipment and capitalized software development costs for the Predecessor and Successor periods in 2020. Purchases of property and equipment for the Predecessor and 14
Successor periods was $1.0 million and $5.3 million, respectively. Capitalized software development costs for the Predecessor and Successor periods was $0.9 million and $10.5 million, respectively.Scott Staples
Chief Executive Officer Closing Remarks
15Investment Highlights
• A global leader in large, fragmented, and growing market
• Macro-economic tailwinds driving a robust hiring environment
• Differentiated and embedded technology platform that provides
mission-critical solutions in an increasingly complex market
• Verticalized go-to-market strategy drives deep, long-term
customer relationships and diversified industry exposure
• Seasoned leadership team with deep industry knowledge and
a culture of innovation
• Resilient financial model and consistent track record of strong
organic revenue growth, margin expansion, and cash flow generation
16Appendix Reconciliations to GAAP Measures
17Adjusted EBITDA
(a) Represents charges incurred related to acquisitions and similar transactions, primarily consisting of change in control-related costs, professional service fees, and other third-party costs. Additionally, the three months ended June 30, 2021 (Successor)
includes incremental professional service fees incurred related to the initial public offering.
(b) Represents charges from organizational restructuring and integration activities outside of the ordinary course of business.
(c) Represents non-cash and other charges primarily related to legal exposures inherited from legacy acquisitions, foreign currency (gains) losses, and (gains) losses on the sale of assets. Additionally, the three months ended June 30, 2020 (Successor)
includes the incremental costs incurred due to COVID-19.
18Adjusted EBITDA
(2020 Pro Forma LTM for Silver Lake Transaction)
(a) Represents charges incurred related to acquisitions and similar transactions, primarily consisting of change in control-related costs, professional service fees, and other third-party costs. Additionally, the three months ended June 30, 2021 (Successor)
includes incremental professional service fees incurred related to the initial public offering.
(b) Represents charges from organizational restructuring and integration activities outside of the ordinary course of business.
(c) Represents non-cash and other charges primarily related to legal exposures inherited from legacy acquisitions, foreign currency (gains) losses, and (gains) losses on the sale of assets. Additionally, the three months ended June 30, 2020 (Successor)
includes the incremental costs incurred due to COVID-19.
To facilitate comparability, we present the combination of consolidated results for Q1'2020, consisting of the Successor consolidated results from February 1, 2020 to March 31, 2020, the Predecessor consolidated results for the period from January 1,
2020 to January 31, 2020 and certain pro forma adjustments that give effect to the Silver Lake Transaction and the related refinancing as if it had occurred on January 1, 2020. The pro forma information above has been prepared on a basis consistent with
Article 11 of Regulation S-X, but does not constitute Article 11 pro forma information because it only presents the pro forma, reflecting the Silver Lake Transaction and the related refinancing as if they had occurred as of January 1, 2020.
19Adjusted EBITDA
(2020 Pro Forma for Silver Lake Transaction)
(a) Represents charges incurred related to acquisitions and similar transactions, primarily consisting of change in control-related costs, professional service fees, and other third-party costs. Additionally, the three months ended June 30, 2021 (Successor)
includes incremental professional service fees incurred related to the initial public offering.
(b) Represents charges from organizational restructuring and integration activities outside of the ordinary course of business.
(c) Represents non-cash and other charges primarily related to legal exposures inherited from legacy acquisitions, foreign currency (gains) losses, and (gains) losses on the sale of assets. Additionally, the three months ended June 30, 2020 (Successor)
includes the incremental costs incurred due to COVID-19.
To facilitate comparability, we present the combination of consolidated results for Q1'2020, consisting of the Successor consolidated results from February 1, 2020 to March 31, 2020, the Predecessor consolidated results for the period from January 1,
2020 to January 31, 2020 and certain pro forma adjustments that give effect to the Silver Lake Transaction and the related refinancing as if it had occurred on January 1, 2020. The pro forma information above has been prepared on a basis consistent with
Article 11 of Regulation S-X, but does not constitute Article 11 pro forma information because it only presents the pro forma, reflecting the Silver Lake Transaction and the related refinancing as if they had occurred as of January 1, 2020.
20Adjusted Net Income
(a) Represents the loss on extinguishment of debt and non-cash interest expense related to the amortization of debt issuance costs for the financing for the Silver Lake Transaction.
(b) Represents the depreciation and amortization expense related to intangible assets and developed technology assets recorded due to the application of ASC 805, Business Combinations.
(c) Represents charges incurred related to acquisitions and similar transactions, primarily consisting of change in control-related costs, professional service fees, and other third-party costs. Additionally, the three months ended June 30, 2021 (Successor)
includes incremental professional service fees incurred related to the initial public offering.
(d) Represents charges from organizational restructuring and integration activities outside of the ordinary course of business.
(e) Represents non-cash and other charges primarily related to legal exposures inherited from legacy acquisitions, foreign currency (gains) losses, and (gains) losses on the sale of assets. Additionally, the three months ended June 30, 2020 (Successor)
includes incremental costs incurred due to COVID-19.
(f) Effective tax rates of 25.7% and 28.0% have been used to compute Adjusted Net Income for the three months ended June 30, 2020 and 2021, respectively. As of December 31, 2020, we had net operating loss carryforwards of approximately $197.6
million, $166.2 million, and $36.0 million for federal, state, and foreign income tax purposes, respectively, available to reduce future income subject to income taxes. As a result, the amount of actual cash taxes we pay for federal, state, and foreign
income taxes differs significantly from the effective income tax rate computed in accordance with GAAP, and from the normalized rates shown above.
21Adjusted Net Income
(2020 Pro Forma for Silver Lake Transaction)
(a) Represents the loss on extinguishment of debt and non-cash interest expense related to the amortization of debt issuance costs for the financing for the Silver Lake Transaction.
(b) Represents the depreciation and amortization expense related to intangible assets and developed technology assets recorded due to the application of ASC 805, Business Combinations.
(c) Represents charges incurred related to acquisitions and similar transactions, primarily consisting of change in control-related costs, professional service fees, and other third-party costs. Additionally, the three months ended June 30, 2021 (Successor)
includes incremental professional service fees incurred related to the initial public offering.
(d) Represents charges from organizational restructuring and integration activities outside of the ordinary course of business.
(e) Represents non-cash and other charges primarily related to legal exposures inherited from legacy acquisitions, foreign currency (gains) losses, and (gains) losses on the sale of assets. Additionally, the three months ended June 30, 2020 (Successor)
includes incremental costs incurred due to COVID-19.
(f) Effective tax rates of 25.7% and 28.0% have been used to compute Adjusted Net Income for the three months ended June 30, 2020 and 2021, respectively. As of December 31, 2020, we had net operating loss carryforwards of approximately $197.6
million, $166.2 million, and $36.0 million for federal, state, and foreign income tax purposes, respectively, available to reduce future income subject to income taxes. As a result, the amount of actual cash taxes we pay for federal, state, and foreign
income taxes differs significantly from the effective income tax rate computed in accordance with GAAP, and from the normalized rates shown above
To facilitate comparability, we present the combination of consolidated results for Q1'2020, consisting of the Successor consolidated results from February 1, 2020 to March 31, 2020, the Predecessor consolidated results for the period from January 1,
2020 to January 31, 2020 and certain pro forma adjustments that give effect to the Silver Lake Transaction and the related refinancing as if it had occurred on January 1, 2020. The pro forma information above has been prepared on a basis consistent with
Article 11 of Regulation S-X, but does not constitute Article 11 pro forma information because it only presents the pro forma, reflecting the Silver Lake Transaction and the related refinancing as if they had occurred as of January 1, 2020.
22Adjusted Diluted EPS
(a) Represents the loss on extinguishment of debt and non-cash interest expense related to the amortization of debt issuance costs for the financing for the Silver Lake Transaction.
(b) Represents the depreciation and amortization expense related to intangible assets and developed technology assets recorded due to the application of ASC 805, Business Combinations.
(c) Represents charges incurred related to acquisitions and similar transactions, primarily consisting of change in control-related costs, professional service fees, and other third-party costs. Additionally, the three months ended June 30, 2021 (Successor)
includes incremental professional service fees incurred related to the initial public offering.
(d) Represents charges from organizational restructuring and integration activities outside of the ordinary course of business.
(e) Represents non-cash and other charges primarily related to legal exposures inherited from legacy acquisitions, foreign currency (gains) losses, and (gains) losses on the sale of assets. Additionally, the three months ended June 30, 2020 (Successor)
includes incremental costs incurred due to COVID-19.
(f) Effective tax rates of 25.7% and 28.0% have been used to compute Adjusted Net Income for 2020 and the three months ended June 30, 2021, respectively. As of December 31, 2020, we had net operating loss carryforwards of approximately $197.6
million, $166.2 million, and $36.0 million for federal, state, and foreign income tax purposes, respectively, available to reduce future income subject to income taxes. As a result, the amount of actual cash taxes we pay for federal, state, and foreign income
taxes differs significantly from the effective income tax rate computed in accordance with GAAP, and from the normalized rate shown above.
23You can also read