Half Year Results 2021 - 19th August 2021
←
→
Page content transcription
If your browser does not render page correctly, please read the page content below

Half Year
Results 2021
19th August 2021

                   1
Strong recovery and positioned to accelerate growth
           Revenue1                             EBITDA2                              EBIT2    NPAT2         3.5c
                                                                                                                             NET CASH
           $110m                              $30.4m                             $23.7m      $14.5m    Fully Franked
            +21%                               +55%                              +139%       +504%                            $122m
                                                                                                         Dividend

•   Opportunities to grow scale, multi-platform content creation and build data capabilities in consolidating market
•   Investing to strengthen core broadcast radio and digital audio business
•   Soprano sale process progressing well; Binding SSA expected to be executed shortly
•   Sale of Soprano unlocks significant shareholder value; HT&E shareholding valued at ~$139m
•   Link shares held in escrow for 6 months after which HT&E permitted to dispose of all its shares via off market block trade or sell down a maximum of
    3 million share per month on market
•   Advertising markets strengthening in Aus and HK
•   Radio listenership experiencing continued growth; Increasing migration to digital live streaming
•   No. 1 metropolitan network; No. 1 podcast publisher
•   Winning commercial share; Digital revenues ahead of expectations (+149%)
•   Investment in people/culture to drive digital transformation

            (1)   On a like basis, excluding disposed businesses (iNC & The Roar) in 2020
            (2)   Before exceptional items
Financial Results

Statutory results
• Like basis comparatives remove the impacts of sold businesses; JobKeeper     A$ million
                                                                                                                             2021        2020
                                                                                                                         Reported    Reported
  excluded from underlying historical EBITDA
                                                                               Revenue before finance income                109.9        93.0

                                                                               Other income                                   0.4         1.3
• Revenue up $16.9m (18%); 21% on a like basis
                                                                               Share of associate profits                     4.4         2.6

   - Consumer confidence and ad spend returning in AU & HK                     Costs                                        (84.4)      (77.4)

                                                                               Underlying   EBITDA1                          30.4        19.5
• Costs up $7.0m (9%); $9.4m (12%) on a like basis                             Depreciation and amortisation                 (6.7)       (9.6)

                                                                               Underlying EBIT2                              23.7         9.9
   - Higher cost of sales on improved revenues                                 Net interest expense                          (1.8)       (1.8)

                                                                               Net profit before tax1                        21.9         8.1
   - One-off cost control measures impacting FY20 comparative (predominately
                                                                               Taxation on net profit                        (5.6)       (4.5)
     marketing & discretionary opex)
                                                                               Net profit after tax (NPAT)1                  16.3         3.6

                                                                               Less non-controlling interest                 (1.8)       (1.2)
• Underlying EBITDA up $10.9m (55%)
                                                                               NPAT attributable to HT&E shareholders1       14.5         2.4

• Effective tax rate on underlying AU operations unchanged at ~29%             Exceptional items net of tax                  (4.4)        2.7

                                                                               Impairment of intangible assets                  –       (64.3)
• Exceptional items include $4m increase to provisions for uncertain tax       NPAT attributable to HT&E shareholders        10.2       (59.3)
  treatments                                                                   Underlying EPS (cps) 1                         5.2         0.9

                                                                               Interim dividend per share (cps)                3.5          –
• Underlying NPAT up $14.5m (>500%)
                                                                                 (1)   Before exceptional items
ARN - consolidated
• Radio revenue up 19%, broadly in-line with the market (+20.2%)     A$ million                 2021     2020     % Change    % change
                                                                                                                               Excl iNC
                                                                                                                               and The
  - Digital audio revenues up 149% on a like basis                                                                                Roar

                                                                     Radio                       93.0     78.3         19%          19%
  - Meaningful growth in podcasting and streaming revenues
                                                                     Digital                      5.5      4.8         15%        149%
• Total costs up 13% on a like basis
                                                                     Total revenue               98.5     83.1         19%         22%

  - Costs of sales growth on higher revenues, including increasing   Income                         –      0.7       (100%)      (100%)
    contribution from digital revenues at lower margin               Total revenue and income    98.5     83.8         18%         21%

  - People costs up 5% - investment in digital capability and        Cost of sales              (17.8)   (14.7)        21%          39%
    impact of reinstating FY20 temporary cost savings                People costs               (41.2)   (39.7)         4%           5%

  - Operating costs up 13% – reinstatement of FY20 temporary         Operating costs            (13.4)   (11.9)        12%          13%
    cost savings (marketing and T&E expenditure)                     Total costs                (72.4)   (66.3)         9%         13%

• EBITDA up 57% on last year on a like basis                         Share of associates NPAT     2.0      0.6        245%        245%

                                                                     EBITDA                      28.1     18.1         55%         57%
• Perth JV (Nova 93.7) accounted as an associate for part of 2020;
  2020 partially included in Income                                  D&A                         (3.1)    (3.4)       (10%)       (10%)

                                                                     EBIT                        25.0     14.7         71%         73%

                                                                     EBITDA margin               29%      22%
ARN – split out
•    Radio fundamentals remain robust, with sustained cost                                                                     Excl disp businesses
                                                                   A$ million                 2021      2020        % Change
                                                                                                                                 2020      % Change
     management focus delivering improved margin
                                                                   Revenue
       - Cost of sale growth on substantially higher revenues      Radio                       93.0      78.3           19%     78.3           19%
                                                                   Digital                      5.5       4.8           15%      2.2          149%
       - No underlying cost base change, only impact of            Costs
         reinstating FY20 temporary cost savings                   Radio                      (64.7)    (59.5)           9%     (59.5)          9%
                                                                   Digital                     (7.6)     (6.8)          12%      (4.4)         72%
       - People and operating costs remain below H119 levels       Income / share NPAT
                                                                   Radio                        2.0       1.3           51%       1.3          51%
•    Digital audio growth                                          EBITDA
                                                                   Radio                       30.2      20.1           51%     20.1           51%
       - +80% CAGR since FY19; now consistently writing >$1m rev   Digital                     (2.1)     (2.0)          (6%)    (2.2)          (4%)
         p/month                                                   EBITDA margin
                                                                   Radio                         33%       26%
       - iHeartMedia partnership enabling fast learning            Digital                       n/m       n/m

•    Further investment in digital

       - Podcast advertising lagging consumer demand / listening                 Digital Audio revenues ($m)
                                                                   8.0
       - Commenced investment in ARN original content              7.0
                                                                   6.0
       - Core team capability now embedded; further scaling of     5.0
         commercial team underway in H221                          4.0                                                         +80% CAGR
                                                                   3.0
                                                                   2.0
                                                                   1.0
                                                                    -
                                                                                2019          2020               2021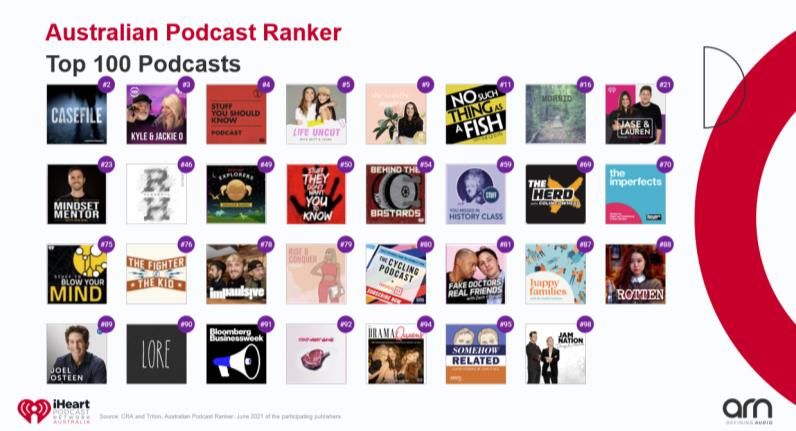
Cody Outdoor - HK
• Revenue up 28% (local currency basis) with advertiser confidence
                                                                                                                                 Local currency
  returning across a variety of sectors, including Banking & Finance and     A$ million              2021    2020     % change        % change
  Property
                                                                             Roadside                 5.5      5.6        (1%)             16%
  - Roadside up 16%1 with most contracts and non-exclusive sites up          Transit                  2.9      2.1        37%              60%
    on higher occupancy and yield
                                                                             Total revenue            8.5      7.7         9%              28%

  - Transit up 60%1, mainly increased demand for Tram Shelter (Transit)      Total costs             (4.2)    (4.3)       (2%)             15%
    sites with improved occupancy of 51% (H1 20: 28%)
                                                                             EBITDA                   4.3      3.5        23%              44%

• Mobility levels significantly improved; low infection rates and over 50%   D&A                     (0.0)    (0.0)      (15%)              0%
  of the population vaccinated (1st jab)
                                                                             Depreciation – Leases   (3.5)    (6.1)      (42%)            (32%)

• Total costs up 15%1; comprising cost of sale increases on higher           EBIT                     0.7    (2.7)      >100%           >100%
  revenues
                                                                             EBIT margin              8%     (34%)

• Lower lease depreciation due to part impairment of advertising
  concession lease assets at June 2020

• Successfully tendered / retained several smaller tunnel contracts,
  including Tate Cairns and Tai Lam Tunnels

            (1)   On a local currency basis
Group balance sheet                                                            A$ million
                                                                                                                   Reported

                                                                                                                   Jun 2021
                                                                                                                              Reported

                                                                                                                              Dec 2020
                                                                                                                                         Change

                                                                                                                                              $
• Strong net cash position of $122.4m                                          Cash and cash equivalents (incl
                                                                                                                      126.7      115.1     11.6
                                                                               deposits)

• Deposit of tax in dispute on Branch matter:                                  Receivables                             49.1       43.9      5.1

                                                                               Income tax receivable                    3.3        1.6      1.8
      –   Includes $51m deposit offset by $30.5m tax provision                 Other current assets                     2.9        3.5     (0.5)

                                                                               Asset held for sale                     22.2          –     22.2
      –   Reduced by interest deductions ($18.4m) processed through tax
          returns and provision for H1 2021; would be repaid on a successful   Property, plant & equipment             18.9       19.1     (0.1)

          outcome of matter                                                    Right-of-use assets                     26.4       31.2     (4.7)

                                                                               Intangible assets                      373.1      373.9     (0.8)
• Significant remaining balance sheet movements:
                                                                               Deposit of tax in dispute, net of
                                                                                                                        1.8        3.9     (2.1)
                                                                               provision
      –   Higher net working capital on improved trading                       Other non-current assets                83.4      102.3    (18.8)

                                                                               Total assets                           707.9      694.4     13.5
      –   Investment in Soprano reclassed to Asset held for sale from Other
          non-current assets                                                   Payables                                24.4       21.5      2.9

                                                                               Other current liabilities               16.6        9.4      7.3
      –   $3.5m tax provision recognised for historical loan forgiveness tax   Bank loans                               4.3        2.9      1.4
          matter included in Other current liabilities
                                                                               Lease liabilities                       36.8       43.6     (6.8)

      –   Decrease in right of use assets and lease liabilities in-line with   Deferred tax liabilities               120.8      120.0      0.8
          remaining contract tenure on advertising contracts in Cody           Other non-current liabilities            3.8        4.8     (0.9)

                                                                               Total liabilities                      206.7      202.1      4.6

                                                                               Net assets                             501.2      492.2      8.9
Group cash flow
Operating cash inflow of $14.5m, impacted by:
                                                        A$ million                                                      Jun 2021    Jun 2020

                                                        EBITDA                                                              30.4        19.5
 • Significantly higher earnings, EBITDA up 55%,
                                                        Net change in working capital, non-cash and exceptional items       (1.6)        7.8

 • Non-cash share of NPAT $4m, (Soprano & Perth JV)     Net interest paid                                                   (1.7)       (1.5)

                                                        Net tax amounts paid                                                (5.6)       (6.8)
Areas to note in the prior year cashflow:               Net operating cash flow before lease payments                       21.4        19.0

                                                        Lease payments (principal)                                          (6.9)       (7.5)
 • Included $8.4m working capital benefit on reduced    Net operating cash flow after lease payments                        14.5        11.5
   revenues, which largely reversed in H220             Capital expenditure                                                 (1.5)       (1.2)

                                                        Investments                                                            –       (18.1)
 • $18.1m investment in oOh!media
                                                        Cash received from associates and other entities                     2.3         1.0

                                                        Net cash flow before financing                                      15.3        (6.7)
 • Payment of final FY19 dividend in March 2020
                                                        Payments for treasury shares                                        (0.0)       (0.3)

 Ongoing share buy-back executed at avg. $1.70 in the   Dividends paid to shareholders                                         –       (12.8)

 period                                                 Share buy back                                                      (3.0)       (0.5)
                                                        Payments to non-controlling interests                               (1.9)       (1.1)
                                                        Net cash flow before debt items                                     10.4      (21.5)

                                                        Net proceeds of borrowing                                            1.3         0.6

                                                        Net cash flow                                                       11.6      (20.9)
Operational Update
Ratings dominance                                                                                        19

•   Radio listening increasing despite lockdowns
                                                                                                         17

      –   11m weekly listeners to commercial radio
                                                                                                         15

      –   1m+ growth in listeners across the past 5 years (+9.8%)
                                                                                                         13

• ARN stations achieved 13 consecutive surveys as #1 network share
  overall; Reaching over 5.3m listeners a week                                                           11

• Kyle & Jackie O achieve No. 1 overall AM/FM breakfast share in                                         9

  Sydney for 1st time ; 20 consecutive surveys No.1 FM
                                                                                                         7

• On-air talent connection with audiences is authentic and trusted;
  an engaging environment for advertisers                                                                5
                                                                                                               s4   s5   s6   s7   s8   s1   s2   s6   s7   s8   s1   s2   s3   s4
                                                                                                              2019 2019 2019 2019 2019 2020 2020 2020 2020 2020 2021 2021 2021 2021
• Gold 104.3 No. 1 FM station in Melbourne for 12 consecutive
  surveys

• Christian O’Connell show No. 1 FM breakfast share; 9 consecutive
  surveys

          Source: GfK, Survey 6 2018 – Survey 4 2021, P10+, Sun-Sat 0530-2359, SMBAP, excl DAB+, Share
Digital live radio streaming
growing rapidly
2,013,000
2,393,000
Total Radio
• Almost 2.4 million unique people actively listen to commercial Streaming
radio via mobile, smart phone or PC/tablet each week (+19%) Listeners +18.8%
• Accelerated uptake of live streaming options
– Mobile +5%
– Tablets/PC +20%
– Smart Speakers +51%
Streaming radio via mobile
# of listeners +5%
• 7.7m total listening hours of streamed radio across all platforms
including iHeartRadio (+15%)
Streaming radio via tablet/PC
• Smart Speakers account for 35% of ARN’s live radio digital # of listeners +20%
listening
• Digital live streaming of radio offers future advertising benefits
and targetability Streaming radio via smart speaker
# of listeners +51%
Source: GfK Radio Ratings S4 2021 (vs S4 2019), SMBAP, Mon-Sun 12mn-12mn, P10+ & P25-54, Cume, TSL. Streaming is listening via mobile phone,
smart speaker and PC/tablet. Commercial stations only. Note: Other refers to the device's listeners can’t identify when listening to the radio
Adswizz Audiometrix, Jun 21 vs Jun 20Podcasts opening up new
opportunity
• Continued growth of weekly podcast consumption (+53% YOY)
• 37% of the population listen to podcasts monthly
• ARN No. 1 podcast publisher; 5 of the top 10 podcasts
• New digital audio formats are expanding audio consumption and are
complementary to Radio
• Growing podcast commercialisation opportunity
• Advertising intent is lagging consumption - 37% of population listening v 24%
agencies considering as part of media mix
• ARN investing to unlock further digital revenues by investing in -
– Content creation and audience growth
– Making podcasting easier to buy
– Build confidence in measurement and attribution
– Hiring sales capability to target digital revenues
Source: Edison Research – The Infinite Dial 2021 Australia | IAB State of the Nation 2021
CRA and Triton, Australian Podcast Ranker: July 2021 of the participating publishers.
*Combines ARN/iHeartMedia with Audioboom.Most complete destination for digital audio in Australia
• Creating the best digital audio experience for audiences
and the most comprehensive solutions for advertisers
• Launched 7 years ago
• 86% of people want their content in a centralised, and
easy-to-navigate location
More than
• Radio, Music & Podcasts – all in one place
GAME CONSOLES
1 million 2 million doubled in the
monthly unique Registered last two years
IN-CAR DASH
Backed by global expertise
+53%
• listeners to users
iHeartRadio (+16% YOY)
SMARTPHONES
– Experience - Improved features & functionality
creating more seamless access to content SMART SPEAKERS
– Personalisation - Using advanced AI to surface SMART TVS
more tailored content that gets you Artist/Favourites Radio
13%
TABLETS
Share of
– Technology - Adobe Ad Manager Integration Podcast
enabling bespoke audience segment targeting WEARABLES Listening Hours 20%
June 2021 Live Radio
67%
• Fast-tracking Australian content and platform strategies
with confidence
2,000+ devices
Source: Adobe Analytics, July 2021Building best-in-class broadcast radio and digital audio business
Growing audiences offering multi-platform content, increased scale through distribution, and delivering innovative, digitally enabled
commercial solutions and partnerships.
NETWORKS
BROADCAST RADIO AND DAB+
18-25 yrs 25-44 yrs 40-54 yrs
ON-AIR TALENT
PODCASTINGAdvertising revenue growth set to continue
• Total Radio market grew +20% in H1 2021 (-4% Q1, +54% Q2)
• 2 tier recovery; Agency market +28% (>70% of total market)
Total Market $328m +20%
Agency $240m +28%
Direct $88m +3.3%
Interstate market has been included as Agency
Cancellations by week
• SME market slower to recover - represents future growth
opportunity when lockdowns end
• Key categories in growth including Retail and Government
• Recent lockdowns not resulting in significant cancellations
• Positive advertiser sentiment despite lockdowns
WK 1 WK 2 WK 3 WK 4 WK 5 WK 6 WK 7 WK 8 WK 9 WK 10 WK 11 WK 12
Source: SMI, July 2021 Note: Wk 1; 2020 - 16 March; Wk 1 2021 - 27 May 2020 2021
ARN Commercial Finance Q1 – 2020 – Q1-2021Trading Update
ARN
• In July, ARN revenues grew +19% on the prior comparative period. August has seen a slight easing of bookings but pacing suggests a similar
result for the month
• Extended lockdowns, particularly in Sydney and Melbourne, may impact FY21 performance mainly due to some uncertainty of the SME market
however, forward bookings for the remainder of the year are currently tracking well ahead of STLY with briefing activity remaining positive
• Recent digital revenue performance has continued into Q3, with average monthly revenues for the quarter pacing to finish in excess of $1m per
month
• Investments in the launch of a new breakfast show in Melbourne; the implementation of original podcast content creation strategy, increased
digital commercial capability and a relaunch of ‘The Edge’ will see total people and operating costs for FY21 now expected to finish ~$2-3m
above FY19 levels(1)
Cody
• Improved mobility levels, low infection rates and a strong vaccination program are driving consumer confidence and a return of advertising
spend in Hong Kong
• Trading conditions continue to improve with July revenues finishing +56% on the prior comparative period. Should current COVID settings be
maintained, forward bookings suggest a continuation of this trend for the remainder of Q3.
(1) Before costs associated with disposed businesses (iNC & The Roar) in 2019 ($3.6m)HT&E Limited / ABN 95 008 637 643
Disclaimer
HT&E Limited (HT&E) does not accept any liability to any person, organisation or company for any loss or damage suffered as a result of reliance
on this document. All statements other than statements of historical fact are, or may be deemed to be, forward-looking statements, and are
subject to variation. All forward-looking statements in this document reflect the current expectations of HT&E concerning future results and events.

Any forward-looking statements contained or implied, either within this document or verbally, involve known and unknown risks, uncertainties and
other factors (including economic and market conditions, changes in operating conditions, currency fluctuations, political events, labour relations,
availability and cost of labour, material and equipment) that may cause HT&E’s actual results, performance or achievements to differ materially
from the anticipated results, performance or achievements, expressed, projected or implied by any forward-looking statements.

HT&E uses certain measures to manage and report on its business that are not recognised under Australian Accounting Standards. These
measures are collectively referred to as “non-IFRS financial measures” and include EBITDA before exceptional items, EBIT before exceptional items
and net profit before exceptional items.

Figures, amounts, percentages, prices, estimates, calculations of value and fractions in this presentation are subject to the effect of rounding.
Accordingly, the actual calculation of these figures may differ from the figures set out in this presentation.
Appendices
Reconciliation of segment result to statutory result
                                           Segment result            Exceptional items             Statutory result

A$ million                               2021               2020     2021                2020    2021                 2020

Revenue before finance income            109.9               93.0       –                   –    109.9                 93.0

Other income                               0.4                1.3       –                 4.9      0.4                  6.2

Share of associate profits                 4.4                2.6       –                   –      4.4                  2.6

Costs                                    (84.4)             (77.4)   (0.6)           (66.3)      (84.9)           (143.7)

Underlying EBITDA                         30.4               19.5    (0.6)           (61.4)       29.8                (41.9)

Depreciation and amortisation             (2.0)              (2.2)      –                   –     (2.0)                (2.2)

Depreciation – Leases                     (4.7)              (7.4)      –                   –     (4.7)                (7.4)

Underlying EBIT                           23.7                9.9    (0.6)           (61.4)       23.1                (51.5)

Net interest                              (1.0)              (0.7)      –                   –     (1.0)                (0.7)

Finance cost – Leases                     (0.8)              (1.2)      –                   –     (0.8)                (1.2)

Net profit before tax                     21.9                8.1    (0.6)           (61.4)      (21.3)               (53.3)

Taxation on net profit                    (5.6)              (4.5)   (3.8)               (0.1)    (9.4)                (4.6)

Net profit after tax (NPAT)               16.3                3.6    (4.4)           (61.6)       11.9                (57.9)

Less non-controlling interest             (1.8)              (1.2)      –                (0.1)    (1.8)                (1.3)

NPAT attributable to HT&E shareholders    14.5                2.4    (4.4)           (61.7)       10.2                (59.3)
Exceptional items
• Current year includes: A$ million Jun 2021 Jun 2020
Software (SaaS) implementation costs
• One-off SaaS implementation costs (CRM & Payroll) (0.6) –
Impairment – Goodwill (ARN and HK) – (54.2)
• $0.5m increase to the Branch matter tax provision
Impairment – Right-of-use assets (HK) – (7.1)
• $3.5m provision for uncertain tax treatment relating to the
APN Outdoor matter Associate impairment – Nova Perth – (4.4)
Redundancies – (0.4)
• Prior year includes:
Reclassification of foreign currency translation reserve – (0.4)
• Non-cash impairments totalling $65.7m
Government subsidies and grants – 4.9
• Government subsidies include JobKeeper and Hong Kong
Government Employment Support Scheme subsidy Onerous contract provision adjustment (Unbnd) – 0.6
Loss on sale of The Roar – (0.3)
Exceptional items, gross of tax (0.6) (61.4)
Income tax expense on exceptional items 0.2 (0.1)
Tax provision estimate – Branch matter (0.5) –
Tax provision estimate – APN Outdoor matter (3.5) –
Exceptional items, net of tax (4.4) (61.6)HT&E Corporate
• Corporate costs up 21%, but in-line with normal run-rate A$ million 2021 2020 % change
- FY20 incentives forgone as part of COVID-19 response. Salary and wages 1.6 1.7 (2%)
- FY20 Board costs benefiting from reductions as part of Incentives provided for 1.2 0.0 >100%
COVID-19 response
Board costs 0.4 0.3 6%
- Tax dispute costs reflect a reduced level of legal preparation
Compliance and advisor costs 0.6 0.6 (4%)
activities on ATO Branch dispute
Tax dispute costs 0.3 0.4 (30%)
Overheads (rent, office, other) 0.9 1.0 (9%)
Total Corporate costs 5.0 4.1 21%Cash flow – working capital
A$ million Jun 2021 Jun 2020
Net changes in working capital 2.4 8.4
Deduct non-cash items, share of associates NPAT net of cash /
(4.0) (3.1)
dividends from investments
Recurring (1.6) 5.4
Redundancies – (0.4)
Costs associated with diposal of The Roar – (0.4)
JobKeeper (and other COVID-19 related subsidies) – 3.2
Non-recurring – (2.4)
Net change in working capital, non-cash and exceptional items (1.6) 7.8
Currency rates
AUD / HKD
2021 2020
June half year average 5.986 5.107
Period end rate – June 5.823 5.351
Period end rate – Dec – 5.964AASB 16 Leases – 2021
AASB 16
AASB 16 AASB 16 Result
Leases
Reported Leases Leases without
A$ million Adjustment
2021 Adjustment Adjustment adoption of
Digital
ARN HK Outdoor AASB 16
Investments
ARN 28.1 (1.7) – – 26.4
HK Outdoor 4.3 – (4.4)2 – (0.1)
Digital Investments 3.0 – – (0.1) 2.9
Corporate (5.0) – – – (5.0)
Underlying EBITDA1 30.4 (1.7) (4.4) (0.1) 24.1
Depreciation and amortisation (6.7) 1.2 3.5 0.1 (2.0)
Underlying EBIT1 23.7 (0.6) (0.9) (0.0) 22.2
Net interest (1.8) 0.5 0.3 0.0 (1.0)
Net profit before tax1 21.9 (0.1) (0.6) (0.0) 21.2
(1) Before exceptional items
(2) Inclusive of onerous contract provision releaseAASB 16 Leases – 2020
AASB 16
AASB 16 AASB 16 AASB 16 Result
Leases
Reported Leases Leases Leases without
A$ million Adjustment
2020 Adjustment Adjustment Adjustment adoption of
Digital
ARN HK Outdoor Corporate AASB 16
Investments
ARN 18.1 (1.7) – – – 16.4
HK Outdoor 3.5 – (6.8) – – (3.4)
Digital Investments 2.1 – – (0.1) – 2.0
Corporate (4.1) – – – (0.1) (4.2)
Underlying EBITDA1 19.5 (1.7) (6.8) (0.1) (0.1) 10.9
Depreciation and amortisation (9.6) 1.3 6.1 0.1 0.0 (2,2)
Underlying EBIT1 9.9 (0.4) (0.7) (0.0) (0.1) 8.6
Net interest (1.8) 0.6 0.6 0.0 0.0 (0.7)
Net profit before tax1 8.1 0.2 (0.2) 0.0 (0.1) 8.0
(1) Before exceptional itemsYou can also read