Dalata Hotel Group -April 2017 - ISE: DHG LSE: DAL
←
→
Page content transcription
If your browser does not render page correctly, please read the page content below
Dalata Hotel Group – April 2017 ISE: DHG LSE: DAL
Disclaimer

 The presentation contains forward looking statements. These statements have been made by the Directors in
 good faith based on the information available to them up to the time of their approval of this presentation.

 Due to inherent uncertainties, including both economic and business risk factors underlying such forward
 looking information, actual results may differ materially from those expressed or implied by these forward
 looking statements. The Directors undertake no obligation to update any forward looking statements
 contained in this presentation, whether as a result of new information, future events or otherwise.

                                                                                                                Page 2
Contents

      Overview

      2016 Financial Performance

      Business Review

      Growth Strategy

      Appendices

                                   Page 3
Key Messages
Very strong operational performance in 2016
Outperformed competition in terms of RevPAR growth
Converted additional sales very strongly to the bottom line
Strong performance is delivered by the Dalata business model
Decentralised approach
Importance of developing our own people
Targeted refurbishment programme
Significant pipeline of over 1,200 rooms on target to open in 2018
Very exciting growth opportunity in the UK supported by a strong balance sheet
Page 4
Dalata | 3 Core Business Segments

         Dublin
         14 Hotels
         3,699 Rooms
         2016 RevPar: € 91.83(+20%)
                                      52% 56% 48%
                                      Group Revenue   Segment EBITDA   EBITDAR Margin

         Regional Ireland
         12 Hotels
         1,637 Rooms
         2016 RevPar: € 63.68(+12%)
                                      24% 17% 26%
                                      Group Revenue   Segment EBITDA   EBITDAR Margin

         UK
         8 Hotels
         1,768 Rooms
         2016 RevPar: £ 59.70(+4%)
                                      23% 24% 39%
                                      Group Revenue   Segment EBITDA   EBITDAR Margin

         Management Fees                   1%              3%
                                      Group Revenue   Segment EBITDA
                                                                                Page 5
2016 Financial Performance ISE: DHG LSE: DAL
Dalata | Driving Sustained Strong Performance in 2016

      RevPAR              Revenue             Adjusted EBITDA    Adjusted Diluted EPS
                    €m                  €m                       €
100                                     120                     0.50
                    340
                                                                0.45
         +15%               +29%        110         +36%                  +7%
                    320                                         0.40
90                                      100
                                                                0.35
                    300
                                        90
                                                                0.30
                    280
80                                      80                      0.25

                    260                                         0.20
                                        70
                                                                0.15
70                  240                 60
                                                                0.10
                    220                 50                      0.05

60                  200                 40                      0.00
                                                                               EPS
      2015   2016         2015   2016            2015   2016            2015      2016

                                                                                     Page 7
Dalata | Adjusted EBITDA Bridge
 €m
 100                                               11.8       2.6
                                                                         1.3        2.3       0.9           85.1
  90
                                         3.8
  80                          2.5
                   11.5
  70    62.6
  60

  50

  40

  30

  20

  10

   0

  Strong conversion of additional revenue on a ‘like for like’ basis to EBITDAR across all three regions:
        Dublin                     78.2%
        Regional Ireland           73.3%
        UK                         73.8%

  Overall Segment EBITDAR % increases from 39.5% to 41.4% as a result

                                                                                                                   Page 8
Dalata | RevPAR Outperformance in 2016
19.9%
19.1%
16.1% 16.4%
13.3% 13.3%
11.2%
10.7%
8.7% 9.1%
5.8% 5.7%
3.7%
-1.1% -0.9%
-3.1%
Dublin Galway Limerick Cork Leeds Manchester Cardiff London
Dalata Market
Strong performance versus market in Dublin, Galway, Limerick and Regional UK cities
In line with market in Cork because of impact of significant refurbishment works at Clayton Hotel Silver
Springs
London negatively impacted by refurbishment in first half of year at Clayton Hotel Chiswick
Page 9Dalata | Strong Balance Sheet providing covenant for growth
€M 31 Dec 31 Dec Increase in tangible assets reflects:
2016 2015 ─ €133.2m in acquisitions during the year
─ €66.6m net revaluation gain
Non-current assets ─ €28.5m capex on existing hotels and new developments
Tangible fixed assets 825.7 646.1 ─ Counterbalanced by €15.5m depreciation and €33.3m
translation adjustment due to fall in sterling
Goodwill and 54.3 46.8
intangibles Goodwill and intangibles up by €7.5m following
Other 6.6 6.2 acquisition of the Gibson Hotel leasehold (€20.5m) offset
by goodwill impairment (€10.3m) following revaluation
Current assets uplifts and translation adjustments of €2.7m
Trade receivables, 17.7 13.1
inventory and other £174.4m (€203.6m) of borrowings in sterling as a natural
hedge against value of sterling assets and sterling
Cash 81.1 149.1 denominated earnings. Undrawn facilities of €52.2m at
Total assets 985.4 861.3 year end
Increase in Net Debt to Adjusted EBITDA to 2.40x from
Equity 620.4 537.3 1.63x due to development and acquisition activity. Will
increase until mid-2018 when development pipeline is
Bank loans 280.4 266.1 completed. Target to remain at 3.5x or below
Trade and other payables 53.1 41.2
Objective is to maintain a strong balance sheet with
Non current liabilities 31.5 16.7 appropriate level of gearing, leading to a strong covenant
Total equity and liabilities 985.4 861.3 for potential landlords/investors
Page 10Overview of Hotel Markets ISE: DHG LSE: DAL
Dalata | Market Review – Dublin

  Savills forecast net additional 3,680 rooms by 2019
                                                                                      2015             2016               2017              2018
                                                                Dublin
                                                                                      Actual           Actual             F’cast            F’cast
  2500
                                                        2,000
  2000                                                          Occupancy             82.1%            82.5%             83.0%              83.8%
                                    1,500
  1500                                                          ARR                   111.96           129.27             138.1             147.1

  1000
                                                                RevPAR                91.88            106.63            114.70             123.2
  500            180
                                                                RevPAR %
     0                                                                                22.9%            16.1%              7.6%               7.4%
                                                                Variance
                2017                 2018               2019
                                                                Sources: 2015 & 2016 Actuals per STR Global; 2017 & 2018 PwC Econometric Forecasts

         Total market size of circa 19,000 rooms

         Significant number of rooms expected to open towards the end of 2018

         New rooms predicted for 2019 subject to doubt due to two primary reasons – planning and funding

         Demand remains strong due to continued economic growth and increased visitor numbers

         6.5% RevPAR growth in Q1 2017

                                                                                                                                                Page 12
Dalata | Market Review – Regional Ireland and UK
Continuing strong demand from FTIs, domestic corporate
and domestic leisure customers RevPar Growth 2015 2016 Q1 2017
No increases in supply and very little supply pipeline
Strong start to 2017 for all three cities – Galway impacted Cork 9.6% 13.3% 8.4%
by timing of Easter Galway 13.3% 10.7% 3.7%
Limerick 23.4% 16.4% 11.6%
Source: Trending.ie
London had very difficult first half 2016 due to
combination of impact of European terrorist attacks and RevPar Growth 2015 2016 Q1 2017
increased supply. City ended 2016 stronger and also
very strong start to 2017 London 1.2% -0.9% 11.3%
Belfast had very strong second half, helped by re-
Manchester 7.5% 5.7% 2.1%
opening of Waterfront Conference Centre. That has
carried into Q1 2017 Cardiff 14.2% -1.1% 4.2%
Cardiff impacted by having Rugby World Cup in 2015 8.1% 3.7% 1.8%
Leeds
Manchester and Leeds continue to perform strongly
Belfast 11.9% 9.0% 24.5%
Source: STR Global
Page 13Business Review
Building a Leading Hotel Owner/ Operator

                                                         Number Owned & Leased Rooms
    Leading hotel owner and operator in Ireland & UK             and Hotels
    with 34 leased/owned hotels
                                                         8,000                                                40
                                                                                                     34
                                                         7,000                                                35
    24 owned, 10 leased and 7 managed hotels under
    two core brands                                      6,000                         27                     30
                                                         5,000                                                25
    Proven, experienced management team with a
    strong decentralised structure
                                                         4,000               15                               20
                                                         3,000
                                                                 12                                           15
    New platform with best-in-class operating systems    2,000                                                10
    and processes
                                                         1,000                                                5
    Strong balance sheet covenant established for next      0                                                 0
                                                                 2013       2014       2015         2016
    phase of growth
                                                                        Room numbers    Number of hotels

                                                                                                           Page 15
Dalata | “The Difference with Dalata”
Our decentralised operational approach
Dalata’s decentralised structure is core to our management philosophy
Hotel General Managers are critical players – we continually develop them
A strong multi-functional team at the centre setting direction, seeking growth opportunities,
supporting the hotels, and reporting to our stakeholders
We grow our own – training and development a major focus as there is a need to have a strong pipeline
of key people coming through
Having people we know taking up key roles de-risks our business
We focus on what we are good at
Operating 3 star and 4 star modern well-maintained hotels in cities with strong mix of corporate and
leisure demand
Executing transactions to grow our owned and leased portfolio
Identifying strong locations and developing new hotels on them
Decentralised revenue management -our revenue managers are informed by systems but always make
the decisions themselves
Investing in systems to support our approach to cost control
Owner/Operator Model
Control of our brand standards
Security of tenure allows us to build a central team to effectively support and scale our decentralised
structure
Page 16Difference with Dalata at Clayton Dublin Airport
Currently 469 rooms Revenue has increased by 37% in 2 years
Installed Dalata General Manager who in EBITDAR up 65% in same period
turn built up a new team
Customer satisfaction ratings continue to
Refurbishment of 160 rooms improve
Rebranded to Clayton, reclassified to 4 star
Introduced Dalata revenue management
approach
Increased level of ‘owned’ business KPIs 2014 2016
from 14% to 32% in 3 years Occupancy 82.7% 87.7%
Renegotiated price levels on
unprofitable ‘Tour Group’ business. Average Room Rate (€) 69.71 97.52
Brought an intensity to maximizing
revenue every day RevPAR (€) 57.67 85.51
Introduction of Alkimii Team system has Total Revenue 16,524 22,636
helped control payroll cost – payroll cost % EBITDAR 6,829 11,270
down from 26.3% in 2014 to 22.4% in 2016
EBITDAR % 41.3% 49.8%
Construction commences in May on a 140 bedroom extension at cost of
€15m which is projected to deliver additional €2m in EBITDAR
Page 17Drive Portfolio Growth | Over 1,200 new rooms by end 2018
Property New Extension Rooms Planning Construction Completion
Dublin
Lodged Granted Started
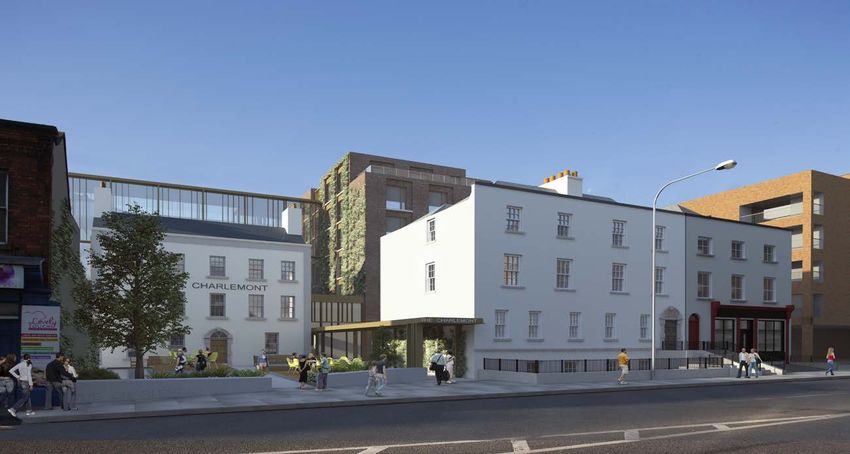
2 New Hotels Clayton Hotel Charlemont x 180 x x Q3 2018
3 Extensions Maldron Hotel Kevin Street x 138 x x Mid 2018
Clayton Hotel Ballsbridge x 30 x Mid 2018
543 rooms Clayton Hotel Dublin Airport x 140 x Q2 2018
Maldron Hotel Parnell Square x 55 x Q4 2018
Regional Ireland Property New Extension Rooms Planning Construction Completion
Lodged Granted Started
1 New Hotel Maldron Hotel Beasley Street,
x 150 x Q4 2018
Cork
1 Extension Maldron Hotel Sandy Road,
x 47 x x Mid 2018
Galway
197 Rooms
UK Property New Extension Rooms Planning Construction Completion
Lodged Granted Started
1 New Hotel Maldron Hotel Brunswick
x 237 x x Q2 2018
Street, Belfast
1 New leased Hotel Maldron Hotel, Newcastle* x 264 x x Q4 2018
501 Rooms
*35 year operating lease
Page 18Growth Strategy
Evolving Strategy

                    2014 - 2016                                2017+

                                                  Maturing into a large hotel company
            Building a portfolio within the        focused on exploiting new growth
                Ireland recovery story                       opportunities

        Identified and exploited cyclical        Operational excellence through revenue
        opportunity to acquire hotel assets      maximisation and driving cost efficiencies
        under replacement cost
                                                 +1,200 new bedrooms by end 2018
        Invested over €1Bn in acquiring almost
        7,000 rooms across Ireland and UK        Maintain Net Debt/EBITDA at or below
                                                 3.5x
        Significant capital refurbishment
        programme commenced from mid 2014        Seek to buy out remaining freeholds of
                                                 leased assets with open market rent
        Built out central management function    reviews

                                                 Infill acquisitions in Ireland and targeted
                                                 leasehold growth in the UK

              Consolidation phase largely
                      completed                          Already well underway

                                                                                               Page 20
Drive Portfolio Growth | UK Strategy
Become one of the largest hotel operators in the UK through leases and ownership
Senior team has extensive experience of rolling out a new brand (Jurys Inn) in the UK:
Acquisitions team sourced, financed and developed over 15 new hotels
Operations team opened and operated over 20 hotels
Opportunity exists in the upper 3 star and 4 star markets in large provincial UK cities:
Market is fragmented - only Hilton and Holiday Inn have any significant presence
Major brands have moved away from owned/leased to managed and increasingly franchise
model – can lead to dilution of brand standards
Dalata is one of the few hotel operators in the 3 and 4 star markets that has a significant central
office management structure to operate a large portfolio of hotels
We believe space exists for a fresh new offering
Carefully assess opportunities to grow Maldron and Clayton brands
Focus on strong locations in the larger cities
Strength of location is more important than speed of rollout
Page 21Drive Portfolio Growth | Ireland
Ireland: Portfolio Objectives
Complete existing development pipeline of 740 rooms
Reach the optimum market share in each of the key urban centres including Dublin, Cork, Limerick
and Galway
Seek to purchase freehold interests of leased assets with open market review clauses
Continue to review existing hotels in portfolio to assess long term suitability
Page 22Appendix ISE: DHG LSE: DAL
Dalata | Strong Full Year Performance

  Increase in ARR drives 14.9% RevPAR growth
                                                               Key Financials €’000        2016       2015
  Strong conversion of incremental sales leads to segments
  EBITDAR margin increasing from 39.5% to 41.4%                Revenue                    290,551    225,673
  Rent increased due to new leasehold assets and               Segments EBITDAR           120,308    89,253
  increases in performance rents. Counterbalanced by           Rent                       (25,453)   (19,167)
  closure of Clyde Court and purchase of freeholds of
  previously leased hotels                                     Segments EBITDA            94,855     70,086
  Continued investment in central team reflected in central    Central overheads          (10,360)   (8,068)
  overheads
                                                               Other income / costs       (13,411)   (15,022)
  Other costs include acquisitions related costs & goodwill
  impairment of €10.3m following upward revaluation of         EBITDA                     71,084     46,996
  assets                                                       Depreciation               (15,477)   (10,039)
  Significant increase in depreciation due to acquisition of   Net finance costs          (11,496)   (8,500)
  new hotels and capital refurbishment programme
                                                               Profit before tax          44,111     28,457
  Net finance costs includes exchange losses on sterling
  balances                                                     Profit after tax           34,923     21,626
KPIs                               2016          2015          EPS (€)                     0.19       0.14
Occupancy                         82.1%         80.2%          Adjusted EBITDA            85,132     62,626
Average Room Rate (€)              97.6          87.0          Adjusted diluted EPS (€)    0.27       0.25
RevPAR (€)                         80.2          69.8

                                                                                                       Page 24
Dublin | Full Year Performance
Another very strong year for Dublin hotel market with
All figures €’000 2016 2015
RevPAR up 16.1%. Very limited new supply until late
2018. Demand driven by increased corporate demand
and continued strength in leisure sector Revenue
Rooms 107,370 82,611
Net 680 rooms added in 2016 through Tara Towers
Food and beverage 35,392 30,391
(Jan), Gibson (Mar) and Clayton Hotel Burlington
Road (Nov), and Clyde Court closed down end 2015 Other 9,183 7,757
Total revenue 151,945 120,759
Outperformed market with RevPAR up 19.9%
EBITDAR 72,992 53,754
Food and beverage sales up 1% for the year on a ‘like Rent (19,520) (14,492)
for like’ basis (excluding Clyde Court and hotels
acquired during 2016) EBITDA 53,472 39,262
EBITDAR % 48.0% 44.5%
Rent up as a result of addition of Gibson and Clayton
Burlington Rd hotels and increased performance rents
at Ballsbridge and Maldron Dublin Airport hotels, KPIs 2016 2015
counterbalanced by closure of Clyde Court Hotel Occupancy 85.7% 83.1%
EBITDAR margin up to 48% due to 78.2 % conversion Average Room Rate (€) 107.09 92.18
of additional sales to EBITDAR on a ‘like for like’ basis RevPAR (€) 91.83 76.57
KPIs include performance of all acquisitions (except Clayton Hotel
Burlington Road) for entire of 2016 and 2015
Page 25Regional Ireland| Full Year Performance
All figures €’000 2016 2015
Continuing strong demand from FDIs, domestic
corporate and domestic leisure customers with no
increases in supply and very little supply pipeline Revenue
Rooms 36,100 20,753
518 rooms added to portfolio through Clayton Hotel
Food and beverage 25,174 17,694
Cork City, Clayton Hotel Limerick and Clayton Hotel
Sligo in March Other 7,193 4,542
Total revenue 68,467 42,989
RevPAR up 11.7%
EBITDAR 18,170 9,695
Food and beverage up 3% for the year on a ‘like-for- Rent (1,939) (1,961)
like’ basis (excluding hotels acquired during the year)
EBITDA 16,231 7,734
Significant increase in EBITDAR margin to 26.5% due EBITDAR % 26.5% 22.6%
to 73.3% conversion of incremental revenue on ‘like
for like’ basis and addition of Clayton Cork City which
KPIs 2016 2015
has higher margins on back of very strong RevPAR
Occupancy 74.0% 72.2%
Average Room Rate (€) 86.16 78.94
RevPAR (€) 63.68 57.03
KPIs include full year performance of all Regional Ireland hotels
regardless of when acquired.
Page 26UK Full Year Performance
London had very difficult first half due to All figures £’000 2016 2015
combination of impact of European terrorist attacks
and increased supply. City ended 2016 stronger and Revenue
also strong start to 2017
Rooms 37,866 28,931
Belfast had very strong second half, helped by re- Food and beverage 13,440 10,412
opening of Waterfront Conference Centre. Cardiff Other 4,176 2,813
impacted by having Rugby World Cup in 2015 while
Manchester and Leeds continue to perform well Total revenue 55,482 42,156
EBITDAR 21,883 16,068
Croydon Park leasehold was acquired in March 2016
Rent (3,274) (1,967)
leading to an increase in rent
EBITDA 18,609 14,101
RevPAR increased by 4.4% across the 8 hotels
EBITDAR % 39.4% 38.1%
Food and beverage sales increased by 2.7%
(excluding Croydon Park Hotel) KPIs 2016 2015
Occupancy 81.4% 81.3%
Converted 73.8% of additional sales to EBITDAR line
on a ‘like for like’ basis Average Room Rate (£) 73.35 70.35
RevPAR (£) 59.70 57.18
KPIs include full year performance of all UK hotels regardless of when
acquired.
Page 27Dalata| Strong Cashflow to Fund Pipeline & Further Growth
All figures €’000 2016 2015
Illustration of what the business can
generate in cash to fund debt repayment,
acquisitions, development activity etc.
Adjusted EBITDA 85.1 62.6
Maintenance capex averages 4% of turnover
Net cash from operating activities 77.8 54.4
Development capital expenditure is excluded
Adjusting cash items 1 4.0 13.9
as it either relates to new build hotels,
extensions, redevelopment or items
Interest on bank loans (excluding fees) (8.7) (9.3)
identified on acquisition required to bring
hotels to brand standard
Maintenance Capital Expenditure (11.6) (9.0)
Cash conversion is higher in 2015 due to Cash generated to fund debt
reduction in working capital resulting from repayment, acquisitions and 61.5 50.0
more significant acquisition activity in 2015 development activity
compared to 2016
Cash conversion 72% 80%
1 Stock
exchange listing costs of €1.3m, acquisition costs of €2.7m (2015:
€15.8m), Ballsbridge site sale €1.9m in 2015
Page 28Dalata | FX Effects
Sterling exchange rate has significant impact on earnings
Average exchange rate for 2016 was 0.8266
Average exchange rate for 2015 was 0.7219
2016 EBITDA would been have €3.3m higher if 2015 average exchange rate had applied however,
interest and depreciation would have been higher by €0.8m and €0.7m respectively
Page 29Drive Performance of Existing Assets
Revenue maximisation priorities Cost efficiency initiatives
Growing the strength of our brands Target 75% conversion of incremental ARR to
bottom line
Continuous focus on improving revenue
management Use of Alkimii (bespoke system) to gain staffing
efficiencies across the Group
Develop food and beverage offering with rollout
of Grain & Grill in Maldron hotels and Red Bean
Roastery coffee offering in larger hotels Upskilling of chefs on food margin management
Maximise other revenue including rebranding of Implementation of central purchasing system in
all leisure clubs to ‘club vitae’ and installation of 2017 to drive economies of scale
new technology to manage all larger car parks
Focus on reduction of energy and maintenance
Enhance hotel websites and book direct costs across the Group
offerings
Page 30Driving Performance of Existing Assets | Investment
Over €14.75 million invested in 1,380 room refurbishments in 2015 and 2016 (nearly 20% of total
rooms in two years)
Forecast €7.9 million in room refurbishments expected in 2017
Standardised room templates for Clayton and Maldron brands driving investment efficiencies
Improved product contributing to higher ARR
Rooms Refurbished 2015 2016 2017 Total
373 138 167 678
260 610 770 1,640
2,318
2016 FY Results
Page 31Strong, Complementary Brand Proposition
Hotels that provide a gateway to a great experience. Collection of distinctive hotels each with its own sense
Situated in unrivalled urban and rural locations perfect of individuality and character providing a home away
Brand for visiting local attractions, attending an event, seeing a from home experience. Service delivered by staff who
show. Service delivered with a smile and a fun attitude are warm, engaging, inquisitive and empathetic
Proposition
Go further at a Maldron Hotel Your Stay, Your Way
Generally standard rooms, with family and executive
Bedrooms rooms in some locations
Standard, superior and executive rooms
Modern bar, restaurant and coffee dock. Food and
Food & Integrated bar and restaurant in some locations. Simple
beverage offering based on local influences and freshly
menus made from fresh quality produce
Beverage sourced premium ingredients
Conference Meeting room facilities
Extensive choice of modern meeting rooms and events
facilities
Facilities
Target Both leisure and corporate with main focus on leisure Focus on corporate and conference midweek. Leisure,
guests and family functions and weddings at weekend
Customers
Page 32Dalata | Portfolio
Owned Hotels / Freehold Equivalent Lease Agreements
Hotel Rooms Hotel Rooms
Clayton Hotel Dublin Airport 469 Clayton Hotel Burlington Road, Dublin 502
Clayton Hotel Ballsbridge, Dublin 304 Clayton Hotel Cardiff Lane , Dublin (2) 304
Clayton Hotel Leopardstown, Dublin 354 The Gibson Hotel, Dublin 252
Clayton Hotel Cardiff, Wales 216 Croydon Park Hotel, London 211
Clayton Hotel Galway 195 Maldron Hotel Smithfield, Dublin 92
Clayton Whites Hotel, Wexford 157 Maldron Hotel Tallaght, Dublin 119
Clayton Hotel Silver Springs, Cork 109 Maldron Hotel Galway (Oranmore) 113
Clayton Hotel Chiswick, London 227 Maldron Hotel Portlaoise 90
Clayton Crown Hotel, London 152 Maldron Hotel Dublin Airport 251
Clayton Hotel Leeds 334 Ballsbridge Hotel, Dublin 400
Clayton Hotel Belfast 170 Total 2,334
Clayton Hotel Manchester Airport 365 Management Contracts
Clayton Hotel Cork City (1) 198 Hotel Rooms
Clayton Hotel Limerick 158 With Receivers 352
Clayton Hotel Sligo 162 Clarion Liffey Valley Hotel 352
Maldron Hotel Parnell Square, Dublin 129 Directly with Owners 557
Maldron Hotel Pearse Street, Dublin 115 Cavan Crystal Hotel, Co. Cavan 85
Maldron Hotel Newlands Cross, Dublin 297 Maldron Hotel Belfast 103
Maldron Hotel Cork 101 The Belvedere Hotel, Dublin 101
Maldron Hotel Limerick 142 Fitzwilton Hotel, Co. Waterford 90
Maldron Hotel Sandy Road, Galway 104 Aghadoe Heights Hotel & Spa, Co Kerry 74
Maldron Hotel Wexford 108 Shearwater Hotel, Ballinasloe, Co. Galway 104
Maldron Hotel Derry 93 Total 909
Tara Towers Hotel, Dublin 111
Summary by Hotel Category Hotels Rooms
Total 4,770 Owned 24 4,770
Leased 10 2,334
Mgmt Agreement – Receivers 1 352
(1) Dalata own 191 rooms & lease 7 apartments Mgmt Agreement – Owners 6 557
(2) Dalata lease 281 rooms & own 23 rooms
Total 41 8,013
Page 33You can also read