Howard Weil Energy Conference - March 2015 - Criterion Research
←
→
Page content transcription
If your browser does not render page correctly, please read the page content below
Howard Weil Energy Conference
         March 2015
Important Note to Investors

 This presentation contains certain forward-looking statements within the meaning of the Private Securities Litigation Reform Act of 1995 regarding Dominion and
 Dominion Midstream. The statements relate to, among other things, expectations, estimates and projections concerning the business and operations of Dominion
 and Dominion Midstream. We have used the words "anticipate", "believe", "could", "estimate", "expect", "intend", "may", "plan", “outlook”, "predict", "project",
 “should”, “strategy”, “target”, "will“, “potential” and similar terms and phrases to identify forward-looking statements in this presentation. As outlined in our SEC
 filings, factors that could cause actual results to differ include, but are not limited to: unusual weather conditions and their effect on energy sales to customers and
 energy commodity prices; extreme weather events and other natural disasters; federal, state and local legislative and regulatory developments; changes to federal,
 state and local environmental laws and regulations, including proposed carbon regulations; cost of environmental compliance; capital market conditions, including
 the availability of credit and the ability to obtain financing on reasonable terms; fluctuations in interest rates; changes in rating agency requirements or credit ratings
 and their effect on availability and cost of capital; impacts of acquisitions, divestitures, transfers of assets by Dominion to joint ventures or to Dominion Midstream,
 and retirements of assets based on asset portfolio reviews; receipt of approvals for, and timing of, closing dates for acquisitions; the execution of Dominion
 Midstream’s growth strategy; changes in demand for Dominion’s services; additional competition in Dominion’s industries; changes to regulated rates collected by
 Dominion; changes in operating, maintenance and construction costs; timing and receipt of regulatory approvals necessary for planned construction or expansion
 projects and compliance with conditions associated with such regulatory approvals; the inability to complete planned construction projects within time frames
 initially anticipated; and the ability of Dominion Midstream to negotiate and consummate acquisitions from Dominion and third-parties, and the impacts of such
 acquisitions. Other risk factors are detailed from time to time in Dominion’s and Dominion Midstream’s filings with the Securities and Exchange Commission.

 The information in this presentation was prepared as of February 3, 2015. Dominion and Dominion Midstream undertake no obligation to update any forward-
 looking information statement to reflect developments after the statement is made. Projections or forecasts shown in this document are based on the assumptions
 listed in this document and are subject to change at any time. In addition, certain information presented in this document incorporates planned capital expenditures
 reviewed and endorsed by Dominion’s Board of Directors in late 2014. Dominion undertakes no obligation to update such planned expenditures to reflect plan or
 project-specific developments, including regulatory developments, or other updates until the following annual update for the plans. Actual capital expenditures may
 be subject to regulatory and/or Board of Directors’ approval and may vary from these estimates.

 This presentation shall not constitute an offer to sell or the solicitation of an offer to buy securities. Any offers, solicitations or offers to buy, or any sales of securities
 will be made in accordance with the requirements of the Securities Act of 1933, as amended.

 This presentation has been prepared primarily for security analysts and investors in the hope that it will serve as a convenient and useful reference document. The
 format of this document may change in the future as we continue to try to meet the needs of security analysts and investors. This document is not intended for use
 in connection with any sale, offer to sell, or solicitation of any offer to buy securities.

 This presentation includes various estimates of EBITDA which is a non-GAAP financial measure. Please see the Appendix for a discussion of EBITDA.

                                             Please continue to regularly check Dominion’s website at www.dom.com/investors
                                                 and Dominion Midstream’s website at www.dommidstream.com/investors.

March 2015                                                                                                                Howard Weil Energy Conference                              2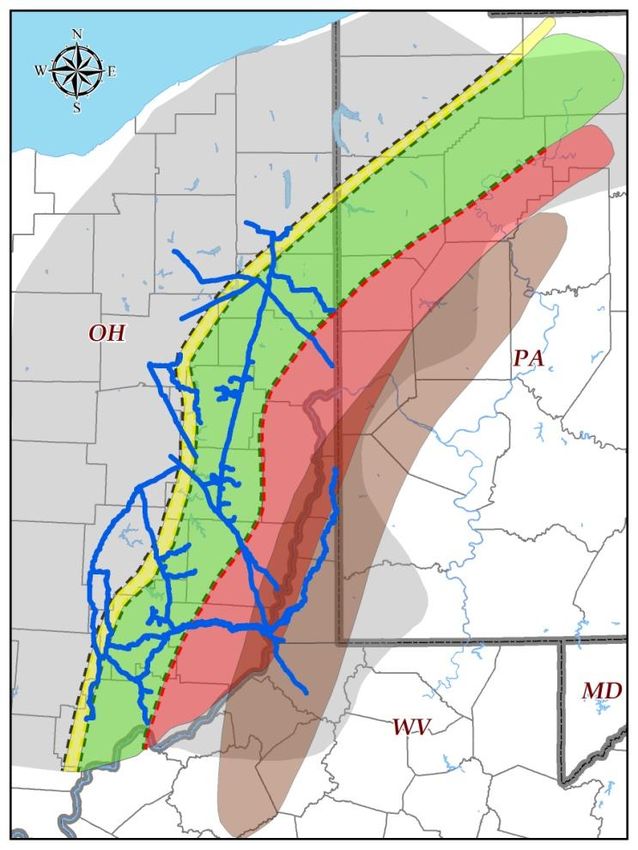
Dominion Midstream
                 Key Investment Highlights

                     • Strong and supportive sponsor

                     • Quality asset inventory

                     • Dropdown strategy provides 22% distribution growth

                     • Financial strength and flexibility

March 2015                                                  Howard Weil Energy Conference   3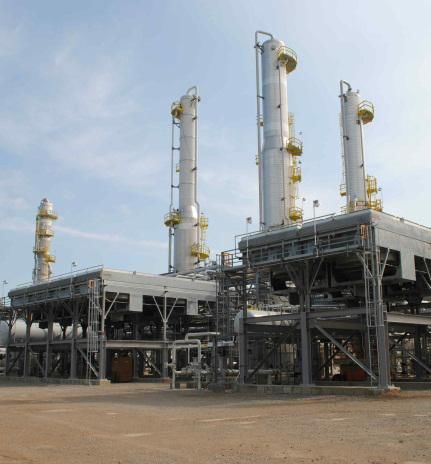
Dominion Profile
     Strong and Supportive Sponsor

  Leading provider of energy and energy services in
     the Midwest and Eastern regions of the U.S.
    24,600 MW of electric generation

    6,455 miles of electric transmission
                                                                                                                   NY
    12,400 miles of natural gas transmission,
    gathering and storage pipeline                                                                                        CT    RI

    949 billion cubic feet of natural gas storage                                                            PA
    operated
                                                                     IN                                    MD
    Cove Point LNG Facility                                                       OH
    2.5 million electric customers in VA and NC
                                                                                            WV
    1.3 million natural gas customers in OH & WV
                                                                                             VA
    1.3 million non-regulated retail customers in 12
    states (not shown)                                                                      NC

      D owns 100% of DM General
                                                                                                  SC
      Partner and 69% of LP units

                    Please refer to page 2 for risks and uncertainties related to projections and forward looking statements.
March 2015                                                                                         Howard Weil Energy Conference     4
Total Dominion Capex
2015 – 2020 Growth Plan ($billions)
$19.2 billion
Growth $54.7
Capex $2.1 Net
$2.5 Plant1
$2.8
$3.2
$4.3
$4.3
$35.5 Average annual spend of
Net ~$3.2 billion per year
Plant
2014 2015 2016 2017 2018 2019 2020
1 Excludes 2015-2020 DD&A and Maintenance Capex
Please refer to page 2 for risks and uncertainties related to projections and forward looking statements.
March 2015 Howard Weil Energy Conference 5Dominion EPS Growth
Long-term Projections
6-7% CAGR for 2015 - 2020
Transformational
Investments + MLP
accelerate EPS
growth post-2017
$3.48*
2014 2015 2016 2017 2018 2019 2020
Foundation Transformational Investments & Financial Initiatives
*Note: Represents weather-adjusted 2014 Operating EPS
Please refer to page 2 for risks and uncertainties related to projections and forward looking statements.
March 2015 Howard Weil Energy Conference 6Dominion Dividend Growth
Long-term Projections
8%
Board increased Annual
payout ratio to Growth
70-75% starting
in 2015
5-6%
Annual
$2.59 Growth
$2.40
Note: Annual
dividend rates
subject to Board
2014 2015 2016 2017 2018 2019 2020 approval
Please refer to page 2 for risks and uncertainties related to projections and forward looking statements.
March 2015 Howard Weil Energy Conference 7Quality Asset Inventory
• Cove Point LNG
• Dominion-Carolina Gas Transmission
• Dominion’s interest in Atlantic Coast Pipeline
• Dominion’s interest in Blue Racer
• Other retained Dominion assets
March 2015 Howard Weil Energy Conference 8Dominion Midstream
Initial Asset Overview
– Existing Operations: Cove Point
• LNG import and storage services
• Domestic natural gas and regasified
LNG transportation services
– Long-term contracts with firm
reservation payments with
creditworthy counterparties
– Preferred Equity Interest
• Perpetual, non-convertible preferred
equity interest entitled to the first
$50 million of annual cash
distributions from Cove Point
Please refer to page 2 for risks and uncertainties related to projections and forward looking statements.
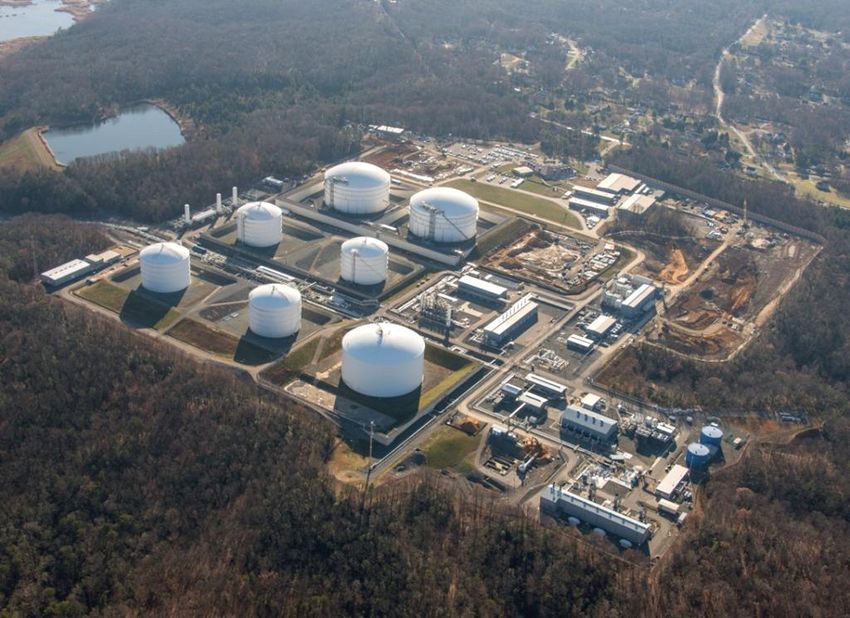
March 2015 Howard Weil Energy Conference 9Cove Point LNG Export
Cove Point Export construction is
on-time and on-budget
Expected in-service late 2017
– Engineering is ~77% complete
– Procurement of major
equipment on schedule
• Engineered equipment packages are
~84% awarded
– Total estimated project cost
$3.4 - $3.8 billion* Total 2015-2020 Capex
• ~$1 billion* spent through 2014 of $2.4 - $2.8 billion*
*Excludes financing costs
Please refer to page 2 for risks and uncertainties related to projections and forward looking statements.
March 2015 Howard Weil Energy Conference 10Dominion – Carolina Gas Transmission
Dominion acquisition of CGT for ~$493
CGT System
million closed on January 31, 2015
– 1,500 miles of FERC-regulated pipeline in
SC and GA
• ~0.70 Bcf/d capacity expanding to ~0.82
Bcf/d by 2018 SC
Growth projects are fully contracted
– Expected to be dropped into DM in 1H15
– Financial highlights:
• 2015 annualized EBITDA of ~$38 million*
Expected to grow to ~$50 million by 2018
Acquisition
• 2015 annualized DCF of ~$22 million*
accretive for both
Expected to grow to ~$30 million by 2018 D and DM
*Excludes non-recurring transaction costs
Please refer to page 2 for risks and uncertainties related to projections and forward looking statements.
March 2015 Howard Weil Energy Conference 11Atlantic Coast Pipeline
OWNERSHIP STRUCTURE:
Dominion Resources* 45%
Duke Energy 40%
Piedmont Natural Gas 10%
AGL Resources 5%
– 550 miles of 42” pipe
– 1.5 Bcf per day capacity
• Subscribed through ACP partners and
other LDCs
• Expandable to >2 Bcf per day
ACP
– Est. cost $4.5 – $5.0 billion** DTI Pipeline
Storage
• >55% of total procurement complete Cove Point
– 20-year binding contracts with Utica
Shale
electric and gas utilities
Marcellus
– Expected In-service November 2018 Shale
* Dominion will construct, operate and manage the pipeline
** Excludes financing costs
Please refer to page 2 for risks and uncertainties related to projections and forward looking statements.
March 2015 Howard Weil Energy Conference 12Blue Racer Midstream JV
Overview
Growth-oriented midstream platform located
in the rich and lean areas of Utica & Marcellus
– High-quality assets Lean Utica
• ~750 miles of gas, NGL and condensate pipelines Rich Utica
• 600 MMcf/d of processing capacity Utica Volatile Oil
• 47,000 Bbl/d of fractionation capacity
– Largely fee-based contracts Lewis
• ~90% of expected 2015 revenues
Rich Marcellus
• New contracts expected to increase fee-based %
post-2015
– Favorable well results driving significant
Natrium
producer activity in the southern Utica
• Blue Racer uniquely positioned to capture Berne
significant growth
Please refer to page 2 for risks and uncertainties related to projections and forward looking statements.
March 2015 Howard Weil Energy Conference 13Blue Racer Midstream JV
Key Projects Through 2015
– Processing
• Natrium I & II
1 Bcf/day
• Berne I
processing capacity
• Berne II - 1H2015 by the end of 2015
• Lewis I - 2H2015
– Fractionation
• Natrium 123,000 bbls/day
• Natrium Expansion - 1H2015 by the end of 2015
– Gathering / NGL Projects funded at Blue Racer & do not
• Multiple growth projects require cash outlays from Dominion
Please refer to page 2 for risks and uncertainties related to projections and forward looking statements.
March 2015 Howard Weil Energy Conference 14Blue Racer Midstream JV
Updated Long-term Forecast*
Current business plan shows
significant long-term growth
$265 - $275
$245 - $255
$220 - $230
$185 - $195
$140 - $150
$85 - $95
2015 2016 2017 2018 2019 2020
* Dominion’s pro-rata share of EBITDA (less partnership level cash interest expense) from joint venture
Please refer to page 2 for risks and uncertainties related to projections and forward looking statements.
March 2015 Howard Weil Energy Conference 15Dominion Additional Retained Assets
Dominion Gas Holdings
– Dominion Transmission
• 7,775 miles of pipeline in six states*
• 778 Bcf of underground natural gas storage
• 9.3 Bcf/d gas peak sendout capability
• 270,000 mcf/d of natural gas processing capacity
– Interest in Iroquois Pipeline
• 416 miles of mile interstate natural gas pipeline system
• 24.72% ownership interest
– Dominion East Ohio
• 171 Bcf of underground natural gas storage 10,900 miles of natural gas transmission, gathering
and storage pipeline
• 1.2 million natural gas customers
949 billion cubic feet of natural gas storage
• 360 Bcf of natural gas throughput in 2014 operated
• 21,700 miles of natural gas distribution pipeline 1.2 million natural gas customers in OH
* Excludes 3,125 miles of gas transmission at DEO and Hope.
Please refer to page 2 for risks and uncertainties related to projections and forward looking statements.
March 2015 Howard Weil Energy Conference 16Marcellus and Utica Shale
Fall 2014 Natural Gas Production Forecast
40 2025 Production – Takeaway
Capacity Gap (Bcf/day)
14.4
35 Utica production*
10.7
30 9.4
Bcf Per Day
25 Fall Spring Fall
2013 2014 2014
20 24.2 Bcf/d of incremental firm pipeline
take away capacity**
15
10
5 Marcellus production*
0
*Wood Mackenzie – Fall 2014 natural gas long term view
** Projects under construction or fully subscribed
Please refer to page 2 for risks and uncertainties related to projections and forward looking statements.
March 2015 Howard Weil Energy Conference 17Dominion Energy
2015 – 2020 Growth Plan ($billions)
*Total excludes Cove Point, ACP & Blue Racer
$3.3 billion
Growth $11.9
$0.5
Capex* Net
$0.5 Plant1
$0.7
$0.6
$0.6
Avg. annual spend of ~$0.6 billion
$8.6 $0.5
Drivers:
• DTI Supply Header
Net • Producer Outlet Projects
Plant • Market Access Projects
• DEO Pipeline Infrastructure Replacement
2014 2015 2016 2017 2018 2019 2020
1 Excludes 2015-2020 DD&A and Maintenance Capex
Please refer to page 2 for risks and uncertainties related to projections and forward looking statements.
March 2015 Howard Weil Energy Conference 18Producer Outlet Projects
Producer Outlet Projects optimize current
transmission system to address changing
dynamics of Northeast gas flows
– 5 projects totaling ~1 Bcf/d have
been placed into service
– 4 additional projects expected to
enter service before end of 2016
• Additional 1 Bcf/d
• ~$400 million of capex
– Expect an incremental $500
million or more of projects ~$900 million Total Capex
through the end of the decade
Please refer to page 2 for risks and uncertainties related to projections and forward looking statements.
March 2015 Howard Weil Energy Conference 19Market Access Projects
Market Access projects are demand-
driven projects that move gas off the
system to end use customers NY
CPV Power
Generation
New Market
Project
OH PA
Keys Power
Generation
MD
~$440 million
Leidy total Capex
South WV
Please refer to page 2 for risks and uncertainties related to projections and forward looking statements.
March 2015 Howard Weil Energy Conference 20DTI Supply Header
Project will increase access to diverse
Marcellus and Utica gas supplies for ACP
customers and other producers
– Capacity of 1.5 Bcf/day
• Subscribed through ACP partners and
other LDCs
– Expected Project Milestones
• Open Season completed Fall 2014
• FERC Pre-filing submitted Fall 2014 ACP
DTI Pipeline
• Receive FERC certificate Summer 2016 Storage
Cove Point
• In-Service November 2018
Supply Header Utica
Shale
~$500 million receipt points Marcellus
total Capex
Shale
Please refer to page 2 for risks and uncertainties related to projections and forward looking statements.
March 2015 Howard Weil Energy Conference 21Dominion Energy
Farmout Opportunities
Farmout opportunities provide incremental earnings
streams from mineral rights leasing, royalty revenues and
takeaway & processing agreements
– Announced and completed multiple
Marcellus farmout agreements
covering over 125,000 acres
• ~$270 million expected pre-tax
earnings contribution 2015-2020
– Additional farmout potential of
~180,000 acres of Utica mineral rights
~$450 - $500
• ~$180 - $230 million of million of potential
DTI Pipeline
Storage
incremental pre-tax earnings total pre-tax Cove Point
contribution 2015-2020 earnings 2015-2020 Utica
Shale
Marcellus
Shale
Please refer to page 2 for risks and uncertainties related to projections and forward looking statements.
March 2015 Howard Weil Energy Conference 22Dropdown Strategy March 2015 Howard Weil Energy Conference 23
Dominion Midstream Partners
   Dropdown Strategy to Support Best-in-Class Growth ($ millions)

          $1.7 billion+ of projected Dominion
         MLP-eligible EBITDA provides robust                                                                                      $349
            inventory of post-2020 growth

                                                                                                                $175
              Annual EBITDA Contribution to MLP
              On-Going MLP EBITDA*                                                          $81                                   $525
                                                                       $61                                      $329
                                                 $36                                       $228
                            $39
                                                 $93
                                                                      $139
        $50                 $50
       IPO                  2015                 2016                 2017                 2018                 2019              2020
     Cove Preferred + CGT
                                                                  Blue Racer
                                                                                                       Cove Equity / ACP
                                                Third-Party M&A** / Organic Growth
* EBITDA figures annualized based on year end
** Opportunistic third-party M&A not included; M&A would supplement existing dropdown strategy
                      Please refer to page 2 for risks and uncertainties related to projections and forward looking statements.
March 2015                                                                                           Howard Weil Energy Conference       24
Dominion Midstream Partners
Targeted LP Distribution Growth Rate Per Unit
Dropdown strategy supports “best-in-class” growth rate
~$2.30
$0.85
$0.70
2014 2015 2016 2017 2018 2019 2020
Note: Distributions reflect year end run-rate
Please refer to page 2 for risks and uncertainties related to projections and forward looking statements.
March 2015 Howard Weil Energy Conference 25Dominion Midstream Partners
Total Projected Cash Flow to Dominion ($ billions)*
Total cash flows of ~$7 billion 2015-2020 will be used to: $2.9
• Support strong dividend growth at D
• Buyback D shares
• Pay down DRI debt
• Fund new growth projects
$1.7
$0.9
$0.7
$0.4
$0.1
2015 2016 2017 2018 2019 2020
Drop Down Proceeds LP Distributions GP Distributions
*Pre-tax
Please refer to page 2 for risks and uncertainties related to projections and forward looking statements.
March 2015 Howard Weil Energy Conference 26Dominion Midstream Partners
Projected LP and GP Distributions to Dominion ($ millions)*
Distributions to Dominion grow rapidly over time
Total LP & GP distributions of
~$1 billion 2015-2020
$241
~48% of EBITDA dropped through 2020
flows back to D in the form of LP and GP
distributions
$129
$61
$26 $181
$6 $112
$64 $81
$39 $52
2015 2016 2017 2018 2019 2020
LP Distributions GP Distributions
*Pre-tax
Please refer to page 2 for risks and uncertainties related to projections and forward looking statements.
March 2015 Howard Weil Energy Conference 27Dominion Midstream Partners
Projected Dominion Ownership
Dominion will retain 100% of the GP and a large
portion of the LP units through 2020
Total LP Units (millions)
190M
143M
105M
91M
82M
64M 71M
81M
60M 43%
44M 49M 50M 50M 52M
69%
At IPO 2015 2016 2017 2018 2019 2020
D Ownership Public Ownership
Please refer to page 2 for risks and uncertainties related to projections and forward looking statements.
March 2015 Howard Weil Energy Conference 28Appendix March 2015 Howard Weil Energy Conference 29
Reconciliation of Operating Earnings to Reported Earnings
     2014 Earnings (Twelve months ending December 31, 2014)

–   The net effects of the following items, all shown             (millions, except per share amounts)                                   1Q14         2Q14       3Q14     4Q14 YTD 2014 2
    on an after-tax basis, are included in 2014                   Operating earnings                                                     $607         $361       $545     $490 $2,003
    reported earnings, but are excluded from                      Items excluded from operating earnings (after-tax):
    operating earnings:                                              North Anna and offshore wind facilities                                          (191)       (28)     (29)     (248)
                                                                     Producer Services repositioning                                     (193)                                      (193)
     •    $248 million charge associated with Virginia               Charges associated with liability management exercise                                         (2)    (172)     (174)
          legislation enacted in April that permits Virginia         Future ash pond closure costs                                                                         (74)      (74)
          Power to recover 70% of the costs previously               Goodwill write-off at unregulated electric retail                    (31)                                       (31)
          deferred or capitalized through Dec. 31, 2013              Other items                                                           (4)         (11)        14       28        27
          relating to the development of a third nuclear                                                                           1     (228)        (202)       (16)    (247)     (693)
                                                                     Total items excluded from operating earnings (after-tax)
          unit located at North Anna and offshore wind            Reported net income                                                   $379         $159        $529    $243     $1,310
          facilities as part of the 2013 and 2014 base rates.     Common shares outstanding (average, diluted)                          582.9        583.9      584.6    586.5     584.5
     •    $193 million net charge related to the                  Operating earnings per share                                          $1.04        $0.62      $0.93    $0.84     $3.43
          repositioning of our Producer Services business,        Items excluded from operating earnings (after-tax)                    (0.39)       (0.35)     (0.03)   (0.42)    (1.19)
          reflecting the termination of natural gas trading       Reported earnings per share                                           $0.65        $0.27      $0.90    $0.42     $2.24
          and certain energy marketing activities.
     •    $174 million charge associated with our liability       1) Pre-tax amounts for items excluded from operating earnings are reflected in the following table:
          management exercise, mainly reflecting the call            Items excluded from operating earnings:                          1Q14         2Q14        3Q14      4Q14 YTD 2014
          premiums on our early debt redemptions in the
          fourth quarter.                                            North Anna and offshore wind facilities                                          (287)       (43)     (44)      (374)
                                                                     Producer Services repositioning                                     (319)                                       (319)
     •    $74 million charge related to a settlement offer
                                                                     Charges associated with liability management exercise                                         (3)    (281)      (284)
          to incur future ash pond closure costs at certain
                                                                     Future ash pond closure costs                                                                        (121)      (121)
          utility generation facilities.
                                                                     Goodwill write-off at unregulated electric retail                    (31)                                        (31)
     •    $31 million goodwill write-off associated with the         Other items                                                           (2)         (15)        (8)     (12)       (37)
          company exiting the unregulated electric retail
                                                                     Total items excluded from operating earnings                       ($352)       ($302)      ($54)   ($458)   ($1,166)
          energy marketing business.
     •    $27 net benefit related to other items.                 2) YTD EPS may not equal sum of quarters due to share count differences.

                    Please refer to page 2 for risks and uncertainties related to projections and forward looking statements.
March 2015                                                                                                           Howard Weil Energy Conference                                     30
2015 Earnings Expectations
– Reconciliation of measures prepared in accordance with Generally Accepted Accounting Principles (GAAP) versus non-GAAP
measures:
• 1Q 2015 Operating Earnings (estimate): $0.85 - $1.00
• FY 2015 Operating Earnings (estimate): $3.50 - $3.85
• 1Q 2015 Reported Earnings (estimate): See Note 1 below
• FY 2015 Reported Earnings (estimate): See Note 1 below
Note 1: In providing its first-quarter and full-year 2015 operating earnings guidance , Dominion notes that there could be differences between expected reported (GAAP) earnings
and estimated operating earnings for matters such as, but not limited to, divestitures or changes in accounting principles. At this time, Dominion management is currently not
able to estimate the aggregate impact, if any, of these items on reported earnings. Accordingly, Dominion is not able to provide a corresponding GAAP equivalent for its operating
earnings guidance.
– Dominion uses operating earnings as the primary performance measurement of its earnings guidance and results for public communications with analysts and investors.
Dominion also uses operating earnings internally for budgeting, for reporting to the board of directors, for the company’s incentive compensation plans and for its targeted
dividend payouts and other purposes. Dominion management believes operating earnings provide a more meaningful representation of the company’s fundamental earnings
power.
– Dominion’s estimates of first-quarter and full-year 2015 earnings are subject to various risks and uncertainties. Factors that could cause actual results to differ materially from
management's projections, forecasts, estimates and expectations may include factors that are beyond the company's ability to control or estimate precisely, including fluctuations
in energy-related commodity prices, estimates of future market conditions, additional competition in our industries, changes in the demand for Dominion’s services, access to and
costs of capital, fluctuations in the value of our pension assets and assets held in our decommissioning trusts, impacts of acquisitions, divestitures, transfers of assets to joint
ventures or Dominion Midstream and retirements of assets based on asset portfolio reviews, the receipt of regulatory approvals for, and timing of, planned projects, acquisitions
and divestitures, the timing and execution of Dominion Midstream’s growth strategy, and the ability to complete planned construction or expansion projects at all or within the
terms and timeframes initially anticipated. Other factors include, but are not limited to, weather conditions and other events, including the effects of hurricanes, earthquakes,
high winds, major storms and changes in water temperatures on operations, the risk associated with the operation of nuclear facilities, unplanned outages at facilities in which
Dominion has an ownership interest, the impact of operational hazards and catastrophic events, state and federal legislative and regulatory developments, including changes in
federal and state tax laws and changes to environmental and other laws and regulations, including those related to climate change, greenhouse gases and other emissions to
which we are subject, political and economic conditions, industrial, commercial and residential growth or decline in Dominion’s service area, risks of operating businesses in
regulated industries that are subject to changing regulatory structures, changes to regulated gas and electric rates collected by Dominion, changes to rating agency requirements
and ratings, changing financial accounting standards, fluctuations in interest rates, employee workforce factors, including collective bargaining, counter-party credit and
performance risks, adverse outcomes in litigation matters or regulatory proceedings, the risk of hostile cyber intrusions and other uncertainties. Other risk factors are detailed
from time to time in Dominion’s quarterly reports on Form 10-Q or most recent annual report on Form 10-K filed with the Securities and Exchange Commission.
Please refer to page 2 for risks and uncertainties related to projections and forward looking statements.
March 2015 Howard Weil Energy Conference 31Non-GAAP Measures
• EBITDA represents net income before interest and related charges, income tax and
depreciation and amortization. Distributable cash flow (DCF) is defined as EBITDA adjusted
for known timing differences between cash and income, less capital expenditures.
• The GAAP measure most directly comparable to EBITDA is net income. EBITDA and DCF
should not be considered alternatives to net income, operating income, cash flow from
operating activities or any other measure of financial performance or liquidity presented in
accordance with GAAP. EBITDA and DCF exclude some, but not all, items that affect net
income and operating income, and these measures may vary among other companies.
Therefore, EBITDA and DCF as presented may not be comparable to similarly titled
measures of other companies.
• EBITDA forecasts for Blue Racer Midstream and Dominion Midstream were derived on an
EBITDA-only basis. At this time, elements of net income including tax and depreciation
information are not available. Accordingly, Dominion and Dominion Midstream are not able
to provide a corresponding GAAP equivalent for EBITDA forecasts.
Please refer to page 2 for risks and uncertainties related to projections and forward looking statements.
March 2015 Howard Weil Energy Conference 32Non-GAAP Reconciliation
Dominion - Carolina Gas Transmission
2015E 2018E
Net income $ 18.2 $ 24.6
Add back:
Depreciation 8.6 10.7
Fixed Charges - -
Income Tax 11.2 15.1
EBITDA 38.0 50.4
Non-cash Adjustments, net (0.4) (0.6)
Maintenance Capex (15.6) (19.8)
Distributable Cash Flow $ 22.0 $ 30.0
($ in millions)
Please refer to page 2 for risks and uncertainties related to projections and forward looking statements.
March 2015 Howard Weil Energy Conference 33March 2015 Howard Weil Energy Conference 34
You can also read