Introduction DR-BOB project - Dr Tracey Crosbie - Build Up
←
→
Page content transcription
If your browser does not render page correctly, please read the page content below
Introduction
DR-BOB project

  Dr Tracey Crosbie
Demand Response in Blocks of Buildings
              EU H2020 funded Innovation project
                      Mar 2016 – Feb 2019
               10 partners 5 EU countries 4 demos

                 Teesside University UK Project Coordinator

                 Centre Scientifique et Technique du Bâtiment France

                 Siemens Energy Management Division UK

                 R2M Solution Italy

                 NOBATEK France

                 Grid Pocket SAS France

                 Duneworks BV Netherlands

                 Fondazione Poliambulanza Italy

                 Servelect Romania

                 Technical University of Cluj-Napoca
March 3, 2016 / Teesside University                                    Slide 2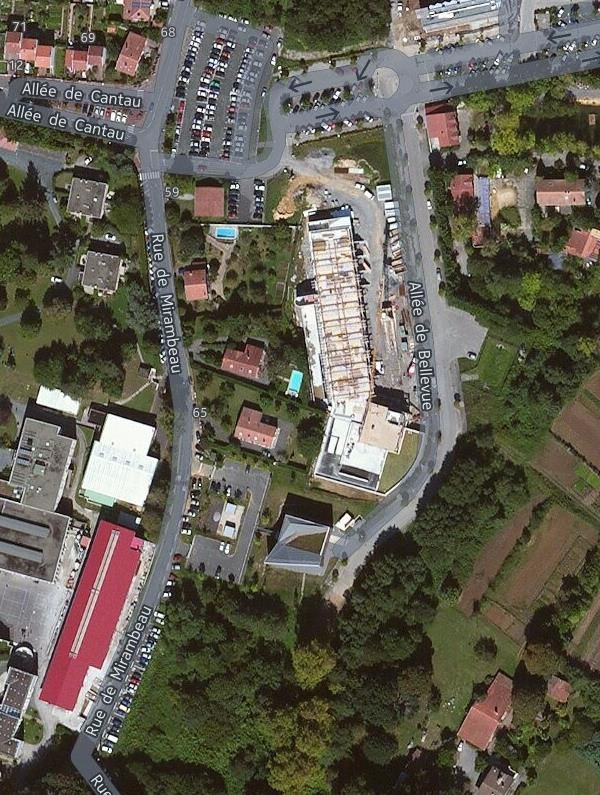
Aim of DR BOB
To demonstrate the economic & environmental benefits of demand
response in blocks of buildings for the actors required to bring it to
market
These actors include but are not restricted to
Distribution Network Operators (DNOs)
Energy Retailers
Transmission Service Operators (TSOs)
Energy Service Companies (ESCOs)
IT providers
Aggregators
Facilities owners & managers
Slide 3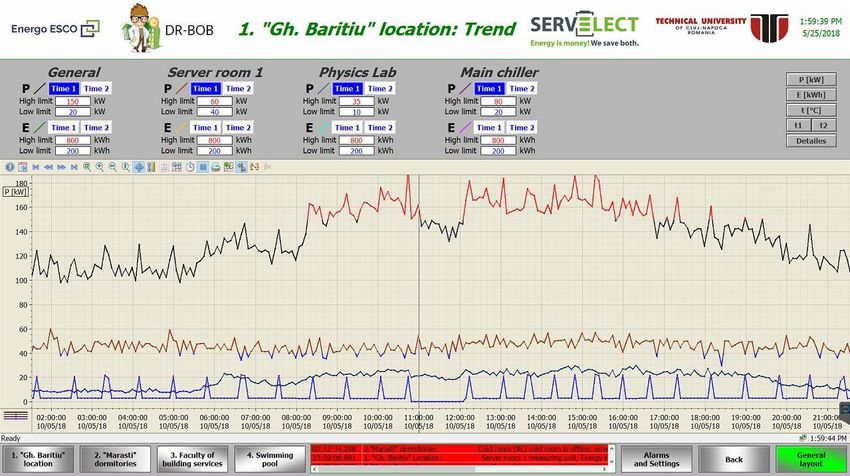
DRBOB solution key functionality
Aggregation of DR potential
of many blocks of buildings
Real-time optimisation of
local energy
production
consumption
& storage
Automated intelligence
User adjustable optimisation adapts to
criteria
fluctuations in energy demand
to maximise economic profit
& production
or to minimise CO2 emissions
changing weather conditions
dynamic energy tariffs
Slide 4
DR-BOB Architecture & Interface
A scalable cloud based
central management
system
Supported by a local
real-time energy
management solution
Which communicates
with individual building
management systems
& generation / storage
Achieved by
integrating
Demand Response
Manager Siemens
Local Energy Manager
(LEM) –Teesside
University
Consumer Portal –
GridPocket EcoTroks™
GM 1 Slide 5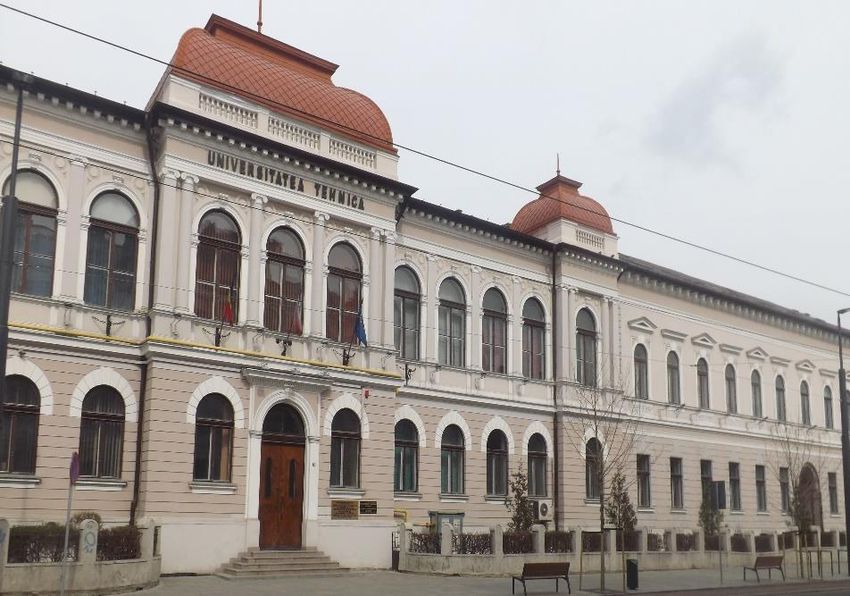
Demand Response Technology Readiness Levels
DRTRLs to measure the technological readiness of a block of
buildings to participate in a building-stock oriented DR program
Borrows from the TRL concept developed by NASA in the early 70s.
Essentially TRLs provide a “discipline-independent, program
figure of merit (FOM) to allow more effective assessment of, and
communication regarding the maturity of new technologies”.
Provides a scale which a facilities manager or building owner can
use to conduct a technology readiness assessment (TRA) of the
current energy and communications systems at their site, or sites,
to support their decision to implement the DR-BoB energy
management solution.
Slide 6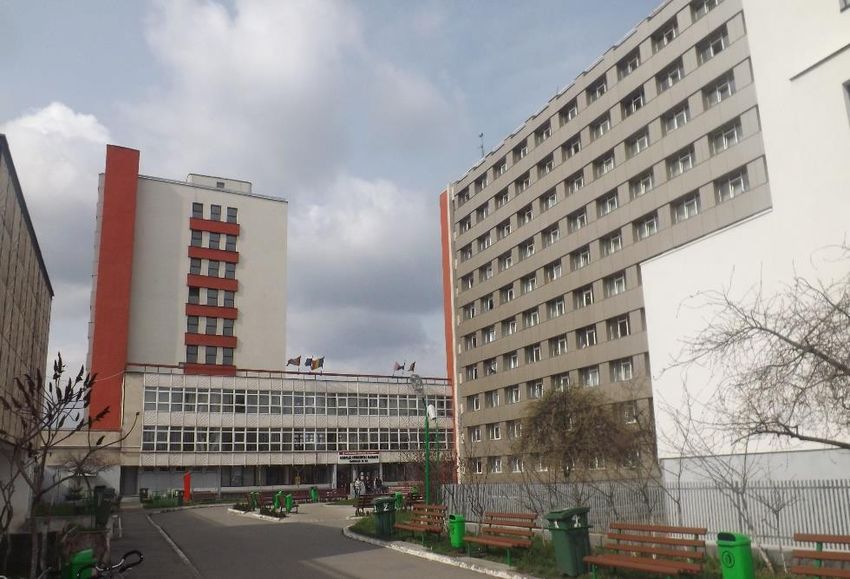
Operationalising DRTRLs for BoBs
refers to the building/site energy &
communication systems
includes metering & telemetry flexible load local energy
generation & energy storage plant
refers to time
i.e. ready for operations at the present time
refers to the extent of the capability of a block of
buildings to take part in the DR-BoB energy management
solution
refers to a group of buildings that may
or may not be in proximity to each other if under
common governance
Slide 7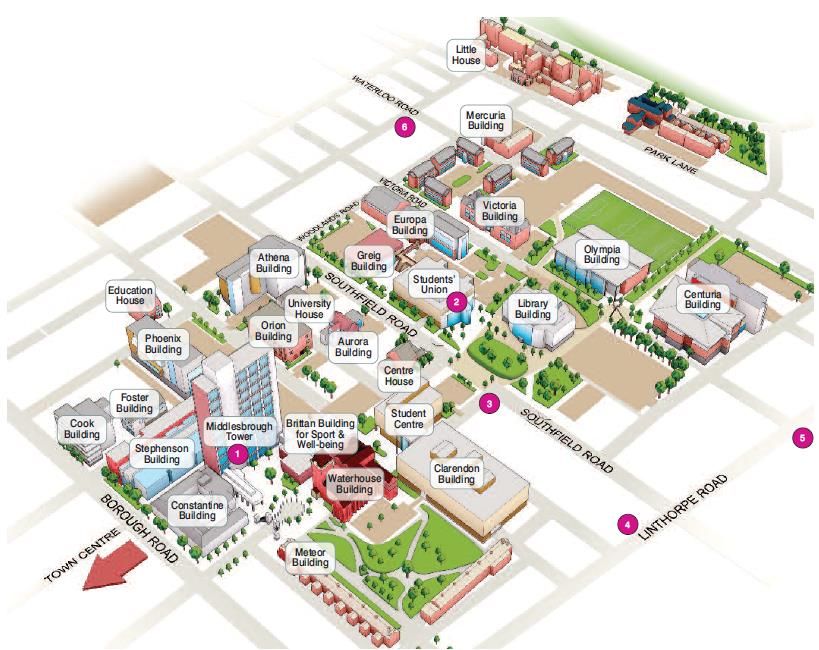
DRTRL-0 no capability
a building/site does not have the technical capacity to enable the implementation
of the DR-BoB solution
DRTRL-1 manual capability
a building/site has flexibility and can be controlled in a manual capacity by facility
managers or end consumers making a direct intervention to apply control signals
typically based on a recommendation notification such as an email
DRTRL-2 partially automated capability
a building/site has the minimum technology required to partially enable some of
the automated functioning of the DR-BoB energy management solution by directly
responding to tele-command signals without manual intervention, but will still
require manual intervention for the remaining functionality;
DRTRL-3 full automated capability
a building/site has the technologies required to fully enable all of the automated
functioning of the DR-BoB energy management solution through tele-command
signals, without requiring manual application of control.
Slide 8
https://www.mdpi.com/2075-5309/8/2/13

                                        Slide 9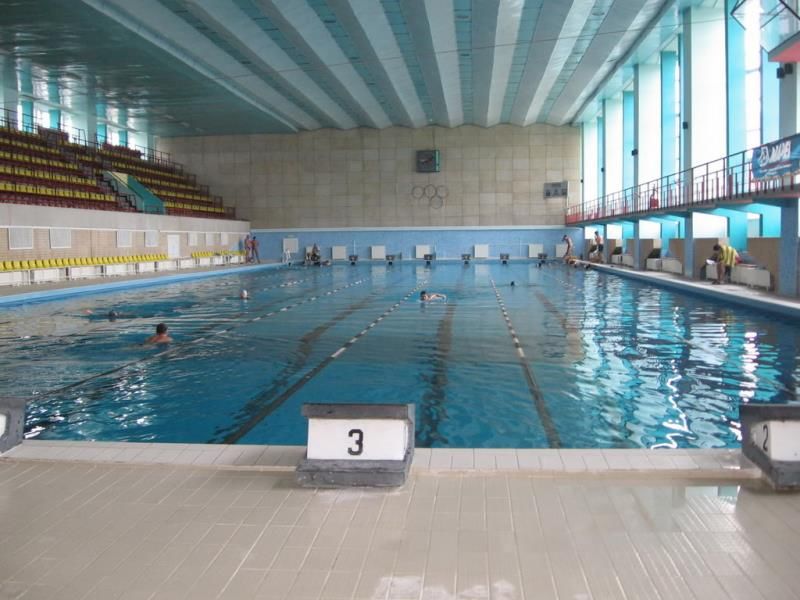
Pilot site DRTRL

                   Slide 10
DR-BOB
The UK Pilot
Dr Michael Short / Dr Sergio RodriguezThe UK pilot site
The UK demonstration site of DR-BOB
is part of the Teesside University
main campus in Middlesbrough, North
East of England.
The main campus situated just
outside Middlesbrough town centre
and occupies an area approximately
of three hectares.
The main campus is based on 33
separate buildings, 5 of which are
residential town houses/halls for the
students.
Term-time occupancy is
approximately 22,000.
Slide 12Architecture implemented at the UK pilot
site
Slide 13Pilot site DRTRL
Slide 14Running the demonstrations
Scenario # and Name Number of DR events in 2018
UK site that have occurred and are expected to come
Jan Feb Mar Apr May Jun Jul Aug Sep Oct Nov Dec
1 Electric Demand Reduction
1 3 1 1 2 2 1 2 2
2 Electric Demand Increase
1 1 2 2
3a Electric Peak Demand
Reduction (Explicit)
2 1 1 1 2
3b Electric Peak Demand
Reduction (Implicit) 1 1 10
4 Static Frequency Response
3 3 3 3 3 3 3
Slide 15Case study example. Scenario 1. STOR
deploy the overall DR-BOB technical solution at UK pilot site The largest market for DR in the UK is the
Short Term Operating Reserve (STOR). It
has a 20 minute minimum alert time for
response so it is possible to coordinate
manually activated actions to reduce
demand. In the case of the Teesside
University pilot site this means that the
larger units controlled by the BMS in a
number of buildings could be activated
together. These periods are usually found
Clarendon building
in the evenings (17:00 to 19:00)
Hence when there is a grid warning, the
system automatically changes the set point
of HVAC systems in order to abide to the
required energy demand reduction
Responding to the grid warnings might
result in economical benefits, but could
have a negative effect if not managed
adequately.
It is crucial to ensure that the adequate
optimization process is followed
Slide 16Case study example. Scenario 1. STOR (cont.)
Aggregation of multiple HVAC zones / units across many buildings:
Pd (k ) f Pd (k 1) (k 1) 2
Pn (k ) f Pn (k 1) (k 1) APR(k 1)
Pn (k )
(k ) f (k 1) (1 f ) ATR(k )
Pd (k )
OpenADR The co-ordination
procedure runs during
the prep and active
phases
J N ( xN ) g N ( xN );
k N 1, N 2, ..., 1, 0 :
J k ( xk ) min {g k ( xk , uk ) J k 1 ( f k ( xk , uk ))};
The
optimal controls
uk U k ( xk )
run perpetually
Short, M. “Optimal HVAC Dispatch for Demand Response: A Dynamic Programming Approach”. To appear in: Proceedings
of the International Conference on Innovative Applied Energy (IAPE’19), Oxford, UK, March 2019.
GM 1 Slide 17Case study example. Scenario 1. STOR (cont.)
Calibrated Simulation Results
DR DR
Window Window
160 kWh
100 kWh
DR
Window
GM 1 Slide 180,0
10,0
30,0
40,0
50,0
60,0
70,0
80,0
90,0
100,0
20,0
00:30:00
01:00:00
01:30:00
02:00:00
02:30:00
03:00:00
03:30:00
04:00:00
04:30:00
05:00:00
05:30:00
06:00:00
06:30:00
07:00:00
07:30:00
08:00:00
08:30:00
11Apr18-11Apr18
09:00:00
09:30:00
10:00:00
10:30:00
11:00:00
11:30:00
12:00:00
12:30:00
13:00:00
average high 7 of 10
13:30:00
Clarendon building. UK site 14:00:00
14:30:00
Event 11 April 2018. Scenario 1.
15:00:00
15:30:00
16:00:00
16:30:00
17:00:00
17:30:00
18:00:00
DR shifted energy use
18:30:00
Clarendon building. comparison of Wednesdays in 2018
Case study example. Scenario 1. STOR (cont.)
19:00:00
19:30:00
20:00:00
Preliminary Experimental Results
20:30:00
21:00:00
21:30:00
22:00:00
22:30:00
23:00:00
23:30:00
Slide 19Scenario 3A. TNUoS scenario (TRIADS)
Deployment of the scenario 3a at UK pilot site The Triads are 3 of the highest demand
half hourly periods in the winter for which
customers are charged circa £40/kW.
These periods are usually found in the
evenings (17:00 to 19:00)
Hence when there is a grid warning, the
users need to carry out a communication
chain in order to perform the required
Clarendon building Middlesbrough tower Constantine building Stephenson building energy demand reduction
Responding to the grid warnings might
result in benefits, not just economically,
but in the long term enhancing
organisational participation in DR
It is crucial to engage users in DR using
functionalities based on behavioural
theories designed to improve smart grid
stability and performance
There is a high diversity of stakeholders
involved, from staff, to building managers,
students, academics, researchers,
subcontrators…
Middlesbrough tower EV chargers Phoenix building
DR-BOB architecture implemented at the UK pilot site. Scenario 3a
Slide 20Scenario 3a. TNUoS. Organisational readiness
Participation of stakeholders: Roles assigned
and prepared to start running the events.
Team leaders, facility managers, users…
TSO/DSO/Grid
SC3a DR event
M
generated (triad
E
warning)
DR participation check.
Manager
Opt in CP Email Team Leaders CP CP
Energy
Initial evaluation
Opt out CP
Team leader
Stephenson
Communicate change in
Schedule schedule and event DR participation
management guidelines to staff and assurance
SC3a DR event
occupants
Communicate change in
Team leader
Clarendon
Schedule schedule and event DR participation
management guidelines to staff and assurance
occupants
Middlesbrough
Communicate change in
Team leader
Schedule schedule and event DR participation
tower
management guidelines to staff and assurance
occupants
Communicate change in
Team leader
Phoenix
Schedule schedule and event DR participation
management guidelines to staff and assurance
occupants
Slide 210
40
60
80
100
120
20
00:30
01:00
01:30
02:00
02:30
03:00
03:30
04:00
04:30
05:00
05:30
06:00
06:30
07:00
07:30
08:00
08:30
09:00
09:30
14Mar18
10:00
10:30
11:00
11:30
12:00
12:30
13:00
13:30
14:00
14:30
15:00
15:30
16:00
16:30
17:00
17:30
mean value winter
18:00
18:30
19:00
19:30
20:00
Case study example. Scenario 3a. TNUoS
20:30
21:00
Event 14 March 2018. Scenario 3a. Clarendon building
21:30
22:00
22:30
23:00
23:30
Slide 22Running the demonstrations
Other Demand Response Scenarios in the UK
SCENARIO 2 – DER (DTU in UK market)
Event: During the summer months based on historical data
Maximum expected impact, kW: approx. 220 kW (CHP)
Number of Events per year: 4
DR Programme: DER (DTU in UK Market)
SCENARIO 3B – Electric peak demand reduction (implicit)
Preferred Schedule: 9:00 to 10:00
Maximum expected impact, kW: 12 kW
Number of Events per year: 12
DR Programme: DUoS (Distribution Use of System) charges in UK market
SCENARIO 4 – Frequency regulation / emergency load shedding
Number of Events per year: random (Poisson), mean of 10/year.
DR Programme: Decentralised FD/AS (FCDM in UK Market)
Slide 23Main lessons learned
Demand Response TRL shifted from 1 to 3 in order to
enable the demonstrations;
5 DR scenarios were implemented, ranging from manual
response scenarios (TRIAD) to fast-acting automatic
control scenarios (FFR).
Demand shifting/demand reduction has been recorded in
response to each of the generated DR events. Statistical
analysis is needed to fully gauge effectiveness/depth and
economic benefits of the solution architecture…
Slide 24DR-BOB The French Pilot PEREVOZCHIKOV Igor
The French pilot site
     Country: France
     Region: Nouvelle-Aquitaine                                        Training centre of The
     City: Anglet                                                      Compagnons du Tour de France
                                                                       (training center for building
                                                                       trades)
     GPS coordinates:
     Latitude N +43° 28’ 24,0882’’
     Longitude W -1° 30’ 37,8786’’

                                                                          Research and Technology Organisation Nobatek/INEF4
                                                                          (office building)
                                                                          NOBATEK/INEF4 is a coop open innovation center developing new
                                                                          solutions for sustainable buildings and cities in France, Europe
Arkinova Business Incubator                                               and worldwide.
Dedicated to sustainable and bio-
construction start-ups

                                                      Annual energy
           French demonstration site     Year of                      Number of       Net floor       Number of permanent
                                                      consumption,
                   buildings           construction                     levels        area, m2            occupants
                                                          MWh
       Nobatek building (NBK)             2009             66             3              843                     35
       Training center of Compagnons      2012            112             2             3850                     80
       du Tour de France(FCMB)
       Business Incubator (GA)            2016             70             2              1810                    20

                                                                                                                                             Slide 26
Architecture implemented at the pilot site
DRTRL before the
implementation of the
DR-BOB solution : 1
DRTRL level after the
implementation of the
DR-BOB solution: 3
Slide 27Running the demonstrations
Scenario # and name Purpose Duration, Real signal/
FR site hours simulated signal?
1 Electric demand Demonstrate a potential of 8
reduction controlling assets in block of
buildings in response to a market
signal related to a national
French consumption
3 Gas demand reduction Local gas optimization for 1 Simulated signal
heating/ Gaz demand reduction
4 Peak power demand Peak-power demand reduction 1 Simulated signal
reduction
5 Virtual microgrid or Matching of buildings’ 5 Simulated signal
Sharing of electric consumption to the local energy
energy inside the generated by PV panels on one
demonstration site area building
Slide 28Running the demonstrations
Scenario # and Operation Buildings Building assets involved
name involved
FR site
1 Electric demand Loads shifting, loads shedding, BI, NBK,
reduction preheating FCMB
3 Gas demand Switch from gas-fired boiler to FCMB
reduction the woodchip boiler, preheat,
decrease ambient temperature
setpoints
4 Peak power Loads shifting, loads shedding, BI, NBK,
demand preheating FCMB
reduction
5 Virtual microgrid When locally generated energy BI, NBK,
or Sharing of totally meet and excess FCMB
electric energy electricity demand of buildings
inside the host, the excess of this energy
demonstration could be “virtually” shared with
site area other buildings inside the BOB
Slide 29Running the demonstrations
Scenario # and name Number of DR events in 2018
FR site that have occurred and are expected to come
Jan Feb Mar Apr May Jun Jul Aug Sep Oct Nov Dec
1 Electric demand reduction 12 1 2
3 Gas demand reduction 11 2
4 Peak power demand 6 3 12 1 2
reduction
5 Virtual microgrid or 5 2 2 1
Sharing of electric energy
inside the demonstration
site area
Slide 30The results
Scenario # and name Impact for building managers Average energy
FR site shifted (not a
final result),
kWh
1 Electric demand reduction Financial savings and raise of 244
awareness between occupants
3 Gas demand reduction Gas and financial savings 22,86
4 Peak power demand Financial savings and raise of 14,49
reduction awareness between occupants
5 Virtual microgrid or Sharing Financial savings Up to 45 kW per
of electric energy inside hour
the demonstration site
area
Slide 31Main lessons learned
Buildings need to be highly instrumented to participate into
DR programs
Buildings should be equipped with Building Management
Systems to allow monitoring of building’ assets during DR
events
Blocks of small office buildings can participate into CPP
(Critical Peak Pricing), Capacity Bidding, DLC (Direct Load
Control) and DER (Distributed Energy Resources) programs
Blocks of small office buildings can’t participate into Fast DR
Dispatch/Ancillary Services programs requiring a very fast
(even immediate) manual action on building assets
Building managers should be notified about incoming events at
least 24 hours before event begins
Engagement of occupants into energy shifting actions depend
from the local context of building
Slide 32Pilot site DRTRL
Slide 33DR-BOB
The ROMANIAN Pilot
Dr. Andrei CECLAN
Andrei.Ceclan@ethm.utcluj.roThe Romanian pilot site
Faculty of Electrical Engineering Student’s Dormitories
Net floor area (m2): 10.565 Net floor area (m2): 17.376
Occupants: 765 Occupants: 2700
Slide 35The Romanian pilot site
Faculty of Building Services Swimming Pool Complex
Net floor area (m2): 5.725 Net floor area (m2): 6.616
Occupants: 500 Occupants: 200
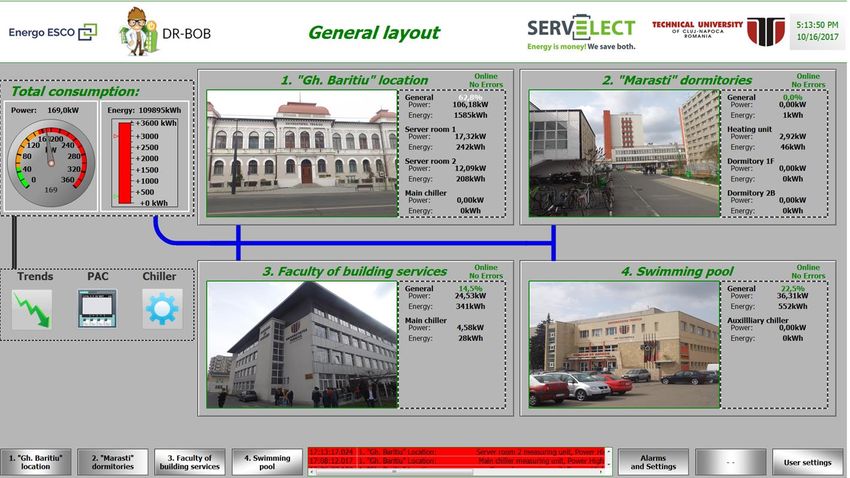
Slide 36Implemented BEMS – interface
Slide 37TV Screens at the entrance
of Romania pilot site buildings
Slide 38Running the demonstrations
Number of DR events in 2018
that have occurred and are expected to come
Scenario # RO site
Jan Feb Mar Apr May Jun Jul Aug Sep Oct Nov Dec
1 Virtual Critical Peak - - - 1 2 2 3 2 2 3 4 3
Pricing with Automated
Control
2 Explicit Demand - - - - - 3 2 1 2 2 2 2
Reduction in Student
Dormitories - Manual
3 Virtual ToU Tariff with - - 2 1 - 3 1 - 3 3 2 3
Schedules Response
Slide 39The results Facts and figures – DR event (1)
Slide 40The results Facts and figures – DR event (2)
Slide 41Running the demonstrations–record of events
Scenario Date Hours Assets opted in Comments
2, 3 09.03.2018 18:00-19:00 Student’s Dormitories Some TV football game
there…
2, 3 22.03.2018 17:00-18:00 Student’s Dormitories Group instruction at each
floor level
2, 3 26.04.2018 20:00-21:00 Student’s Dormitories -
1, 3 26.04.2018 11:00-12:00 Swimming Pool Complex Automated control, with
Staff involvement
1, 3 10.05.2018 11:00-12:00 Faculty of Electrical Engineering Decisive Administrator
involvement
1, 3 31.05.2018 12:00-13:00 Faculty of Building Services Low energy use in fact
2, 3 07.06.2018 20:00-21:00 Student’s Dormitories Students competition
2, 3 22.06.2018 20:00-21:00 Student’s Dormitories -
1, 3 22.06.2018 11:00-12:00 Swimming Pool Complex Easy control
Slide 42Preliminary cost-benefit analysis
Slide 43Preliminary cost-benefit analysis
Slide 44Opportunity
Romanian Demand Reponse
potential market
≈ 100 M Eur/year
Slide 45Pilot site DRTRL
Slide 46DR-BOB The Italian Pilot Jorge Federico Galluzzi
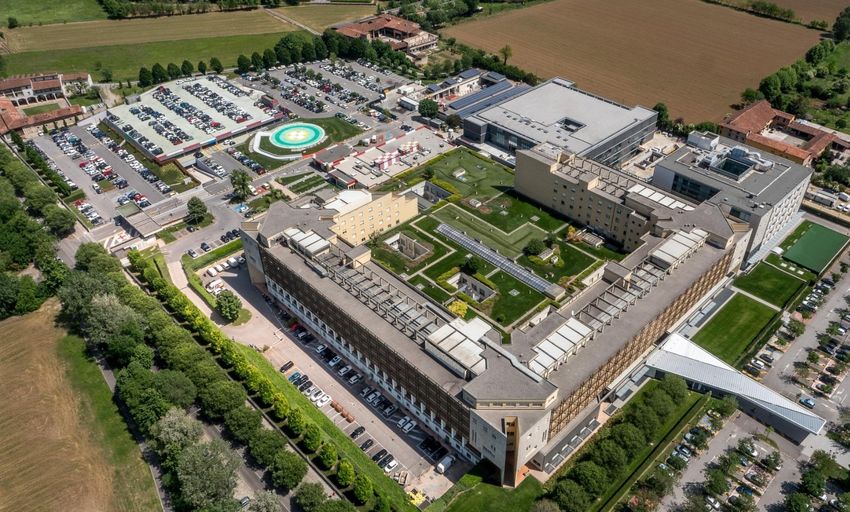
Numbers of Fondazione Poliambulanza
Fondazione Poliambulanza (FP) is a private nonprofit hospital,
located in the city of Brescia (Northern Italy, 90km from Milan)
Every day Yearly energy consumption
> 5,000
4,500 MWh
5,000,000 m3
Inpatients / ER visits / outpatiens / 8,000 MWh
employees / visitors
GM 1 Slide 48The italian pilot site
Main BUILDING
• Year of construction: 1997
• Number of levels: 6
• Net floor area 37,000 m2
Inpatient BUILDING
• Year of construction: 2012
• Number of levels: 7
• Net floor area 8,500 m2
Operating Rooms BUILDING
• Year of construction: 2016
• Number of levels: 4
• Net floor area 9,000 m2
Research CENTER - CREM
• Year of construction: 2001
• Number of levels: 2
• Net floor area 2,200 m2 49
Slide 49Architecture implemented at the pilot site
Before the DR-BOB project only a BMS was installed but during the project:
• Power meters were installed and data is collectet to a energy monitoring SW
• Data is transfer every 15min to the LEM (ftp server)
• Energy baseline was created and DR action are evaluated
machine Command Monitoring
BMS
50
Slide 50Architecture implemented at the pilot site
Name Purpose Operation
Scenario 1 The scope of the DR action it to reduce load as The action will use the inertia of the cooling circuit
Load curtailment or shedding chillers much as possible during a given interval of time to minimise impact on occupants' comfort. The
loads which is expected to be a CPP interval. temperature set-point of the chillers will be reduced
(lower temperature) before the starting time of the
CPP interval and then increased at the time of the
event
Scenario 2 Reduce small power demand when requested as a The energy manager will send emails to
Load shedding of small loads consequence of dynamic electricity cost (in administration staff requesting the action. These will
combination with scenario 4) also be asked to provide a feedback
Scenario 3 Shift use of food carts of 30 minutes with respect to The facility manager will coordinate this with the
Load shifting of important loads usual schedule (TBD) as a consequence of dynamic canteen staff
electricity cost (in combination with scenario 4)
Scenario 4 Scope to this scenario is to optimise use of the The energy manager receives the optimised schedule
Self-consumption and heat recovery from generation assets of the hospital in order to and operational parameters and controls assets
CHP power plant minimise energy cost. this involve all energy vectors through the BMS accordingly. Electric energy
(electricity, heat, coolth, gas, steam - see image absorption is obtained shifting loads on gas
below) and is done on a daily basis consumption.
For safety reasons, due to the kind of service the hospital provides and for a lack of explicit DR
programs in Italy, in DR-BOB project all the scenarios were run manually by the energy manager
team.
Slide 51Running the demonstrations
Scenario # Number of DR events in 2018
@ Fondazione Poliambulanza (FP) that have occurred and are expected to come
Jan Feb Mar Apr May Jun Jul Aug Sep Oct Nov Dec
Load curtailment or
1 shedding of HVAC and 2 2 3 4 3
chillers loads
Load shedding of small
2 loads 1 1 1 1 3
Load shifting of important
3 loads 1
Self-consumption and
4 heat recovery from CHP 1 1 3 4
power plant
Slide 52Implementation of DR scenarios
Report of DR events
Scenario 1+4 BEST combination to have longer and higher energy
reductions
Slide 53Implementation of DR scenarios -20 %
peak power demand
Report of DR events
B
Scenario 1+4
Event # date time
1.2 28/06/2018 11:00-12:00
D
C
Event 1.2
B: 3/3 Tchiller flow = 5°C
C: 1/3 Tchiller flow = 8°C
2/3 chillers off
D: 3/3 Tset-point = = 7°C
Slide 54Implementation of DR scenarios
Report of DR events
Scenario 1+4 Event
1.200
1.000
Cooling capacity
absorption chiller
800
-33%
600
Electric
Energy from
400
the Grid
Pre-cooling
200
Electric power
chiller
0
Generale EE acquistata [kW] Trige_assorbitore Energia Frigo (kW) TRANE 4 potenza istantanea (KW)
Slide 55Main lessons learned
The more people involved the less the power reduction is
predictable and replicable;
A full automation in the control of HVAC systems by a
BMS makes the DR more effective;
The design of the plant architecture (hydraulic and
aeraulic circuits) and machine (chiller and boilers) can
help to reach better results in energy reduction.
Slide 56Pilot site DRTRL
Slide 57You can also read