The transition towards an environmental sustainability for Cryptocurrency mining
←
→
Page content transcription
If your browser does not render page correctly, please read the page content below
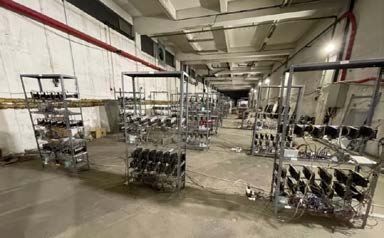
E3S Web of Conferences 294, 03004 (2021) https://doi.org/10.1051/e3sconf/202129403004 ICSREE 2021 The transition towards an environmental sustainability for Cryptocurrency mining Ioan Bitir-Istrate1, Cristian Gheorghiu2,*, and Miruna Gheorghiu3 1 University Politehnica of Bucharest, Energy Production and Use Department, 313th Splaiul Independenţei, Bucharest, Romania 2 University Politehnica of Bucharest, Energy Production and Use Department, 313th Splaiul Independenţei, Bucharest, Romania 3 Elsaco ESCO L.L.C., 500th Mihai Bravu Boulevard, Bucharest, Romania Abstract. As Cryptocurrency becomes more and more popular so does its demand for mining rigs. At the end of 2020 there were approximately 5,392 different cryptocurrencies available with a total market capitalization of more than $201bn [1]. Cryptocurrencies are using decentralized, distributed systems in order to operate. The mining process involves solving cryptographic equations, which are ultimately used for ensuring encryption of the blockchain transactions, through the use of IT equipment - the most efficient way of doing it being by building mining farms which use Graphics Processing Units (GPUs). The Crypto farmers are rewarded with a share of the transaction they facilitate. As the Cryptocurrency market grows exponentially every year, so does its hunger for energy. For example, the Bitcoin Energy Consumption Index is evaluated to reach 77.782 TWh/year in 2021 [2], which, for comparison, is approximately 1.5 times larger than the entire electricity consumption of Romania in 2020 [3]. In this paper, the transition of Cryptocurrency mining processes towards environmental sustainability will be analysed. A Crypto-farm's Energy Performance Indicators (EPI) and Power Quality Indices (PQI) will be evaluated and, with the use of dedicated software solutions, the authors will propose an action plan to minimize the environmental impact of the energy boundary and to maximize the EPI, thus maximizing the profitability of this new type of business. 1 Energy boundary description implies that the farm has to constantly verify cryptocurrency transactions by decrypting crypto blocks The case study is a cryptocurrency farm located in (usually 1 MB of data / block – which can usually contain Bucharest, in a warehouse that was retrofitted for this several thousand transactions). The verification / business. The warehouse has a useful surface of 4,000 m2. decryption process is rewarded with a small share of the As cryptocurrency transactions are based on a public cryptocurrency as long as the proof of work or hash is key encryption, also known as an asymmetric encryption. obtained. Cryptocurrencies use a decentralized ledger known as The hash is a 64-digit hexadecimal number that is less blockchain, which is essentially a series of chained data than or equal to the target hash (transaction encryption). blocks that contain key pieces of data, including It can be thus concluded that the Hash-rate (MH/s, GH/s, cryptographic hashes. TH/s) of the mining rig severely impacts the economic The creation of blockchain requires the existence of efficiency of the business. nodes (individual devices that exist within the The Capital Expenditures (CAPEX) for setting up the blockchain), miners (specific nodes that verify (solve) business are estimated at 450,000 EUR, out of which the unconfirmed blocks in the blockchain by verifying the actual implementation costs (IC) were approximatively hashes, transactions (separate transactions are bundled 100,000 EUR and included retrofitting the existing and form a list that gets added to an unconfirmed block), electricity distribution network of the warehouse, hashes (one-way cryptographic functions used by nodes installing ventilation modules, ICT network design and to verify the legitimacy of transactions which are installation and programming the GPU’s. generated by combining the header data from the previous The rest of 300,000 EUR were used for building the blockchain block with a nonce), a consensus algorithm (a mining rigs. The farm is made up of 100 rigs, as presented protocol within blockchain which helps different nodes in Fig. 1, out of which: come to an agreement whilst verifying data – Proof of 30 rigs have 13 Nvidia P104-100 8 GB Ram and MB Work and blocks (individual sections that contains a list Asus B250 Mining Expert 4 GB Ram, 120 GB SSD of completed transactions – a block that was verified Memory and an IBM 2,880W power supply. These cannot be later modified). rigs mine ETH (Ethereum) at 470 MH/s with an The cryptocurrency mining business is extremely average electricity use of 2 kWh/h. Each rig mines dependent on the mining power of the rigs as the process 0.9 ETH/month; * Corresponding author: cristian.gheorghiu@upb.ro © The Authors, published by EDP Sciences. This is an open access article distributed under the terms of the Creative Commons Attribution License 4.0 (http://creativecommons.org/licenses/by/4.0/).
E3S Web of Conferences 294, 03004 (2021) https://doi.org/10.1051/e3sconf/202129403004 ICSREE 2021 70 rigs have 6 AMD RX 580 8 GB Ram, 120 GB SSD In order to do so, firstly, relevant EPI’s to be Memory and an HP 1,200 W Power Supply. These determined must be selected. rigs mine ETH at 200 MH/s with an average Considering that the energy boundary has no need for electricity use of 1 kWh/h. Each rig mines 0.4 any other form of energy except electricity, the most ETH/month. relevant EPI is the specific electricity use ( ), The ventilation system is made up of 44 high capacity determined with equation (1): fans with a rated power of 0,75 kW. This leads to a low ℎ efficiency cooling of the mining rigs. = � � (1) The warehouse lighting system is comprised of 10 where [MWh/year] is the annual electricity use and LED lamps with an installed power or 150W/lamp. The [ETH/year] is the yearly ETH generated by the warehouse also has a close circuit tv (CCTV) system. mining rigs. The environmental sustainability of the business can be evaluated by determining the specific equivalent CO2 emissions generated over a year ( 2 ) , with equation (2): 2 2, 2 = � � (2) 2 where [tons CO2,eq/year] is the annual CO2 equivalent greenhouse gases emission determined by using the average conversion factor for Romania of 355 gCO2,eq/kWh [5]. The global EPI used was Energy Intensity (EI) which Fig. 1. Cryptocurrency farm overview (Ventilation system not was determined by using equation (3): shown) . . . The total cryptocurrency mining capacity of the = � � (3) ∙ 103 system is of approximatively 55 ETH/month. At a price where [t.o.e./year] is the annual equivalent energy use of 2,007.74 USD/ETH, the monthly generated income is of the energy boundary, expressed in tons of oil equivalent 110,425.70 USD/month, respectively 1,099,840 (t.o.e.) and [thousand EURs/year] is the yearly EUR/year. The viability of the business if also proven by production / income generated. the evolution of ETH in the last 12 months, as seen in A fourth relevant EPI used in order to financially Fig.1. quantify the sustainability of the business is the specific Considering an 8,600 hours/year operation time, the CO2 equivalent emission reported to the yearly production average yearly electricity use for the mining rigs is / income, determined with equation (4). 1,123.2 MWh/year. The existing ventilation system has an 2 2, average yearly electricity use of 171 MWh/year. The total 2 = � � (4) ∙ 103 yearly electricity use is approximatively 1,294.27 The resulting baseline EPI’s are presented in Table 1. MWh/year . As the warehouse has a medium voltage connection via a 400 kVA power transformer, the Table 1. Baseline EPI values electricity price is approximatively 70 EUR/MWh. EPI Value Measuring Unit (M.U.) Considering ICT maintenance and periodical upgrades of the system, which amount to 5,000 EUR/month, the 1.96 MWh/ETH 2 yearly operational costs (OPEX) rise to an average of 0.70 tons CO2,eq/ETH 150,599 EUR/year. 0.0840 t.o.e./thousand EUR 2 0.418 tons CO2,eq/thousand EUR As it can be observed, the EI of the cryptocurrency mining business is similar to various other production sector business, with an average variation range of 0.06 – 0.1 t.o.e. per thousand EUR, close to the global average of 0.134 t.o.e. per thousand EUR [6]. 3 Power Quality Analysis Fig. 2. ETH price evolution 20.02.2020 – 20.02.2021 [4] As the energy boundary is powered by a 400 kVA Power Transformer that also ensures the power supply of 2 other 2 Energy Performance Analysis warehouses, in order to properly analyse the Power Quality influence of the mining rigs, without overlapping The first step in proposing a practical guide for electromagnetic perturbances and multiple PQI values in transitioning towards an environmental sustainability for the point of common coupling, the PQI analysis was done the Cryptocurrency mining business is to properly over a period of time in which only the cryptocurrency establish the energy baseline and the energy performance farm was operating. baseline for the analysed energy boundary. 2
E3S Web of Conferences 294, 03004 (2021) https://doi.org/10.1051/e3sconf/202129403004
ICSREE 2021

 By using a Chauvin Arnoux C.A. 8336 Power Quality 4 Energy Performance Improvement
 and Energy Analyzer in the Point of Common Coupling Actions
 (PCC) over a period of 7 days, the following PQI values,
 presented in Table 2 and Table 3, were measured / The main issues identified within the analysed energy
 determined. boundary are presented in Table 4.
 Table 2. PQI Values Table 4. EPI / PQI atual status
 PQI Value M.U. Indicator Value Issue Impact
 393.86 High Electricity Use
 Voltage 396.16 V 0.0840 Large High Environmental Impact
 392.10 High Reactive Energy Input
 90.05 PF 0.23 Small Lowers the transit capacity of
 Current 98.98 A the local distribution grid
 105.05 Additional Losses in the power
 Frequency 49.99 Hz THDI 148.2 Large distribution grid, High
 Environmental Impact
 Power Factor 0.23 -
 Voltage Total 2.92
 Harmonic Distorsion 2.75 % To mitigate the various issues identified in the energy
 Factor (THDV) 2.56 analysis stage, the EPIAs presented in Table 5 were
 Current Total 115.93 evaluated from a technical and economical point of view.
 Harmonic Distorsion 146.26 %
 Factor (THDI) 182.43 Table 5. EPIA proposals

 Table 3. PQI Testing EPIA Impact
 Reduce Electricity Use
 Modernizing the cooling Dimish the environmental
 PQI Limits PASS TEST system impact
 Voltage: 400 ±10% V [7] Yes
 Implementing a Diminish the environmental
 Frequency: 50±1% Hz [8] Yes impact
 photovoltaic (PV) system
 Power Factor: 0.90a. No Improving PQI values
 THDV : 8% [9] Yes Installing Active Filters in
 Diminish the environmental
 THDI : 20% [10] No the PCC impact
 a. Set by the end-user in order to minimize the reactive energy The main criterions used in the technic and economic
 bill
 analysis of the EPIAs were the Net Present Value – NPV
 As it can be observed in Table 3, the analysed energy
 (7), the Internal Rate of Return – IRR (8), the Simple
 boundary failed to pass the THDI test [10] and the Power
 Payback Period (9), determined by considering a variable
 Factor Testa. annual net income and the Benefit – Cost Analysis – BCA
 The other PQI limits were easily respected by all CNC (10).
 machines.
 −
 As [11] has demonstrated, the abnormally large THDI = � − [ ] (7)
 (1 + )
 values are generated by the power sources which ensure =1
 the DC power to the mining rigs. where ttst is the analysis time-frame, in years, selected as
 However, as proven in [12], THDI values are highly per [13], It is the yearly income in the tth year, in
 impacting the energy losses in the Power Transformer. EUR/year, Ct are the yearly expenditures in the tth year, in
 The influence of the current harmonics on the overall EUR/year, a is the discount rate – 9.86%/year for this end-
 energy losses can be determined by applying equation (5): user and IC is the investment cost, in EUR.

 ∆ ℎ = ∙ 2 −
 ∞ = � = 0 [ ] (8)
 (1 + )
 = ∙ � 12 + � 2 � [ ] (5) =1
 =2 where the CAPEX can be included in the yearly
 ∆ ℎ = ∙ 12 ∙ (1 + 2 ) [ ] expenditures as a depreciation cost.
 where Rnet [Ω] is the analysed networks resistance,
 = [ ]
 determined with (6), I1 [A] is the average fundamental ∑ =1 − (9)
 root-mean-square value of the electrical current, In [A] is

 the average root-mean-square value of the nth rank = [−] (10)

 current harmonic and THDI [%] is the average measured An average escalation rate for electricity prices of
 total current harmonic distortion factor. 5%/year was also considered, as determined in [14].
 = 0 ∙ + [Ω] (6) The actual cooling system should be replaced with a
 where 0 [ Ω/km] is the specific resistance of the centralized high efficiency cooling system, as displayed
 electric wires, [km] is the length of the considered in Fig. 3. The Hot-Aisle Containment System (HACS)
 electric network and [Ω] is the power transformer was proposed as it has been proven to lower the electricity
 internal resistance. use by up to 40% compared to the Cold-Aisle
 Containment System (CACS).
 This system also allows for an optimization of the
 space in the warehouse, where all the 100 mining rigs will

 3
E3S Web of Conferences 294, 03004 (2021) https://doi.org/10.1051/e3sconf/202129403004
ICSREE 2021

 be included in a single HACS by regrouping the GPUs in The reduction of the THDI will also lead (as per
 order to minimize the number of racks required. equation (5) and (6)) to a decrease in the total active
 The IC of this EPIA is approximatively 30,000 EUR. energy losses of up to 18%, which amounts to
 The yearly Ct is estimated at 2,000 EUR/year. The annual approximatively 30 MWh/year.
 electricity use of the system is estimated to be of up to 90 The Technical and Economic Analysis results for all
 MWh/year. The timeframe analysis was considered to be three EPIAs will be presented in Table 7.
 10 years.
 Table 7. EPIA Economic Analysis results

 NPV IRR SPP BCA
 EPIA
 [EUR] [%] [years] [-]
 HACS 1,717 12 7.33 1.06
 PV System 325,138 20 6.62 2.24
 APF 53,396 73 2.33 3.32
 As it can be observed from Table 7, all three EPIA’s
 lead to positive financial results over the study period. The
 end-user should be highly motivated to implement all
 three EPIA’s as the total NPV reaches 380,251 EUR.
 Fig. 3. Hot Aisle Containment Cooling System [15]
 As the warehouse is the end-user’s propriety, the PV
 System can be installed on it’s roof. The proposed PV 5 Sustainability Improvement Analysis
 System will be presented in Table 6. By using RETScreen
 Expert software the estimated efficiency and expected By implementing the Energy Performance Improvement
 electricity production were determined. The simulation Plan (EPIP) presented in Chapter 5, a major
 results are also presented in Table 6. Environmental Impact Reduction (EIR) will also be
 achieved.
 Table 6. PV System and Simulation results In order to quantify the yearly and life-cycle EIR, the
 Value M.U.
 methodology presented in [5] was used. The electricity
 Component
 -
 conversion factor of 355 gCO2equivalent/kWh was
 PV Panel type CS3W-410P
 Panel rated Power 410 Wp considered. The conversion factor also considers the
 Rated efficiency 18.56 % energy losses in the national power grid, which for
 Installation angle 30 ˚ Romania are situated at approximatively 7% for a Low
 Technical waranty 25 Years Voltage (LV) internal distribution grid.
 Quantity 1,000 Pcs. The EIR was determined and will be presented in
 System Peak Power 400 kW Table 8.
 Inverter rated power 100 kW As it can be observed, by implementing the EPIP, the
 Number of Inverters 4 Pcs. end-user can obtain a total EIR of 250.38 tons of CO2
 Expected electricity production 595.307 MWh/year equivalent / year, respectively 5,631.25 tons of CO2
 Considering an investment cost of 656 EUR/kWp, as equivalent for the EPIP Lifecycle.
 determined by the authors consultancy experience, the The EIR amounts to approximatively 54.49 of the
 total IC for the EPIA is of approximatively 262,400 EUR. annual CO2 equivalent emissions. This will lead to an
 The Ct for the PV system will be less than 2,500
 overall improvement of the 2 to a va lue of 0. 19 to ns
 EUR/year, as the system will not be exposed to excessive
 dusting and as Bucharest does not have particularly heavy of CO2 equivalent per thousand of EUR of income.
 winters or significant number of hailstorms. Table 8. EPIA Economic Analysis results
 Installing an Active Filter (see Fig. 4) in the PCC will
 generate an additional IC of approximatively 23,000 EUR EPIA EIR [tons CO2 eq / year]
 with an annual Ct of 3,000 EUR/year. By implementing HACS 28.40
 this EPIA the end-user will obtain a THDI reduction of up PV System 211.33
 to 90% and a PF improvement of up to 0.92, thus APF 10.65
 minimizing the reactive energy bill. The actual reactive TOTAL 250.38

 energy bill is approximatively 1,500 EUR/month. The
 timeframe analysis was considered to be 6 years. 6 Conclusions
 If a linear electricity use escalation with regard to mining
 capacity is considered when analysing the Cryptocurrency
 Mining businesses, it is strongly recommended that a
 novel regulatory framework should be developed.
 Considering the ETH mining power use (24.26
 TWh/year), presented in Fig. 5, by extending the
 implementation of the proposed EPIP to the whole sector,
 an overall EIR of up to 4,693,230 tons of CO2
 equivalent/year, which represents 5% of all of Romania’s
 Fig. 4. Active Power Filter (APF) [16] latest reported CO2 emissions.

 4
E3S Web of Conferences 294, 03004 (2021) https://doi.org/10.1051/e3sconf/202129403004
ICSREE 2021

 systems, for equipment with rated current 16 A per
 phase and not subject to conditional connection,”
 (2013).
 8. Energy National Regulatory Agency, “Order no.
 49/2017 for modifying the Power Distribution
 Services Performance Standard,” National Gazette,
 Fig. 5. ETH Energy Consumption Index [17] Part 1, No. 535, (2017).
 As digitalization progresses at a faster than ever rate, 9. International Electrotechnical Commission, “IEC
 a transition towards an environmental sustainability for 61000 group of standards” (2016).
 Cryptocurrency mining policy is required to ensure the
 10. Institute of Electrical and Electronics
 organic and ecological development of this sector.
 Engineers,”IEEE 519-2014 Recommended Practices
 The regulatory framework should guide both new
 and Requirements for Harmonic Control in Electrical
 crypto-miners and existing ones in optimizing their
 Power Systems,” (2014).
 electricity use and minimizing their Environmental
 Impact. 11. A.M. Blanco, J. Meyer, A. Pavas, C.A. Garzon, M.
 Rules and regulations regarding the necessity of Romero and P. Schegner, “Harmonic distortion in
 ensuring at least 50% of the electricity use by means of public low-voltage grids Comparison of the situation
 using alternative, clean, energy sources and the necessity in Colombia and Germany,” Ingineria e
 to use Best Available Technologies (BAT) when Investigacion, Vol. 35, Sup. No.1, pp. 50-57, (2015).
 equipping the cryptocurrency farm should also be drafted 12. C. Gheorghiu, M. Scripcariu, S. Gheorghe and R.
 up as soon as possible the national, European and Porumb, “Energy Efficiency and Power Quality
 International policy makers. Indicators of a Micro Grid. Case Study: Lighting
 If every cryptocurrency mining business owner will Systems,” 8th International Conference on Modern
 always choose the BAT regarding the GPUs and Power Power Systems (MPS), DOI:
 Supply, the same cannot be stated about lighting, cooling 10.1109/MPS.2019.8759734, (2019).
 and power quality mitigation. The new cryptocurrency 13. The Romanian Government, “Decision no.
 policy should mandate the minimum efficiency level that 2139/30.10.2004 for approving the normal period of
 is acceptable for these three types of equipment, in order use for capital goods,” Official Gazette, Part I, No.
 to fully optimize the electricity use in the individual 46/13.01.2005.
 energy boundaries.
 14. Ioan-Sevastian Bitir-Istrate, Cristian Gheorghiu and
 Miruna Gheorghiu, “The Cost of Indecision in
 References Energy Efficiency. A Cost of Opportunity Analysis
 for an Industrial Consumer,” 55th International
 1. https://finance.yahoo.com/news/top-10- Scientific Conference on Information,
 cryptocurrencies-market-capitalisation- Communication and Energy Systems and
 160046487.html, accessed 02.01.2021 Technologies (ICEST), DOI:
 2. Alex de Vries, “Bitcoin’s energy consumption is 10.1109/ICEST49890.2020.9232894, (2020).
 underestimated: A market dynamics approach,” 15. John Niemann, Kevin Brown and Victor Avelar,”
 Energy Research & Social Science, Vol. 70, Hot-Aisle vs. Cold-Aisle Containment for Data
 https://doi.org/10.1016/j.erss.2020.101721 (2020) Centers,” Schenider Electric, American Power
 3. Enerdata, “Romania Energy Report,” (2020) Conversion, West Kingston, RI, White Paper No.
 4. https://www.coindesk.com/price/ethereum, accessed 135, (2008).
 20.02.2021 16. Kouadria, Abdeldjabbar Mohamed and T. Allaoui.
 5. European Investment Bank, “EIB Project Carbon “Adaptive Hysteresis Band Based Fuzzy Controlled
 Footprint Methodologies: Methodologies for the Shunt Active Power Filter.” International Conference
 Assessment of Project GHG Emissions and Emission on Industrial Engineering and Operations
 Variations,” (2020) Management (IEOM), (2017).
 6. International Energy Agency, “Energy Efficiency 17. https://digiconomist.net/ethereum-energy-
 https://www.iea.org/reports/energy- consumption/, accessed 01.03.2021.
 Indicators”,
 efficiency-indicators, (2020)
 7. International Electrotechnical Commission, “IEC
 61000-3-3 Electromagnetic Compatibility – Part 3-3:
 Limits – Limitation of voltage changes, voltage
 fluctuations and flicker in public low voltage supply

 5
You can also read