Investor Presentation
As of March 31, 2021
    Nasdaq: RRBI

            Made in Louisiana. Made for Louisiana.
←
→
Page content transcription
If your browser does not render page correctly, please read the page content below
Investor Presentation
As of March 31, 2021
Nasdaq: RRBI
Made in Louisiana. Made for Louisiana.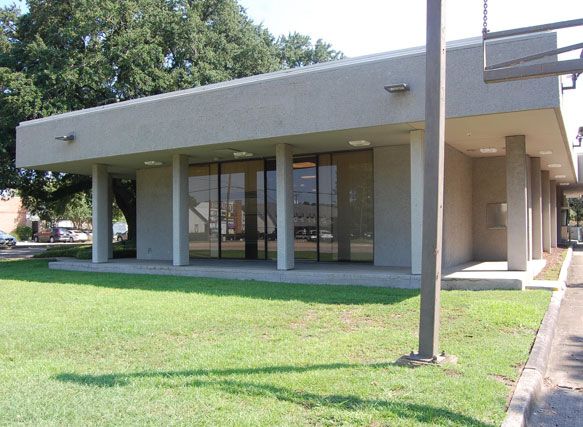
Forward‐Looking Statements and Non‐GAAP Information
This presentation contains forward‐looking statements that are based on various facts and derived utilizing numerous important assumptions and are subject to known and
unknown risks, uncertainties, and other factors that may cause Red River Bancshares, Inc.’s (the “Company,” “RRBI,” “Red River,” “we,” or “our”) actual results,
performance, or achievements to be materially different from any future results, performance, or achievements expressed or implied by such forward‐looking statements.
Forward‐looking statements include the information concerning our future financial performance, business and growth strategy, projected plans and objectives, as well as
projections of macroeconomic and industry trends, which are inherently unreliable due to the multiple factors that impact economic trends. Words or phrases such as
“may,” “should,” “could,” “predict,” “potential,” “believe,” “will likely result,” “expect,” “continue,” “will,” “anticipate,” “seek,” “estimate,” “intend,” “plan,” “projection,”
“would,” and “outlook,” or the negative version of those words, or such other comparable words or phrases are intended to identify forward‐looking statements but are not
the exclusive means of identifying such statements. These forward‐looking statements are not historical facts, and are based on current expectations, estimates, and
projections about the Company’s industry, management’s beliefs, and certain assumptions made by management, many of which, by their nature, are inherently uncertain
and beyond the Company’s control. Accordingly, you are cautioned that any such forward‐looking statements are not guarantees of future performance and are subject to
certain risks, assumptions, and uncertainties that are difficult to predict. Although the Company believes that the expectations reflected in these forward‐looking
statements are reasonable as of the date made, actual results may prove to be materially different from the results expressed or implied by the forward‐looking statements.
Unless required by law, the Company also disclaims any obligation to update any forward‐looking statements. Interested parties should not place undue reliance on any
forward‐looking statement and should carefully consider the risks and other factors that the Company faces. For a discussion of these risks and other factors, please see the
sections titled “Cautionary Note Regarding Forward‐Looking Statements” and “Risk Factors” in the Company’s most recent Annual Report on Form 10‐K and any subsequent

   COMPANY OVERIEW
quarterly reports on Form 10‐Q, and in other documents that we file with the Securities and Exchange Commission (“SEC”) from time to time.

This presentation includes industry and trade association data, forecasts, and information that we have prepared based, in part, upon data, forecasts, and information
obtained from independent trade associations, industry publications and surveys, government agencies, and other information publicly available to us, which information
may be specific to particular markets or geographic locations. Some data is also based on our good faith estimates, which are derived from management’s knowledge of the
industry and independent sources. Industry publications, surveys, and forecasts generally state that the information contained therein has been obtained from sources
believed to be reliable. Statements as to our market position are based on market data currently available to us. Although we believe these sources are reliable, we have
not independently verified the information. While we are not aware of any misstatements regarding our industry data presented herein, our estimates involve risks and
uncertainties and are subject to change based on various factors. Similarly, we believe our internal research is reliable, even though such research has not been verified by
any independent sources.

This presentation contains non‐GAAP financial measures, including tangible book value per share, tangible common equity to tangible assets, and PPP‐adjusted metrics. The
non‐GAAP financial measures that we discuss in this presentation should not be considered in isolation or as a substitute for the most directly comparable or other financial
measures calculated in accordance with GAAP. A reconciliation of the non‐GAAP financial measures used in this presentation to the most directly comparable GAAP
measures is provided in the Appendix to this presentation.

                                                                                                                                                                             2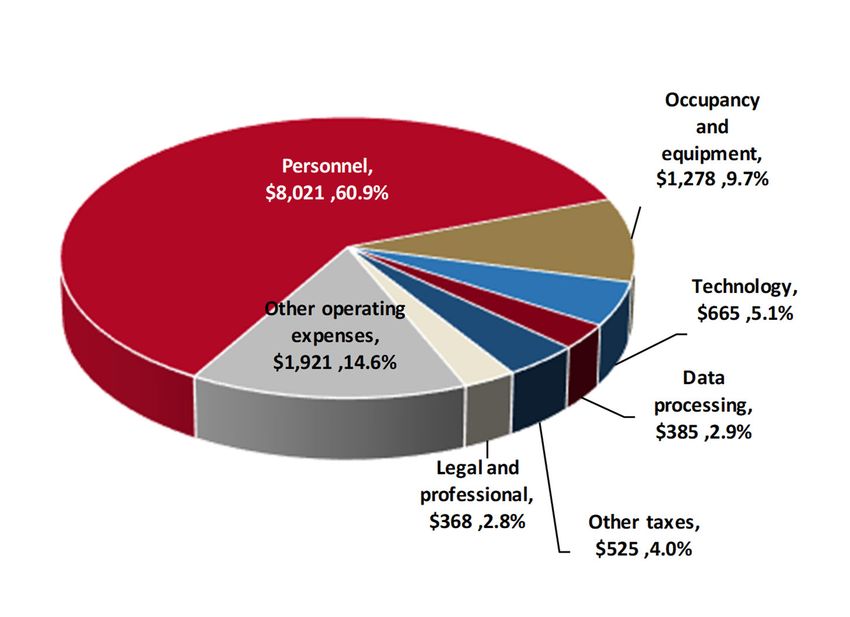
Company Overview
Financial Highlights
Red River Bancshares, Inc. was established in As of and for the Three Months Ended March 31, 2021
(dollars in thousands, except per share data)
1998 in Alexandria, Louisiana; Red River Bank
Assets $2,820,672
opened its doors in January 1999
Loans Held for Investment (HFI) $1,602,086
Completed IPO in May 2019 Deposits $2,515,275
Stockholders' Equity $284,911
Nasdaq: RRBI Tangible Common Equity¹ $283,365
On Russell 2000 Index Stockholders' Equity / Assets 10.10%
Tangible Common Equity / Tangible Assets¹ 10.05%
Third largest Louisiana headquartered bank Leverage Ratio 10.43%
based on assets as of December 31, 2020 Total Risk‐Based Capital Ratio 18.87%
Nonperforming Assets / Assets 0.13%
Relationship‐based approach has yielded a
Net Charge‐offs / Average Loans 0.00%
diverse loan portfolio and core deposits
Allowance for Loan Losses to Loans HFI 1.21%
During 2020 and 1Q21, provided full banking Net Income $8,065
services amid ongoing pandemic Return on Average Assets 1.20%
Return on Average Equity 11.36%
Stock buyback plan in place Net Interest Margin Fully Tax Equivalent (FTE) 2.76%
Consistent quarterly dividend Efficiency Ratio 54.02%
Earnings Per Share, Diluted $1.10
Participating in JAM FINTOP Banktech, L.P. to Book Value Per Share $38.99
strategically develop partnerships to enhance Tangible Book Value Per Share¹ $38.78
digital offerings Cash Dividends Per Share $0.07
¹Non‐GAAP measure. See “Forward‐Looking Statements and Non‐GAAP Information” on slide 2 and “Non‐GAAP Reconciliation” slides in the Appendix for additional
3
information.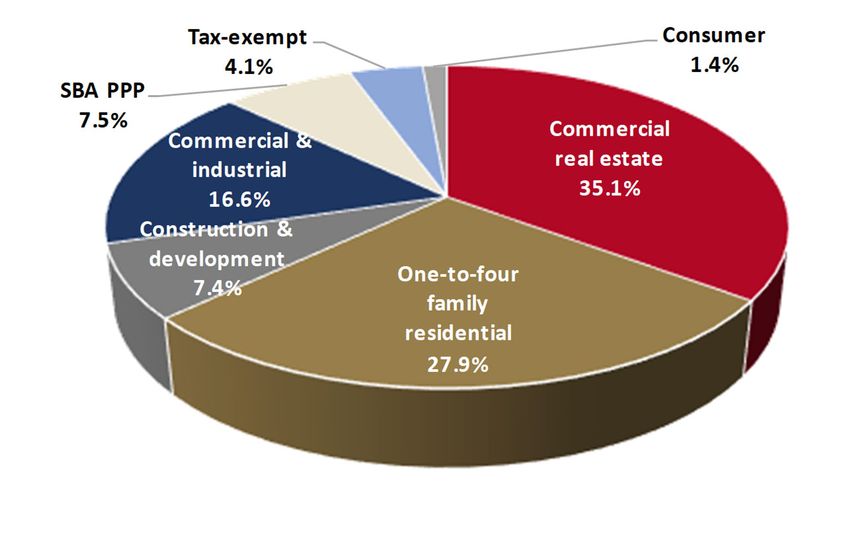
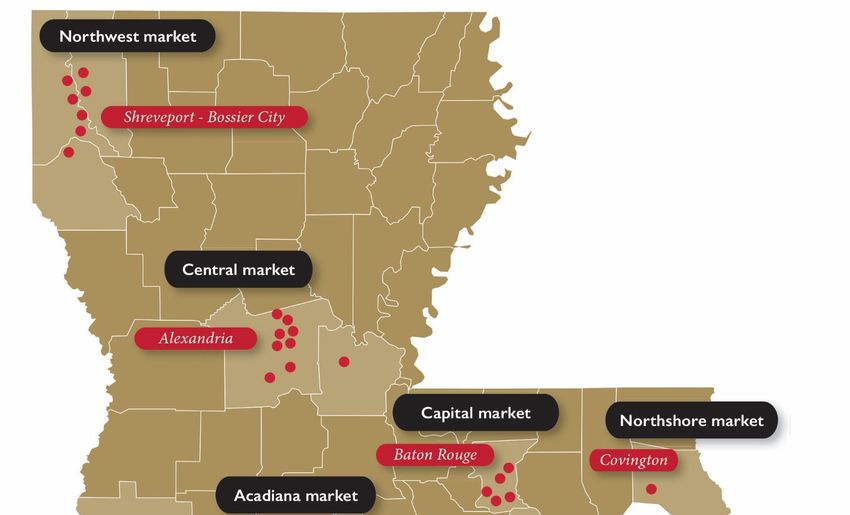
Community Bank Focused on Louisiana

                                      4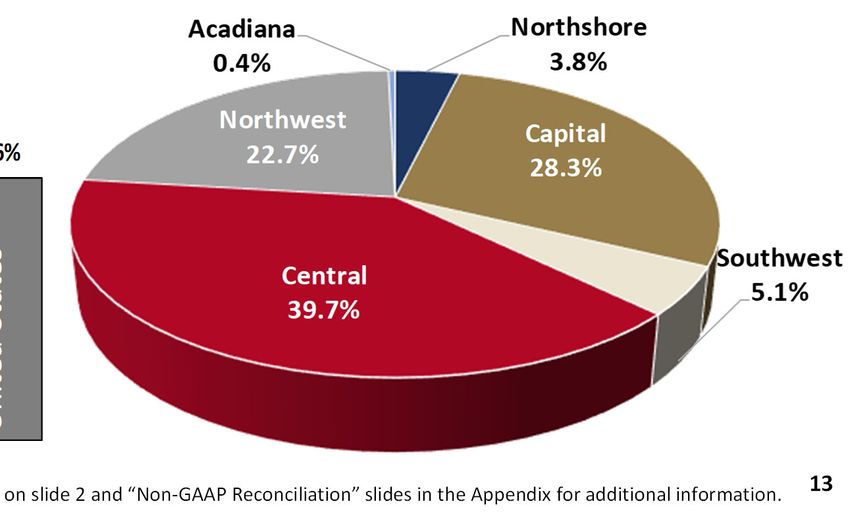
Company Strengths
Consistent financial results and steady growth
Robust deposit and balance sheet growth in 2020 and 1Q21
Conservative credit culture with solid asset quality
Stable, low cost core deposit base
Management and directors own 21.58% of outstanding stock as of March 31, 2021, and are
aligned with shareholder interest of building share value
Continuity of leadership ‐ four of our top executives are part of the founding management
team
Proven ability to grow organically
Focused on Louisiana markets that offer growth opportunity and loan diversification
Disciplined acquisition strategy – successfully integrated two acquisitions and positioned to
capitalize on future opportunities
Strong capital and liquidity positions
5
Recent Expansion Highlights
Purchased existing banking center buildings then rebranded as
Sulphur Red River Bank. Cost effective and fast expansion method
Banking Center
4Q19 – Purchased an existing banking center location in
Sulphur, Louisiana (Southwest market)
1Q20 ‐ Opened a new banking center in Sulphur, Louisiana
3Q20 – Entered Lafayette, Louisiana (Acadiana market). Hired
Lafayette
an experienced banker as Market President. Opened a new
Banking Center
loan and deposit production office
4Q20 – Purchased an existing banking center location in
Lafayette, Louisiana
Under Renovation
Fall 2021 – Planned opening as the 27th Red River Bank
banking center
Lake Charles
Banking Center
4Q20 – Purchased an existing banking center location in Lake
Charles, Louisiana (Southwest market)
2Q21 – Planned opening as the 26th Red River Bank
Under Renovation banking center 6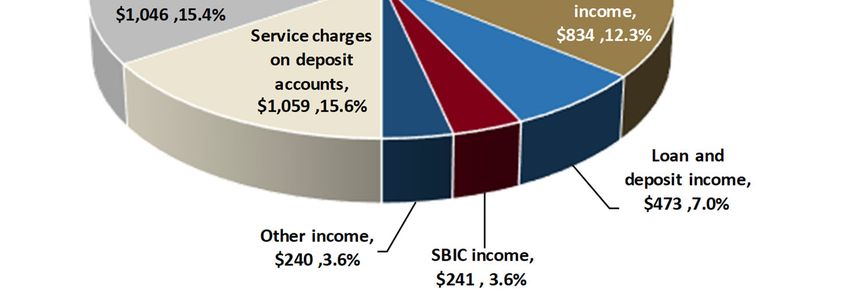
Executive Management and Board of Directors
Update 1Q21
Chief Credit Policy Officer Gary Merrifield
passed away 2Q20
Executive Management Recruited new Northwest Market President
Jennifer Elliott
Previous Northwest Market President
G. Bridges Hall, named as Credit Policy
Officer
Chief Operations Officer for Red River Bank
Jeffrey R. Theiler resigned
Red River Bancshares, Inc. board member,
William Hackmeyer, Jr. passed away 1Q21
Board of Directors Anna Brasher Moreau, DDS, MS appointed
to the Red River Bancshares, Inc. and Red
River Bank boards of directors
John C. Simpson transitioned from role of
Chairman of the Board of the Company and
Red River Bank. Will remain a member on
both boards, serving as Chair Emeritus
Teddy R. Price elected as Chair of the Board
of the Company and Red River Bank 7
Competitive Landscape
Deposits in Louisiana1 Deposit Market Share
As of June 30, 2020 As of June 30, 2020
$124.1 billion
1st Deposit
Red River Banking Deposits Banking Market Market
Bank Markets Center ($M) Centers Rank Share1
Opened
Central 1999 $1,257 9 1st 36.2%
Northwest 2006 $426 7 9th 4.8%
Capital 2013 $387 6 8th 1.9%
Southwest 2018 $14 2 16th 0.3%
Northshore 2019 $10 1 24th 0.2%
Louisiana 1999 $2,094 25 8th 1.7%
Red River Bank has 1.7% of Louisiana deposits (as of June 30, 2020)
One‐third of deposits in the state are held by large national banks, which are reducing their
Louisiana banking center networks
1Source: FDIC, Deposits as of June 30, 2020.
2IberiaBank merged with First Horizon Bank, headquartered in Memphis, TN, in July 2020.
8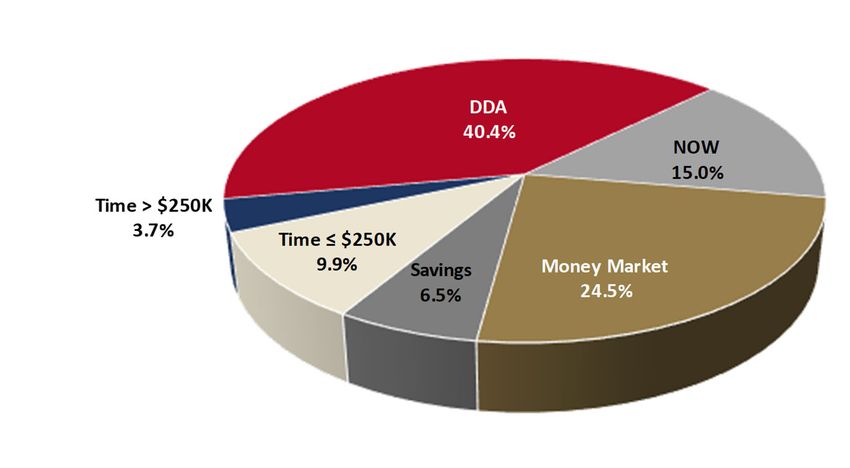
First Quarter 2021 Financial Results
As of and for the
Three Months Ended
Record‐high quarterly net March 31, December 31, March 31,
income increased $804,000 (dollars in thousands, except per share data) 2021 2020 2020
from prior quarter to $8.1 Net income $ 8,065 $ 7,261 $ 6,745
million for 1Q21 Earnings per share, diluted $ 1.10 $ 0.99 $ 0.92
Cash dividends per share $ 0.07 $ 0.06 $ 0.06
EPS (diluted) was $1.10 and Return on average assets 1.20% 1.13% 1.36%
ROA was 1.20% for 1Q21 Return on average equity 11.36% 10.23% 10.53%
Assets increased 6.7%, or Net interest margin FTE 2.76% 3.08% 3.41%
$178.0 million, to $2.82 billion Efficiency ratio 54.02% 53.66% 57.40%
Total assets $ 2,820,672 $ 2,642,634 $ 2,010,701
Deposits increased 7.5%, or Loans held for investment $ 1,602,086 $ 1,588,446 $ 1,447,362
$174.9 million, to $2.52 billion Noninterest‐bearing deposits $ 1,015,350 $ 943,615 $ 607,322
Net interest margin FTE Total deposits $ 2,515,275 $ 2,340,360 $ 1,727,782
decreased 32 basis points to Loans HFI to deposits ratio 63.69% 67.87% 83.77%
2.76% Noninterest‐bearing deposits to deposits ratio 40.37% 40.32% 35.15%
Nonperforming assets to total assets 0.13% 0.16% 0.30%
Nonperforming assets to assets Net charge‐offs to average loans 0.00% 0.06% 0.00%
ratio decreased to 0.13% Allowance for loan losses to loans HFI 1.21% 1.13% 0.99%
Allowance for loan losses to Leverage ratio 10.43% 10.92% 12.89%
Book value per share $ 38.99 $ 38.97 $ 36.08
loans HFI ratio = 1.21%
9
Basic, Conservative Balance Sheet
Balance Sheet Increasing liquidity. Overnight
As of March 31, 2021 (in thousands)
liquidity/earning assets = 20.9%
Assets
Cash and cash equivalents $ 603,000 Conservative securities portfolio.
Securities available‐for‐sale 515,942 Securities/earning assets = 19.0%
Loans held for investment 1,602,086 Noninterest‐bearing DDAs/total
Loans held for sale 18,449 deposits = 40.37%
Allowance for loan losses (19,377)
Intangible assets 1,546 Loans HFI/Deposits = 63.69%
Premises and equipment, net 46,950 No brokered deposits
Other assets 52,076
Total Assets $ 2,820,672
No subordinated debt or other
borrowings
Liabilities
Noninterest‐bearing deposits $ 1,015,350 Minimal intangible assets
Interest‐bearing deposits 1,499,925
Well capitalized with 10.43% leverage
Total Deposits 2,515,275
ratio
Other liabilities 20,486
Total Liabilities $ 2,535,761 $3.0 million stock buyback plan
Stockholders' Equity available. $1.1 million repurchased
Total Stockholders' Equity 284,911 through March 31, 2021
Total Liabilities and
Quarterly dividend increased in 1Q21
Stockholders' Equity $ 2,820,672 10Securities Portfolio ‐ Conservative
19.0% of earning assets Key strengths of municipal portfolio:
FTE yield ‐ 1.76% Geographic diversification
Effective duration ‐ 4.49 years 67% of portfolio carries support through
Average life ‐ 6 years insurance or state enhancements
Credit quality is strong with 100% of the
Mortgage‐backed securities: portfolio either having an overall rating
Average life ‐ 6.04 years of A or better, or is pre‐refunded
Effective duration ‐ 5.07 years Effective duration ‐ 4.08 years
Securities ($M) Securities Mix
As of March 31, 2021
$498.2 $515.9
$354.3
$335.6
$307.9
2017 2018 2019 2020 1Q21
MBS Agency Treasury Muni ‐ AFS Muni ‐ HTM 11Loan Portfolio Overview
Loans HFI Mix
As of March 31, 2021
Broad diversification by industry
Highest industry concentration is in health
care at 9.8% (excluding PPP loans)
Loans indexed to LIBOR were $59.5 million,
or 3.7%, of loans HFI as of March 31, 2021
Total Loans HFI ($M) Largest Industry Concentrations
As of March 31, 2021 (excluding PPP Loans)
$1,588 $1,602 Health Care 9.8%
$1,439
$1,328 Construction 4.5%
$1,248
Investor 1‐to‐4 and Multifamily 4.2%
Hospitality Services 3.9%
Retail Trade 3.8%
Public Administration 3.2%
Religious and Other Nonprofit 2.2%
Energy 2.0%
Finance and Insurance 1.6%
2017 2018 2019 2020 1Q21
CRE 1‐4 Family Residential C&D C&I Tax‐Exempt Consumer PPP Manufacturing 1.6%
12Loans By Market
Five of our six markets have unemployment rates below state average
Four of our markets have unemployment rates below national average
Little exposure to the tourism and energy driven areas of Louisiana
Focus on major MSA’s in Louisiana
Non‐PPP Loans HFI originated by geographic market2
Unemployment Rate (February 20211) As of March 31, 2021
7.4% 7.1%
6.8% 6.6%
6.3%
5.8%
5.1% 4.8%
United States
Northshore
Northwest
Southwest
Acadiana
Louisiana
Central
Capital
1Source: Louisiana Workforce Commission data for February 2021
2Non‐GAAP measure. See “Forward‐Looking Statements and Non‐GAAP Information” on slide 2 and “Non‐GAAP Reconciliation” slides in the Appendix for additional information. 13Health Care Loans
Health Care Loans by Subtype
As of March 31, 2021
Health care loans as of March 31,
2021 totaled $145.1 million, or 9.8%,
of non‐PPP loans HFI1
Largest industry concentration
Average loan size = $294,000
No shared national credits, no real
estate investment trusts, no assisted
living facilities
No health care credits on Watch List
Nursing care facilities operate under
a certificate of need system in
Louisiana
¹Non‐GAAP measure. See “Forward‐Looking Statements and Non‐GAAP Information” on slide 2 and “Non‐GAAP Reconciliation” slides in the Appendix for additional
14
information.Energy Portfolio Loans
Energy Portfolio
Energy portfolio (EP) loans as of As of March 31, 2021
March 31, 2021 totaled $29.9
Originated by
million, or 2.0%, of non‐PPP loans Red River Bank Other banks Total
HFI1 (dollars in thousands) Amount Percent Amount Percent Amount Percent
Average loan size = $575,000 Performing $ 27,400 91.6% $1,730 5.8% $ 29,130 97.4%
Charge‐offs since 2017 were $2.8 Nonperforming ‐ 0.0% 786 2.6% 786 2.6%
Total EP $ 27,400 91.6% $2,516 8.4% $ 29,916 100.0%
million
Nonperforming EP continues to Not criticized $ 22,083 73.8% $1,730 5.8% $ 23,813 79.6%
decline Criticized 5,317 17.8% 786 2.6% 6,103 20.4%
No reserve based lending Total EP $ 27,400 91.6% $2,516 8.4% $ 29,916 100.0%
EP/Non‐PPP Loans HFI1 Nonperforming EP/Total EP
10.8%
3.4%
2.9%
2.2%
2.0%
5.0% 5.3%
1.4% 3.9%
2.6%
2017 2018 2019 2020 1Q21 1Q20 2Q20 3Q20 4Q20 1Q21
¹Non‐GAAP measure. See “Forward‐Looking Statements and Non‐GAAP Information” on slide 2 and “Non‐GAAP Reconciliation” slides in the Appendix for additional
15
information.Commercial Real Estate Loans
Commercial Real Estate (CRE) loans
were $562.6 million, or 35.1%, of
Loans HFI as March 31, 2021
Low levels of CRE relative to state,
regional, and national peers CRE/Loans HFI
CRE concentration ratios as a % of 20.9%
20.3% 20.1% 19.9%
risk‐based capital are well below 19.3%
bank regulatory guidelines 16.1%
14.9% 15.2%
13.7% 13.9%
Construction & Development
Ratio = 42.0%
Commercial Real Estate Ratio =
129.0%
CRE criticized loans were $4.2 2017 2018 2019 2020 1Q21
million, or 0.8%, of total CRE loans;
Owner occupied Non‐owner occupied
0.3% of loans HFI
CRE nonperforming loans were $1.4
million, or 0.3%, of total CRE loans;
0.1% of loans HFI
16Paycheck Protection Program
PPP First Draw (PPP1) Loans Original PPP1 Loan Status
As of March 31, 2021
Loan payments for 78.6% of
the 1,384 PPP1 loans and (dollars in thousands) Originated Received Outstanding
66.4% of the $199.0 million
Amount $ 199,047 $ 132,146 $ 66,901
originated have been received Number of Loans 1,384 1,087 297
73.8% of the $7.0 million Deferred Fees $ 7,014 $ 959
original deferred fees have Average Size $ 144
been recognized Gross Fee Yield (24 mo) 3.52%
Additional PPP1 loans for $3.3 Additional PPP1 Loan Status PPP2 Loan Status
million originated in the first
(dollars in thousands) Originated (dollars in thousands) Originated
quarter of 2021
Amount $ 3,289 Amount $ 52,559
PPP Second Draw (PPP2) Loans Number of Loans 6 Number of Loans 436
Deferred Fees $ 60 Deferred Fees $ 2,437
Began taking applications Average Size $ 548 Average Size $ 121
January 20, 2021 Gross Fee Yield (60 mo) 1.81% Gross Fee Yield (60 mo) 4.64%
As of March 31, 2021, 436 Total PPP Loan Quarterly Income
loans originated for $52.6 PPP Income Yield
million with an average size of 2Q20 $ 1,153 2.99%
3Q20 $ 1,386 2.84%
$121,000 4Q20 $ 3,023 7.45%
Loans fees of $2.4 million are 1Q21 $ 2,132 7.97%
deferred 17Asset Quality
Asset Quality Metrics
As of and for the quarter ended
Nonperforming Assets –
(dollars in thousands) 1Q20 2Q20 3Q20 4Q20 1Q21
decreased due to payoff of Nonperforming Loans (NPLs) $ 5,235 $ 3,442 $ 4,387 $ 3,310 $ 2,811
nonaccrual loans and sale of NPLs to Loans HFI 0.36% 0.21% 0.27% 0.21% 0.18%
1
foreclosed assets NPLs to Non‐PPP Loans HFI 0.36% 0.24% 0.30% 0.23% 0.19%
Provision for loan loss expense – Nonperforming Assets (NPAs) $ 6,104 $ 4,294 $ 5,215 $ 4,206 $ 3,604
decreased compared to 4Q20. NPAs to total assets 0.30% 0.18% 0.21% 0.16% 0.13%
Asset quality improved, pandemic‐ Criticized Loans (CL) $ 19,663 $ 17,550 $ 18,295 $ 12,607 $ 12,482
related economic restrictions were CLs to Loans HFI 1.36% 1.09% 1.11% 0.79% 0.78%
eased
Provision Expense $ 503 $ 1,525 $ 1,590 $ 2,675 $ 1,450
ALL to non‐PPP loans HFI1 = 1.31% ALL to loans HFI 0.99% 0.92% 0.98% 1.13% 1.21%
1
as of March 31, 2021 ALL to Non‐PPP Loans HFI 0.99% 1.05% 1.11% 1.22% 1.31%
The need for additional ALL is Net Charge‐offs to Average
diminishing Loans (QTR) 0.00% 0.06% 0.02% 0.06% 0.00%
NPAs/Total Assets
COVID‐19 Loan Modifications –
Active deferrals continue to 0.30%
decline and were $9.7 million, or 0.21%
0.7%, of non‐PPP loans HFI1 as of 0.18%
0.16%
March 31, 2021 0.13%
1Q20 2Q20 3Q20 4Q20 1Q21
¹Non‐GAAP measure. See “Forward‐Looking Statements and Non‐GAAP Information” on slide 2 and “Non‐GAAP Reconciliation” slides in the Appendix for additional
18
information.Loan Categories Most Impacted by COVID‐19
March 31, 2021
% Non‐PPP
(dollars in thousands) Amount Loans HFI1
By Industry: Hotel exposure
Hospitality services: Only one property financed in the
Hotels and other overnight lodging $ 26,477 1.8% tourism‐driven downtown New
Restaurants ‐ full service 12,258 0.8% Orleans market
Restaurants ‐ limited service 12,235 0.8% The remaining hotel properties in our
Other 7,130 0.5% portfolio are located throughout
Total hospitality services $ 58,100 3.9% Louisiana in areas that are not
Hospitality services average loan size $ 447 primarily tourism‐driven
Retail trade (excluding auto dealers) $ 21,336 1.4% Restaurant exposure
Retail trade average loan size $ 160 Not located in tourism‐driven areas
Energy $ 29,916 2.0% Loans collateralized by non‐owner occupied
properties leased to retail establishments
Energy average loan size $ 575
totaled $42.7 million, or 2.9% of non‐PPP
loans HFI1
Total sectors $ 109,352 7.3%
¹Non‐GAAP measure. See “Forward‐Looking Statements and Non‐GAAP Information” on slide 2 and “Non‐GAAP Reconciliation” slides in the Appendix for additional
19
information.Attractive Core Deposit Base
Deposit Mix
Deposits increased $174.9 million, or As of March 31, 2021
7.5%, in the first quarter of 2021 due
to funds received from government
stimulus programs, proceeds of PPP2
loans, and customers maintaining
higher deposit balances
Cost of deposits was 0.27% for the
three months ended March 31, 2021
No brokered deposits
Total Deposits ($M) Noninterest‐bearing Deposits ($M)
$2,515
$2,340 $1,015
$944
$1,721
$1,646
$1,526
$585
$548
$504
2017 2018 2019 2020 1Q21 2017 2018 2019 2020 1Q21
DDA NOW Money Market
Savings Time 250k
20Profitability Trends
Net Income ($000)1 Earnings Per Share (Diluted)1,2
$28,145
$3.83
$24,824 $3.49
$23,056 $3.41
$2.48
$16,215
$8,065 $1.10
2017 2018 2019 2020 2021
2017 2018 2019 2020 2021
Q1 Q2 Q3 Q4 Tax Reform Q1 Q2 Q3 Q4 Tax Reform
Efficiency Ratio (%) Return on Average Assets (%)1
62.69 1.29 1.30
1.22 1.20
59.46 0.95
58.86
55.77
54.02
2017 2018 2019 2020 1Q21 2017 2018 2019 2020 1Q21
1 2017 Adjusted for $2.2 million write‐down of deferred tax assets associated with changes in tax legislation
2 2017 EPS data adjusted for 2‐for‐1 stock split with a record date of October 1, 2018 21Net Interest Margin FTE (1Q21)
Net interest margin FTE decreased 32 basis points to 2.76% for 1Q21
Net interest income decreased $1.1 million to $17.6 million for 1Q21
First quarter 2021 decreased due to having high levels of low yielding short‐term liquid assets and lower PPP
loan income
5.00%
4.50% Loan Yield 4.47%
4.21% 4.31%
4.04%
4.00%
3.41% Net Interest Margin ‐ FTE
3.12% 3.02% 3.08%
3.00% 2.76%
2.00%
1.26% Average Effective Fed Funds Rate
1.00% Cost of Deposits
0.58%
0.41% 0.37% 0.33% 0.27%
0.00%
0.06% 0.09% 0.09% 0.08%
1Q20 2Q20 3Q20 4Q20 1Q21
NIM Challenges NIM Opportunity
Higher liquidity levels and deployment Lower cost of deposits
Lower security yield on new securities Loan growth opportunity in new markets
Timing of PPP loan forgiveness payments Explore ways to reduce short‐term liquid
assets 22Loan Yield and Net Interest Ratios Excluding
PPP Loans1 (1Q21)
Non‐PPP loan income = $15.0 million yielding 4.05% for the three
months ended March 31, 2021
Excluding PPP loans, net interest margin FTE decreased 24 basis
points to 2.53%1
For the Three Months Ended
March 31, 2021 December 31, 2020
Excluding Excluding
Ratios Actual PPP loans1 Actual PPP loans1
Loan Yield 4.31% 4.05% 4.47% 4.14%
Net Interest Spread 2.50% 2.28% 2.76% 2.47%
Net Interest Margin 2.69% 2.47% 3.01% 2.70%
Net Interest Margin FTE 2.76% 2.53% 3.08% 2.77%
¹Non‐GAAP measure. See “Forward‐Looking Statements and Non‐GAAP Information” on slide 2 and “Non‐GAAP Reconciliation” slides in the Appendix for additional
23
information.Noninterest Income
Noninterest income increased
$582,000 from 4Q20 to $6.8
million for 1Q21
Brokerage income ‐ quarterly Noninterest Income
For the quarter ended March 31, 2021
record‐high of $834,000 due to (dollars in thousands)
increase in sales activity and
additional funds invested by
existing clients
Assets under management ‐
$704.8 million
Mortgage income ‐ increased
$203,000 to $2.9 million with
continued mortgage activity
Loan and deposit income ‐
totaled $473,000, an increase of
$112,000 from prior quarter
primarily due to $110,000 of
nonrecurring commercial real
estate loan fees
24Operating Expenses
Operating expenses decreased
$173,000 from 4Q20 to $13.2
million for 1Q21
Legal and professional expenses ‐ Operating Expenses
For the quarter ended March 31, 2021
decreased $186,000 to $368,000 (dollars in thousands)
due to lower attorney,
compliance, and accounting
expenses
Data processing expense ‐
decreased $108,000 to $385,000
due to receipt of $173,000
nonrecurring refund from data
processing center
Other taxes ‐ increased $100,000
to $525,000 due to increase in
State of Louisiana bank stock tax
from higher deposit balances and
net income for applicable years
25Future Plans Continue building a strong, Louisiana based, super community bank Open our new Lake Charles and Lafayette banking centers and expand market share in these new markets Prudently deploy liquidity in loans and investments Continue to expand mortgage operations and investments division across Louisiana Focus on assisting our customers and communities during the reopening of the economy Aggressively monitor asset quality trends and maintain appropriate level of ALL Monitor markets for opportunity for organic growth or key acquisitions Seek to take advantage of disruption in the marketplace due to mergers and acquisitions and branch closures/limited service by larger national banks Continue to invest in digital banking tools as needed in order to serve our target customer base Focus on capital management by paying dividends and repurchasing stock 26
Summary
               Record‐high quarterly net income of $8.1 million

      Diversified loan portfolio with solid asset quality and allowance

          Managing $119.4 million of PPP loans as of March 31, 2021

      Well capitalized with 10.43% leverage ratio as of March 31, 2021

              Consistent returns through March 31, 2021, with
                 YTD ROA = 1.20% and YTD ROE = 11.36%

           Made in Louisiana. Made for Louisiana.
                                                                          27
28
Appendix

           29
Non‐GAAP Reconciliation
As of March 31, As of December 31, As of March 31,
(dollars in thousands, except per share data) 2021 2020 2020
Tangible common equity
Total stockholders' equity $ 284,911 $ 285,478 $ 264,175
Adjustments:
Intangible assets (1,546) (1,546) (1,546)
Total tangible common equity (non‐GAAP) $ 283,365 $ 283,932 $ 262,629
Common shares outstanding 7,306,747 7,325,333 7,322,532
Book value per common share $ 38.99 $ 38.97 $ 36.08
Tangible book value per common share (non‐GAAP) $ 38.78 $ 38.76 $ 35.87
Tangible assets
Total assets $ 2,820,672 $ 2,642,634 $ 2,010,701
Adjustments:
Intangible assets (1,546) (1,546) (1,546)
Total tangible assets (non‐GAAP) $ 2,819,126 $ 2,641,088 $ 2,009,155
Total stockholders' equity to assets 10.10% 10.80% 13.14%
Tangible common equity to tangible assets (non‐GAAP) 10.05% 10.75% 13.07%
30Non‐GAAP Reconciliation
As of March 31, As of December 31, As of March 31,
(dollars in thousands) 2021 2020 2020
Non‐PPP loans HFI
Loans HFI $ 1,602,086 $ 1,588,446 $ 1,447,362
Adjustments:
PPP loans, net (119,358) (118,447) ‐
Non‐PPP loans HFI (non‐GAAP) $ 1,482,728 $ 1,469,999 $ 1,447,362
Assets excluding PPP loans, net
Assets $ 2,820,672 $ 2,642,637 $ 2,010,701
Adjustments:
PPP loans, net (119,358) (118,447) ‐
Assets excluding PPP loans, net (non‐GAAP) $ 2,701,314 $ 2,524,190 $ 2,010,701
Allowance for Loan Losses $ 19,377 $ 17,951 $ 14,393
Deposits $ 2,515,275 $ 2,340,360 $ 1,727,782
Loans HFI to deposits ratio 63.69% 67.87% 83.77%
Non‐PPP loans HFI to deposits ratio (non‐GAAP) 58.95% 62.81% 83.77%
Allowance for loans losses to loans HFI 1.21% 1.13% 0.99%
Allowance for loans losses to non‐PPP loans HFI (non‐GAAP) 1.31% 1.22% 0.99%
31You can also read