Q4 and Full Year 2018 Earnings Slides - February 5, 2019 - SNAP's Investor Relations

Page created by Mathew Harvey
 
CONTINUE READING
Q4 and Full Year 2018 Earnings Slides - February 5, 2019 - SNAP's Investor Relations
Q4 and Full Year 2018 Earnings Slides
February 5, 2019
FORWARD-LOOKING STATEMENTS & NON-GAAP FINANCIAL MEASURES
   Forward-Looking Statements & Non-GAAP Financial Measures
   This presentation contains forward-looking statements about us and our industry that involve substantial risks and uncertainties. All statements other than statements of historical facts
   contained in this presentation, including statements regarding guidance, our future results of operations or financial condition, business strategy and plans, user growth and
   engagement, product initiatives, and objectives of management for future operations, are forward-looking statements.

   In some cases, you can identify forward-looking statements because they contain words such as “anticipate,” “believe,” “contemplate,” “continue,” “could,” “estimate,” “expect,” “going
   to,” “intend,” “may,” “plan,” “potential,” “predict,” “project,” “should,” “target,” “will,” or “would” or the negative of these words or other similar terms or expressions.

   You should not rely on forward-looking statements as predictions of future events. We have based the forward-looking statements contained in this presentation on our current
   expectations and projections about future events and trends that we believe may affect our business, financial condition, results of operations, and prospects. These forward-looking
   statements are subject to risks, uncertainties, and other factors, including those described in the sections titled “Risk Factors” and “Management’s Discussion and Analysis of Financial
   Condition and Results of Operations” in our most recent quarterly report on Form 10-Q filed with the SEC, which is available on the SEC’s website at www.sec.gov. Additional
   information will be made available in our annual report on Form 10-K for the fiscal year ended December 31, 2018 and other filings that we make from time to time with the SEC.

   In addition, the forward-looking statements in this presentation relate only to events as of the date on which the statements are made and are based on information available to us as of
   the date of this presentation. We undertake no obligation to update any forward-looking statements made in this presentation to reflect events or circumstances after the date of this
   presentation or to reflect new information or the occurrence of unanticipated events, except as required by law. We may not actually achieve the plans, intentions, or expectations
   disclosed in our forward-looking statements, and you should not place undue reliance on our forward-looking statements. Our forward-looking statements do not reflect the potential
   impact of any future acquisitions, mergers, dispositions, joint ventures, or investments.

   This presentation includes certain non-GAAP financial measures. These non-GAAP financial measures, which may be different than similarly titled measures used by other companies,
   are presented to enhance investors’ overall understanding of our financial performance and should not be considered a substitute for, or superior to, the financial information prepared
   and presented in accordance with GAAP. A reconciliation of GAAP to non-GAAP measures is provided in the appendix of this presentation.

                                                                                                                                                                                                2
Fourth Quarter Financial Highlights
                                                                 • Operating cash flow improved $50 million YoY and $6 million QoQ to $(126) million.

                               Cash                              • Free Cash Flow improved $49 million YoY and $10 million QoQ to $(149) million.

                                                                 • Change in cash balance improved $120 million YoY and $20 million QoQ to $(135) million.

                                                                 • Revenue increased 36% YoY and 31% QoQ to a record $390 million.
                           Revenue
                                                                 • Average revenue per user increased 37% YoY and 31% QoQ to $2.09.

                                                                 • Gross margin1 increased to a record 48%, compared to 36% in Q4 2017 and 36% in Q3 2018.

                                                                 • Operating loss improved $166 million YoY and $129 million QoQ to $(195) million.

                                                                 • Net loss improved $158 million YoY and $133 million QoQ to $(192) million.
                        Operating
                       Performance
                                                                 • Adjusted EBITDA improved $109 million YoY and $88 million QoQ to $(50) million.

                                                                 • Adjusted EBITDA margin improved to (13)%, compared to (56)% in Q4 2017 and (46)% in Q3 2018.

                                                                 • Adjusted EBITDA leverage improved to 104%, compared to (6)% in Q4 2017 and (45)% in Q3 2018.

1Excludes   stock-based compensation expense and related payroll tax expense, depreciation and amortization, and certain other non-cash or non-recurring items impacting net income (loss) from time to time.
                                                                                                                                                                                                                3

                                                                                                 STRONG FINANCIAL PERFORMANCE Y O Y AND Q O Q
Business Highlights
We ended the year stabilizing Daily Active Users and enhancing engagement across key metrics:
• DAUs were 186 million in Q4 2018, compared to 187 million in Q4 2017 and 186 million in Q3 2018.
• In Q4 2018, our iOS DAU increased both quarter-over-quarter and year-over-year, and average time spent on iOS grew
  faster during Q4 2018 than during Q4 2017.
• We reached over 70% of the total 13 to 34 year-old U.S. population with premium mobile video ads on a monthly basis.
• On average, over 70% of users played with or viewed a Lens every day. Users played with or viewed Lenses 700 million
  times on New Year’s Eve, up nearly 40% year-over-year.

Our commitment to providing high quality, made-for-mobile video experiences across the Snapchat platform is yielding
positive results:
• 30% more people are now watching Publisher Stories and Shows every day compared to last year, and each person is
  consuming more of these Stories per day on average.
• In Q4 2018, more than 60% of ESPN’s “SportsCenter” audience tuned in three or more times per week.
• “Dead Girls Detective Agency,” a new Snap Original Show produced by our joint venture with NBCUniversal, reached
  more than 14 million unique viewers, and over 40% of the users that completed the first episode went on to watch the
  entire season.
• Bitmoji Stories, a new cartoon starring Snapchatters and their friends, reached over 40 million viewers in December.
• NBC News announced that two thirds of the 25 to 35 million Snapchatters watching its Stay Tuned show represented a
  net new audience for them.                                                                                             4
Business Highlights
We strengthened our international content offerings:
• We increased the breadth and depth of our content across international markets including France, Germany, Ireland,
  Norway, the UK, India, and the Middle East.
• We saw success with localized partners such as Filter Copy in India and Layalina in the Middle East to reach audiences
  drawn to local, culturally relevant content.

We drove continued product innovation:
• We began to roll out our new Android application and early test results are promising, especially on less performant
  devices, including a 20% reduction in the average time it takes to open Snapchat.
• We expanded our augmented reality platform and launched Snap Camera, which lets people use their favorite Lenses
  when creating or streaming video on desktop and laptop computers.
• By the end of 2018, over 300,000 Lenses had been created by our community through Lens Studio, and those Lenses
  were viewed over 35 billion times.
• We launched Lens Challenges, where users can participate in challenges in Lens Explorer by creating a Snap with a Lens
  that is themed to a particular song, dance, holiday, or event.
• We introduced Friendship Profiles, a collection of images, videos, messages, links, and more that users and friends have
  saved in Chat. Friendship Profiles make it easy to find favorite Memories and the important things that are saved over
  time in one place.

                                                                                                                             5
Business Highlights
We created new products which drove greater monetization:
• Commercials, our 6-second non-skippable video ad, continued to perform well. The majority was transacted via our
  Premium Content Targeting tool, a part of our Self-Serve Platform for large brands and agencies.
• Collection Ads, which enable a business to showcase four products in a single Snap, drove over twice the return on ad
  spend versus our comparable formats in Q4 2018.
• We launched Product Catalogs, which offer a simple, scalable way for eCommerce businesses to use their websites to
  create Snap Ads.
• The Snap Pixel continued to see growth with over 600 million purchase events in Q4 2018 up from 230 million in Q3
  2018.
• We made improvements to machine learning models for app installs and lower-funnel bidding events, which contributed
  to higher always-on revenue, showing that our commitment to performance advertisers is paying off.

We brought together an experienced leadership team to lead us through the next important chapter of Snap:

• We welcomed several talented and experienced leaders from some of the world’s leading tech and media companies,
  including Jared Grusd, our Chief Strategy Officer, and Jeremi Gorman, our Chief Business Officer. Julie Henderson will
  be joining us shortly as our Chief Communications Officer.
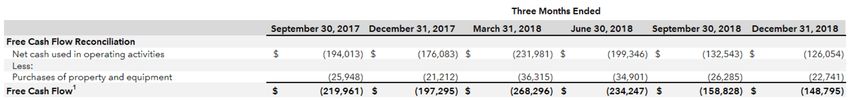
                                                                                                                           6
Free Cash Flow1
                   (in millions, unaudited)

                                                                                                                                                                                                                         Cash Used in Operating Activities       Capital Expenditures

                                            Q3'17                                           Q4'17                                           Q1'18                                          Q2'18                                    Q3'18                    Q4'18

                                                                                                                                                                                                                                    $(133)                   $(126)

                                                                                            $(176)
                                            $(194)                                                                                                                                         $(199)
                                                                                                                                            $(232)
                                                                                                                                                                                                                                                             $(23)
                                                                                                                                                                                                                                    $(26)
                                                                                                                                                                                                                                                             $(149)
                                                                                                                                                                                                                                    $(159)
                                                                                             $(21)
                                             $(26)                                          $(197)
                                                                                                                                                                                             $(35)
                                            $(220)
                                                                                                                                                                                            $(234)
                                                                                                                                             $(36)

                                                                                                                                            $(268)

YoY Change                                     6%                                         (5)%                                           (55)%                                             (2)%                                      28%                      25%

Numbers throughout presentation may not foot due to rounding.
1We define Free Cash Flow as net cash provided by (used in) operating activities, reduced by purchases of property and equipment. See Appendix for reconciliation of net cash used in operating activities to Free Cash Flow.

                                                                                                                                                                                                                                                                                        7

                                             OPTIMIZING LONG-TERM FREE CASH FLOW; FREE CASH FLOW IMPROVED 25% Y O Y AND 6% Q O Q
Common Shares Outstanding Plus Shares Underlying Stock-Based Awards
                      (in millions, unaudited)

                                                                                                                                                  Common Shares Outstanding   Shares Underlying Stock-Based Awards1

                                                                                                                                          1,479                    1,476                   1,507
                                              1,441                                            1,453                              1,457

                                                                                                                                                                   185                      189
                                                                                                                                   202     206
                                               240                                               231

                                                                                                                                  1,254   1,273                    1,291                   1,318
                                             1,202                                             1,222

                                             Q3'17                                            Q4'17                               Q1'18   Q2'18                   Q3'18                    Q4'18

YoY Change                                      NM                                              NM                                 2%      3%                       2%                       4%

1Shares   underlying stock-based awards include restricted stock units, restricted stock awards, and outstanding stock options.                                                                                       8

                                                                          FOCUSED ON EFFICIENTLY MANAGING DILUTION OVER THE LONG TERM
Revenue by Geography
                    (in millions, unaudited)

                                                                                                                                                                                                                             North America1                                Europe2                    Rest of World

                                     QUARTERLY REVENUE                                                                                                                                                                                          FULL YEAR REVENUE

                                                                                                                                                                                                                                                                                            $1,180

                                                                                                                                                                                           $390                                                                                              $170

                                                                                                                                                                                             $58
                                                                                                                                                                                                                                                                                             $186
                                                                                                                                                                                                                                                       $825
                                                                                                                                                               $298
                                                                        $286                                                                                                                 $62                                                         $60
                                                                          $26                                                     $262                          $40
                                                                                                                                                                                                                                                        $102
                                                                                                      $231
                                                                         $40                                                       $45                          $50
                                            $208                                                       $27
                                             $13                                                                                   $40
                                            $27                                                       $33
                                                                                                                                                                                                                                                                                             $824
                                                                                                                                                                                            $269                                                        $663
                                                                        $219                                                                                   $207
                                           $167                                                      $170                         $177

                                          Q3'17                        Q4'17                        Q1'18                        Q2'18                        Q3'18                        Q4'18                                                     FY 2017                                FY 2018

       YoY Change                           62%                          72%                         54%                          44%                          43%                         36%                                                         104%                                  43%

Total revenue for geographic reporting is apportioned to each region based on our determination of the geographic location in which advertising impressions are delivered, as this approximates revenue based on user activity. This allocation is consistent with how we determine ARPU.
1North America includes Mexico, the Caribbean, and Central America.

2Europe includes Russia and Turkey.                                                                                                                                                                                                                                                                                   9

                                                     REVENUE UP 36% Y O Y AND 31% Q O Q; FULL YEAR REVENUE INCREASED 43% TO $1.2 BILLION
Average Daily Active Users (DAU)
                    (in millions, unaudited)

                           GLOBAL                                                                                                                                                NORTH AMERICA1

                                                                                                   0%                                                                                                                                                       -1%

                                                        187                  191                   188                  186                   186
                                  178

                                                                                                                                                                                              77                   80                    81                   80                    79                    79

                                Q3'17                Q4'17                 Q1'18                Q2'18                 Q3'18                Q4'18                                          Q3'17                 Q4'17                Q1'18                 Q2'18                 Q3'18                Q4'18

                           EUROPE2                                                                                                                                               REST OF WORLD

                                                                                                  -1%                                                                                                                                                        +1%

                                   57                   60                    62                   61                   59                    60
                                                                                                                                                                                               44                   47                    48                   47                    47                   47

                               Q3'17                 Q4'17                Q1'18                Q2'18                 Q3'18                Q4'18                                            Q3'17                 Q4'17                Q1'18                 Q2'18                Q3'18                 Q4'18

We define a Daily Active User, or DAU, as a registered Snapchat user who opens the Snapchat application at least once during a defined 24-hour period. We calculate average Daily Active Users for a particular quarter by adding the number of DAUs on each day of that quarter and dividing that sum by the number of
days in that quarter.
1North America includes Mexico, the Caribbean, and Central America.
2Europe includes Russia and Turkey.
                                                                                                                                                                                                                                                                                                                          10

                                                                                                                                          GLOBAL DAU FLAT Q O Q
Average Revenue Per User (ARPU)
                   (unaudited)

                          GLOBAL                                                                                                                                               NORTH AMERICA1

                                                                                                     +37%                                                                                                                                               +23%

                                                                                                                                                                                                                                                                                                    $3.38
                                                                                                                                                                                                              $2.75                                                            $2.62
                                                                                                                                                $2.09                                    $2.17                                      $2.10                $2.21
                                                          $1.53                                                            $1.60
                                                                                                     $1.40
                                     $1.17                                      $1.21

                                    Q3'17                Q4'17                 Q1'18                Q2'18                 Q3'18                Q4'18                                    Q3'17                Q4'17                 Q1'18                Q2'18                 Q3'18                Q4'18

                          EUROPE2                                                                                                                                              REST OF WORLD
                                                                                                     +57%                                                                                                                                              +120%
                                                                                                                                                $1.04
                                                                                                                                                                                                                                                                                                    $1.24
                                                                                                                           $0.85
                                                                                                                                                                                                                                                         $0.96
                                                          $0.66                                      $0.66                                                                                                                                                                     $0.84
                                     $0.48                                      $0.53
                                                                                                                                                                                                              $0.56                 $0.58

                                                                                                                                                                                         $0.30

                                    Q3'17                Q4'17                 Q1'18                Q2'18                 Q3'18                Q4'18                                    Q3'17                Q4'17                 Q1'18                Q2'18                 Q3'18                Q4'18

We define ARPU as quarterly revenue divided by the average Daily Active Users. For purposes of calculating ARPU, revenue by user geography is apportioned to each region based on our determination of the geographic location in which advertising impressions are delivered, as this approximates revenue based on
user activity.
1North America includes Mexico, the Caribbean, and Central America.
2Europe includes Russia and Turkey.
                                                                                                                                                                                                                                                                                                                       11

                                                                                              GLOBAL ARPU INCREASED 37% Y O Y AND 31% Q O Q
Cost of Revenue1

                         COST OF REVENUE AS A % OF REVENUE                                                                                                                        COST OF REVENUE COMPOSITION
                                                                                                                                                                                  (in millions, unaudited)

                                Gross Margin1
                                                                                                                                                                                         Infrastructure Cost
                                                                                                                                                                                         Revenue Share Cost
                                                                                         -12 PPTS                                                                                        Other
                                                                                                                                                                                                                                                    +10%
                                                                    83%
                          79%
                                                                                                                                                                                                                                   $191                     $191    $202
                                                                                          70%                                                                                                                $184                                   $184
                                                64%                                                            64%                                                                       $163                                        $20                             $28
                                                                                                                                                                                                                                                     $25     $25
                                                                                                                                                                                                                $25
                                                                                                                                     52%                                                   $21                                       $32                     $26     $39
                                                                                                                                                                                                                $28                                  $24
                                                                                                                                    48%                                                    $22

                                               36%                                                            36%
                                                                                          30%
                                                                                                                                                                                                               $131                 $139            $136    $140    $134
                                                                                                                                                                                          $121
                         21%
                                                                    17%

                        Q3'17                Q4'17                 Q1'18                Q2'18                Q3'18                 Q4'18                                                Q3'17                Q4'17                Q1'18             Q2'18   Q3'18   Q4'18

                                                                                                                                                     Total Non-GAAP
                                                                                                                                                                                          $47                    $7                    $5             $8      $7     $11
                                                                                                                                                     Exclusions1

1Excludes   stock-based compensation expense and related payroll tax expense (SBC–Related Expense), depreciation and amortization (D&A Expense), and certain other non-cash or non-recurring items impacting net income (loss) from time to time.
                                                                                                                                                                                                                                                                            12

                                 COST OF REVENUE INCREASED 10% Y O Y AND 6% Q O Q, WHILE REVENUE INCREASED 36% Y O Y AND 31% Q O Q
Operating Expenses1

                  OPERATING EXPENSES AS A % OF REVENUE                                                                                                                        OPERATING EXPENSES COMPOSITION
                                                                                                                                                                              (in millions, unaudited)

                                                                                                                                                                                           Research and Development
                                                                                                                                                                                           Sales and Marketing

                                                                                                                                                                                           General and Administrative
                                                                               -30 PPTS
                                                                                                                                                                                                                                                      -9%

                                                              112%                                                                                                                                           $261                  $257
                     107%                                                                                                                                                                                                                           $247    $246
                                                                                                                                                                                                                                                                    $238
                                                                                                                                                                                        $223
                                                                                   94%
                                          91%                                                                                                                                                                                       $77
                                                                                                                                                                                                              $88                                   $75
                                                                                                        82%                                                                                                                                                 $82     $80
                                                                                                                                                                                         $66

                                                                                                                            61%                                                                                                     $79
                                                                                                                                                                                                              $78                                   $75     $68
                                                                                                                                                                                         $71                                                                        $75

                                                                                                                                                                                         $87                  $96                  $102             $97     $95     $84

                    Q3'17               Q4'17                Q1'18               Q2'18               Q3'18                Q4'18                                                        Q3'17                Q4'17                 Q1'18             Q2'18   Q3'18   Q4'18

                                                                                                                                                   Total Non-GAAP
                                                                                                                                                                                        $236                  $195                  $169            $182    $178    $133
                                                                                                                                                   Exclusions1

1Excludes stock-based compensation expense and related payroll tax expense (SBC–Related Expense) and depreciation and amortization (D&A Expense) and certain other non-cash or non-recurring items impacting net income (loss) from time to time.
Refer to Appendix for description of Reduction in Force Charges and Lease Exit Charges.                                                                                                                                                                                     13

                      OPERATING EXPENSES DECREASED 9% YOY AND 3% Q O Q, WHILE REVENUE INCREASED 36% Y O Y AND 31% Q O Q
Adjusted EBITDA1
                   (in millions, unaudited)

                                                                                                                                                                                                                                                                Adjusted EBITDA Margin

                                      QUARTERLY ADJUSTED EBITDA                                                                                                                                                                             FULL YEAR ADJUSTED EBITDA

                                         Q3'17                        Q4'17                        Q1'18                       Q2'18                        Q3'18                        Q4'18                                                    FY 2017            FY 2018

                                                                                                                                                                                         (13)%

                                                                                                                                                                                          ($50)
                                                                                                                                                             (46)%                                                                                                       (49)%
                                                                         (56)%
                                                                                                                                  (64)%

                                            (86)%                                                                                                                                                                                                       (87)%
                                                                                                   (94)%

                                                                                                                                                            ($138)

                                                                      ($159)
                                                                                                                               ($169)
                                         ($179)                                                                                                                                                                                                                       ($576)

                                                                                                   ($218)
                                                                                                                                                                                                                                                   ($720)

1We define Adjusted EBITDA as net income (loss), excluding interest income; interest expense; other income (expense), net; income tax benefit (expense); depreciation and amortization; stock-based compensation expense and related payroll tax expense;
and certain other non-cash or non-recurring items impacting net income (loss) from time to time. See Appendix for reconciliation of net loss to Adjusted EBITDA.
                                                                                                                                                                                                                                                                                         14

                           ADJUSTED EBITDA IMPROVED $109 MILLION Y O Y, AND ADJUSTED EBITDA MARGIN IMPROVED 43 PPTS Y O Y
Financial Guidance

   The following forward-looking statements reflect our expectations for the first quarter of 2019 as of February 5,
   2019, and are subject to substantial uncertainty. This guidance assumes, among other things, that no business
   acquisitions, investments, restructurings, or legal settlements are concluded in the quarter. Our results are
   based on assumptions that we believe to be reasonable as of this date, but may be materially affected by many
   factors, as discussed in “Forward-Looking Statements & Non-GAAP Financial Measures.”

   Q1 2019 Outlook

   • Revenue is expected to be between $285 million and $310 million, or grow between 24% and 34% year-over-
    year.

   • Adjusted EBITDA is expected to be between $(165) million and $(140) million, compared to $(218) million in
    Q1 2018.

                                                                                                                       15
Appendix
Non-GAAP Financial Measures Reconciliation
                  (in thousands, unaudited)

1 We define Free Cash Flow as net cash provided by (used in) operating activities, reduced by purchases of property and equipment.
2We  define Adjusted EBITDA as net income (loss), excluding interest income; interest expense; other income (expense), net; income tax benefit (expense); depreciation and amortization; stock-based compensation expense and related payroll tax expense; and certain other non-cash or non-recurring items impacting net
income (loss) from time to time. Spectacles inventory-related charges were primarily related to excess inventory reserves and inventory purchase commitment cancellation charges. Reduction in force charges in Q1 2018 were primarily composed of severance expense and related payroll tax expense related to a reduction in
force plan. Lease exit charges were related to our exit of various operating leases prior to the end of the contractual lease term. The lease exit charges primarily include the present value of our remaining lease obligation on the cease use dates that occurred during the quarter, net of estimated sublease income. These charges
are non-recurring and not reflective of underlying trends in our business.                                                                                                                                                                                                                                                                  1
Non-GAAP Financial Measures Reconciliation (Continued)
                   (in thousands, except per share amounts, unaudited)

1 We define Non-GAAP Net Loss as net income (loss); excluding amortization of intangible assets; stock-based compensation expense and related payroll tax expense; certain other non-cash or non-recurring items impacting net income (loss) from time to time; and related income tax adjustments. Non-recurring items
include spectacles inventory-related charges, reduction in force charges, and lease exit charges as described in the preceding slide. Non-GAAP Net Loss and weighted average diluted shares are then used to calculate Non-GAAP diluted net loss per share.                                                               2
Note Regarding User Metrics and Other Data
We define a Daily Active User, or DAU, as a registered Snapchat user who opens the Snapchat application at least once during a defined 24-hour period. We calculate average Daily
Active Users for a particular quarter by adding the number of DAUs on each day of that quarter and dividing that sum by the number of days in that quarter. We also break out Daily
Active Users by geography because certain markets have a greater revenue opportunity and lower bandwidth costs. We define average revenue per user, or ARPU, as quarterly revenue
divided by the average DAUs. For purposes of calculating ARPU, revenue by user geography is apportioned to each region based on our determination of the geographic location in
which advertising impressions are delivered, as this approximates revenue based on user activity. This allocation differs from our components of revenue disclosure in the notes to our
consolidated financial statements, where revenue is based on the billing address of the advertising customer.

Unless otherwise stated, statistical information regarding our users and their activities is determined by calculating the daily average of the selected activity for the most recently
completed quarter.

While these metrics are determined based on what we believe to be reasonable estimates of our user base for the applicable period of measurement, there are inherent challenges in
measuring how our products are used across large populations globally. For example, there may be individuals who have multiple Snapchat accounts, even though we forbid that in our
Terms of Service and implement measures to detect and suppress that behavior. We have not determined the number of such multiple accounts. Our user metrics are also affected by
technology on certain mobile devices that automatically runs in the background of our Snapchat application when another phone function is used, and this activity can cause our system
to miscount the user metrics associated with such account. Changes in our products, infrastructure, mobile operating systems, or metric tracking system, or the introduction of new
products, may impact our ability to accurately determine active users or other metrics and we may not determine such inaccuracies promptly. We believe that we don’t capture all data
regarding all our active users. For example, technical issues may result in data not being recorded from every user’s application. While we believe this underreporting is generally
immaterial, we are unable to precisely determine the level of underreporting and for some periods the underreporting may be material. We continually seek to address these technical
issues and improve our accuracy, but given the complexity of the systems involved and the rapidly changing nature of mobile devices and systems, we expect underreporting to
continue. We do not adjust our reported metrics to reflect this underreporting.

Some of our demographic data may be incomplete or inaccurate. For example, because users self-report their dates of birth, our age-demographic data may differ from our users’ actual
ages. And because users who signed up for Snapchat before June 2013 were not asked to supply their date of birth, we exclude those users and estimate their ages based on a sample
of the self-reported ages we do have. If our DAUs provide us with incorrect or incomplete information regarding their age or other attributes, then our estimates may prove inaccurate
and fail to meet investor expectations.                                                                                                                                                   3
Note Regarding User Metrics and Other Data (Continued)
We currently use an analytics platform that we developed and operate and we count a DAU only when a user opens the application and only once per user per day. We believe this
methodology accurately measures our user engagement. We have multiple pipelines of user data that we use to determine whether a user has opened the application during a particular
day and thus is a DAU. This provides redundancy in the event one pipeline of data were to become unavailable for technical reasons, and also gives us redundant data to help measure
how users interact with Snapchat.

If we fail to maintain an effective analytics platform, our metrics calculations may be inaccurate. We regularly review, have adjusted in the past, and are likely in the future to adjust our
processes for calculating our internal metrics to improve their accuracy. As a result of such adjustments, our DAUs or other metrics may not be comparable to those in prior periods. Our
measures of DAUs may differ from estimates published by third parties or from similarly titled metrics of our competitors due to differences in methodology or data used.

                                                                                                                                                                                                 4
You can also read