WINTERSHALL DEA INVESTOR PRESENTATION - THE LEADING EUROPEAN INDEPENDENT GAS AND OIL COMPANY
←
→
Page content transcription
If your browser does not render page correctly, please read the page content below
WINTERSHALL DEA
   INVESTOR PRESENTATION
THE LEADING EUROPEAN INDEPENDENT GAS AND OIL COMPANY

                     FEBRUARY 2021
WINTERSHALL DEA INVESTOR PRESENTATION

DISCLAIMER

This document has been prepared by                    Forward-Looking Statements                          Non-GAAP and Non-IFRS Financial Measures
Wintershall Dea GmbH (“the Company”) for
                                                      This document includes projections and other        This document contains certain non GAAP and
information purposes only.
                                                      “forward-looking statements”, which are based       non IFRS measures and ratios, including for
The information contained in this document has        on expectations of the Company’s management         example EBITDAX, Adjusted Net Income and net
not been independently verified and no                and projections about future events and             debt that are not required by, or presented in
representation or warranty, express or implied,       financial performance as of the date of the         accordance with, any GAAP or IFRS.
is made as to, and no reliance should be placed       presentation. These forward-looking statements
                                                                                                          These non GAAP and non IFRS measures and
on, the fairness, accuracy, completeness or           involve a number of risks, uncertainties, and
                                                                                                          ratios may not be comparable to similarly titled
correctness of the information or opinions            assumptions about the Company and its
                                                                                                          measures used by other companies and have
contained herein. None of the Company or any          subsidiaries, which are beyond the control of the
                                                                                                          limitations as analytical tools and should not be
of their respective affiliates, advisors, or          Company. In light of these risks, uncertainties
                                                                                                          considered in isolation or as a substitute for
representatives shall have any liability              and assumptions, actual results may not occur
                                                                                                          analysis of our operating results as reported
whatsoever (in negligence or otherwise) for any       or may differ materially from those predicted in
                                                                                                          under IFRS or any GAAP.
loss whatsoever arising from any use of this          the forward-looking statements and from the
document, or its contents, or otherwise arising in    past performance of the Company. As a result,
connection with this document.                        you should not rely on these forward-looking
                                                      statements. The Company accepts no obligation
This document does not constitute, or form part
                                                      to update any forward-looking statements set
of, an offer or invitation to purchase any
                                                      forth herein or to adjust them to future events
securities and neither it nor part of it shall form
                                                      or developments.
the basis of, or be relied upon in connection with,
any contract or commitment whatsoever.

                                                                                        WINTERSHALL DEA INVESTOR PRESENTATION
                                                                                                       PAGE 2
COMPANY OVERVIEW

    WINTERSHALL DEA INVESTOR PRESENTATION
                   PAGE 3
WINTERSHALL DEA INVESTOR PRESENTATION

FOCUSED ACTIVITIES ALONG THE E&P VALUE CHAIN

  01       UPSTREAM
                                                                       02             MIDSTREAM

           Exploration, Development                                                   European Pipeline
           and Production                                                             Networks
           Diversified upstream activities                                            High quality and stable
           with full lifecycle capabilities                                           midstream business

                                              WINTERSHALL DEA INVESTOR PRESENTATION
                                                             PAGE 4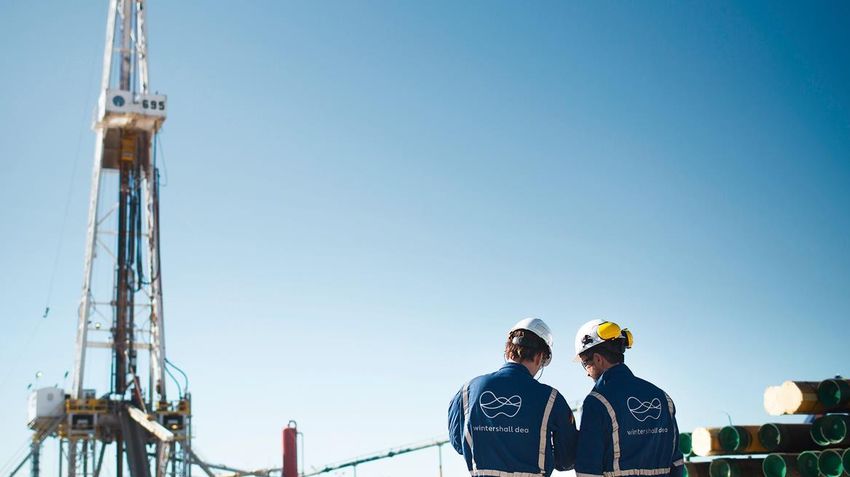
WINTERSHALL DEA INVESTOR PRESENTATION

WINTERSHALL DEA AT A GLANCE

OPERATIONAL                                                                        GEOGRAPHICAL                                                FINANCIAL

13                              Countries                                                                                      Russia          1,643       EBITDAX
                                                                                                           Northern
                                                                                                                                               € million
                                                                                                            Europe

                                                                                                          Algeria
                                                                                           Mexico

623                                                                                                                                            1,604
                                                                                                                                   UAE
                                                                                                                    Libya Egypt
                                Production(1)                                                                                                              Operating Cash Flow
                                (FY 2020)
mboe/d                                                                                                                                         € million

                                                                                                        Brazil

                                                                                          Argentina

3.6                             2P Reserves(2)                                                                                                 Baa2        by Moody‘s

                                                                                                                                               BBB
                                (as of Dec 31, 2020)
billion
                                                                                                                                                           by Fitch

(1)   ON A WORKING INTEREST BASIS, INCLUDING PROPORTIONAL PRODUCTION FROM AT EQUITY ACCOUNTED COMPANIES , EXCLUDING LIBYA ONSHORE PRODUCTION
(2)   INTERNAL RESERVES ESTIMATE
                                                                                                  WINTERSHALL DEA INVESTOR PRESENTATION
                                                                                                                 PAGE 5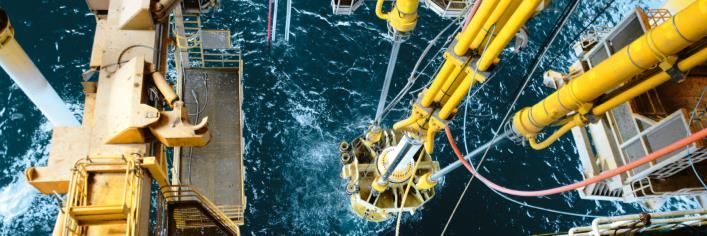
WINTERSHALL DEA INVESTOR PRESENTATION

OUR STRATEGY

           LANDSCAPE                                                            OUR STRATEGY

           Climate change and energy                                  01        Profitable growth driving shareholder returns
           transition

                                                                      02        Strict financial discipline
           Global energy demand
           growth
                                                                      03        Focus on sustainability
           Renewables cannot keep
           up with demand growth
                                                                      04        Advantaged upstream portfolio

           Abundance of low cost
           fossil fuels
                                                                      05        High quality and stable midstream business

                                        WINTERSHALL DEA INVESTOR PRESENTATION
                                                       PAGE 6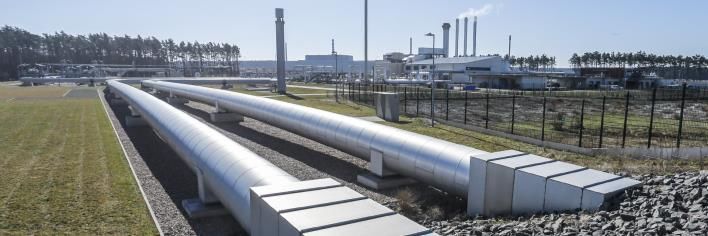
•   TBU

Q4 AND FULL YEAR 2020 RESULTS PRESENTATION

KEY ACHIEVEMENTS IN 2020

                                       PRESERVING FINANCIAL STRENGTH WHILE DELIVERING ON STRATEGY

      1                                            2                                             3                                 4

Decisive response to                              Prioritized our strong                      Strong operational delivery        Advancing Sustainability
COVID-19 pandemic                                 balance sheet                                                                  Goals
Protected our people                              Implemented liquidity                       Production at the upper end of     Net zero 2030 target
                                                  measures                                    initial guidance
Set clear priorities                                                                                                             Established a new division for
                                                  Suspended dividend                          Record low FY production cost of   carbon capture and hydrogen
                                                                                              €3.5/boe(1)
                                                  Generated positive FCF                                                         Upgraded by Sustainalytics
                                                  and reduced net debt                        Successful exploration campaign    to 4th percentile in the industry
                                                                                                                                 group
                                                                                              Integration and merger synergies
                                                                                              on track
(1)       EXCLUDING A ONE-OFF EFFECT IN Q4 2020

                                                                           WINTERSHALL DEA INVESTOR PRESENTATION
                                                                                          PAGE 7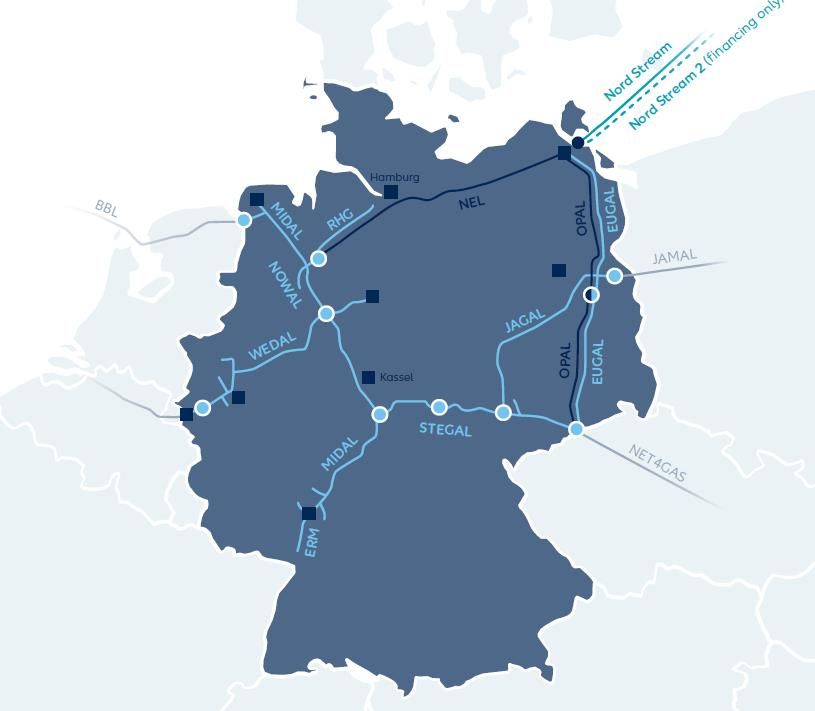
WINTERSHALL DEA INVESTOR PRESENTATION

OPERATIONAL HIGHLIGHTS

                                                                                                       RUSSIA

Northern Europe                                                                                                 Russia
Record production of 206 mboe/d in 2020                                                                         Record production of 295 mboe/d
                                                            NORTHERN EUROPE                                     in 2020
3 projects onstream: Ærfugl, Snorre Expansion
Project and Sillimanite                                                                                         Yuzhno-Russkoye Turonian layer
                                                                                                                onstream
Njord and Nova delayed due to COVID-19
constraints                                                                                                     Achimov 4A/5A Q1 2021
                                                                                                                commissioning
                                                MEXICO
                                                                  ALGERIA                        UAE
                                                                               LIBYA EGYPT

Latin America                                                                                                   Middle East /
                                                                 BRAZIL                                         North Africa
Successful exploration campaign in Mexico,
with play opening discoveries                                                                                   Raven progressed and currently in
                                                                                                                commissioning
Seismic campaign in Brazil finalized                      ARGENTINA
                                                                                                                Ghasha EPC contracts retendered
                                                                                                                Handover of operatorship in Libya

                                                         WINTERSHALL DEA INVESTOR PRESENTATION
                                                                        PAGE 8
TBU:
                                         •   Brage Pic ok?

INVESTMENT
 HIGHLIGHTS

 WINTERSHALL DEA INVESTOR PRESENTATION
                PAGE 9
WINTERSHALL DEA INVESTOR PRESENTATION

THE LEADING EUROPEAN INDEPENDENT GAS AND
OIL COMPANY

                                        Large and diversified                              Strong partnerships with
                                  01    upstream portfolio
                                                                                      04   world class operators

                                                                                           Robust financial policy anchored in
                                        High quality and stable
                                  02    midstream business
                                                                                      05   our commitment to investment grade
                                                                                           ratings

                                        Resilience through top decile                      Excellent ESG footprint and strong
                                  03    production costs                              06   commitment to Net Zero 2030

                                              WINTERSHALL DEA INVESTOR PRESENTATION
                                                             PAGE 10
WINTERSHALL DEA INVESTOR PRESENTATION
01 LARGE AND DIVERSIFIED UPSTREAM PORTFOLIO
RESILIENT AND DIVERSIFIED PORTFOLIO
2020 Production
Northern
Europe Russia Russia LATAM
12% Northern
2020 Production: 2020 Production: Europe
206 mboe/d 295 mboe/d MENA 33%
8%
623(1)
mboe/d
Algeria
UAE
Russia
Mexico Libya Egypt 47%
2020 2P Reserves
Latin
America MENA
Liquids
2020 Production: 2020 Production: 29%
74 mboe/d 48 mboe/d
Gas 3.6 2P Reserves Life
Brazil 71%
bn boe
Argentina 16 years
Established Upstream Growth Upstream Other Business
Business Units Business Units Units
(1) ON A WORKING INTEREST BASIS, INCLUDING PROPORTIONAL PRODUCTION FROM AT EQUITY ACCOUNTED COMPANIES , EXCLUDING LIBYA ONSHORE PRODUCTION
WINTERSHALL DEA INVESTOR PRESENTATION
PAGE 11WINTERSHALL DEA INVESTOR PRESENTATION
02 HIGH QUALITY AND STABLE MIDSTREAM BUSINESS
OUR PIPELINE NETWORK STRONG FINANCIAL CONTRIBUTION TO THE GROUP(1)
(€ MILLION)
~4,000 km
onshore gas 275
pipelines
Predictable and stable
business
193 196
Buffer against commodity
price volatility
114
High quality and modern
infrastructure assets
Long-term potential in
low-carbon environment –
2 hydrogen transportation
Compressor stations Transit pipeline (third-party) 2019 2020
NEL/OPAL Nord Stream
GASCADE pipeline network Nord Stream 2 (financing only) EBITDA Net Income
(1) FROM DECEMBER 2019, WIGA GROUP CONSOLIDATED AT EQUITY
(2) UNAUDITED LIKE-FOR-LIKE PRESENTATION
WINTERSHALL DEA INVESTOR PRESENTATION
PAGE 12WINTERSHALL DEA INVESTOR PRESENTATION
03 RESILIENCE THROUGH TOP-DECILE PRODUCTION COSTS
PRODUCTION COSTS OF PEERS(1) IN 2019 PRODUCTION COSTS OVER TIME (€/BOE)
~50%
7.1
3.5(3)
Peer median 2014
(2)
2020
NOTE: PEERS INCLUDE AKER BP, LUNDIN, GALP, OMV, BP, ENI, EQUINOR, SHELL, TOTAL, FIGURES ARE BASED ON REPORTED DATA
(1) PRODUCTION COSTS INCLUDE ONLY PRODUCTION RELEVANT EXPENSES
(2) LIKE-FOR-LIKE PRESENTATION WINTERSHALL DEA INVESTOR PRESENTATION
(3) EXCLUDING ONE-OFF EFFECT IN Q4 2020 RELATED TO A PRE-MERGER COMMERCIAL SETTLEMENT OF €44 MILLION WITH A THIRD PARTYPAGE 13WINTERSHALL DEA INVESTOR PRESENTATION
04 STRONG PARTNERSHIPS WITH WORLD CLASS OPERATORS
PROVEN PARTNERSHIP MODEL WITH LONG HISTORY OF OPERATIONAL TRACK RECORD
Country Production 2020, Operating in the Key Partners
mboe/d country since
~2/3 of
production(1) Non-operated
own or Russia 295 1990s
JV-operated
Norway 154 1970s
JV-operated
Argentina 69 1980s
Egypt 36 1970s
Operated Mexico 5 2017
UAE N/A 2018
(1) 2020 PRODUCTION SPLIT
WINTERSHALL DEA INVESTOR PRESENTATION
PAGE 14WINTERSHALL DEA INVESTOR PRESENTATION
05 ROBUST FINANCIAL POLICY ANCHORED IN
OUR COMMITMENT TO INVESTMENT GRADE RATINGS
CAPITAL ALLOCATION FRAMEWORK CLEAR PRIORITIES AND CAPITAL ALLOCATION
Conservative capital structure & Sustaining and
financial discipline 01
committed capex
Commitment to investment grade rating
02 Balance sheet
Shareholder returns
€
Build capacity to pay competitive dividends
through the cycle.
03 Dividend
Value-driven growth
Disciplined capital allocation in selected 04 Growth
€ profitable growth
WINTERSHALL DEA INVESTOR PRESENTATION
PAGE 15• Placeholder
• To be further
expanded
WINTERSHALL DEA INVESTOR PRESENTATION
06 OUR CLIMATE TARGETS AND AMBITIONS
~70% GAS Advantageous low-emission,
low-cost portfolio
Net zero
activities(1)
by 2030
Signatory of Methane
Committed to the
0.1% Guiding Principles
World Bank’s initiative Maintain Zero
methane intensity(2) since 2017
“Zero Routine Flaring by 2030” routine flaring
by 2025
Reduce Investments in
5 PROJECTS
net carbon
intensity
Hydrogen and CCS
1 NEW DIVISION
~€400 million to be invested in the next 10 years
(1) SCOPE 1 AND 2; OPERATED AND NON-OPERATED AT EQUITY SHARE BASIS
(2) 100% OF METHANE EMISSIONS FROM WINTERSHALL DEA'S OPERATED ASSETS DIVIDED BY THE SHARE OF MARKETED GAS
WINTERSHALL DEA INVESTOR PRESENTATION
PAGE 16FINANCIAL AND
OPERATIONAL RESULTS
WINTERSHALL DEA INVESTOR PRESENTATION
PAGE 17• TBU
WINTERSHALL DEA INVESTOR PRESENTATION
2020 PERFORMANCE
HEALTH AND OPERATIONAL FINANCIAL
SAFETY
2.07 TRIR(1)
FY 2019: 2.66
623 Production(2)
Q4 2020: 654 mboe/d
1,643 EBITDAX
Q4 2020: €500 million
mboe/d FY 2019: 617 mboe/d € million FY 2019: €2,801 million
1.04 LTIF(1)
FY 2019: 0.43
3.5 Production Cost(3)
Q4 2020: €4.6/boe
195 Adj. Net Income
Q4 2020: €128 million
€ per boe € million FY 2019: €512 million
FY 2019: €3.8/boe
1,237 CAPEX(4)
Q4 2020: €295 million
159 Free Cash Flow
Q4 2020: €278 million
€ million FY 2019: -€118 million
FY 2019: €1,494 million € million
(1) FIGURES ARE BASED ON THE LAST 12 MONTHS, THEREFORE Q4 CORRESPONDS TO THE ANNUAL VALUE
(2) ON A WORKING INTEREST BASIS, INCLUDING PROPORTIONAL PRODUCTION FROM AT EQUITY ACCOUNTED COMPANIES , EXCLUDING LIBYA ONSHORE PRODUCTION
(3) EXCLUDING ONE-OFF EFFECT IN Q4 2020 RELATED TO A PRE-MERGER COMMERCIAL SETTLEMENT OF €44 MILLION WITH A THIRD PARTY
(4) EXCLUDING CAPITALIZED EXPLORATION AND ACQUISITIONS PAGE 18
NOTE: ALL FY 2019 FIGURES SHOWN ON A LIKE-FOR-LIKE BASIS, AS A SUM OF WINTERSHALL DEA GROUP, WINTERSHALL GROUP AND DEA GROUP FIGURES• TBU
WINTERSHALL DEA INVESTOR PRESENTATION
PRODUCTION
PRODUCTION(1) (WI, MBOE/D) 2020 PRODUCTION(1) COMPOSITION
% Gas 72 % 72 % 72 % 69 % 73 % 70 % Brent
Crude
19%
637 654
617 623 Russia
566 581 74 38% Gas
75
623
76 74
69 43
74 51 48 55
34
37 Europe 17% (mboe/d)
Spot Gas
316
289 295 279 307
252
6%
10%
Other Non- 10%
Europe Gas Russia
Argentina Condensate
203 201 206 198 200 221
Gas
(2) (2)
2018 2019 2020(2) Q4 2018 (2) Q4 2019 Q4 2020
~36% of total production linked directly
to spot Brent and European gas prices
Northern Europe Russia MENA Latam
(1) ON A WORKING INTEREST BASIS, INCLUDING PROPORTIONAL PRODUCTION FROM AT EQUITY ACCOUNTED COMPANIES , EXCLUDING LIBYA ONSHORE PRODUCTION
(2) LIKE-FOR-LIKE PRESENTATION
WINTERSHALL DEA INVESTOR PRESENTATION
PAGE 19• TBU
WINTERSHALL DEA INVESTOR PRESENTATION
REALISATIONS
GAS ($/MSCF) LIQUIDS ($/BOE)
-31% -25%
+26% +7%
2.3
52
1.8
40 39 38 40
1.6
1.4
28 26
30
(1,2) (2) (2) (1,2) (2) (2)
2019 2020 Q3 2020 Q4 2020 2019 2020 Q3 2020 Q4 2020
Realized price (3) Realized price, excl. Russian condensate
-38% +114% -35%
+2%
(4) (5)
TTF 5.0 4.5 BRENT 64
($/MSCF) ($/BBL) 43 44
3.1 42
2.1
(1) LIKE-FOR-LIKE PRESENTATION
(2) UNAUDITED
(3) AVERAGE REALISED LIQUIDS PRICE INCLUDING OIL PRICE HEDGE RESULT WINTERSHALL DEA INVESTOR PRESENTATION
(4) SOURCE: HEREN/ARGUS; FX CONVERSION ACCORDING TO ECB PAGE 20
(5) SOURCE: PLATTS• TBU
WINTERSHALL DEA INVESTOR PRESENTATION
COST PERFORMANCE
PRODUCTION COST EVOLUTION (€/BOE)
~-30%
5.0
4.6
3.8
3.5(1)
(2) (2) (2)
2017 2018 2019 2020
(1) EXCLUDING ONE-OFF EFFECT IN Q4 2020 RELATED TO A PRE-MERGER COMMERCIAL SETTLEMENT OF €44 MILLION WITH A THIRD PARTY
(2) DATA FROM JANUARY 2017 TILL MAY 2019 HAS BEEN PREPARED BY AGGREGATING THE FIGURES FOR WINTERSHALL GROUP AND DEA GROUP ON A LIKE-FOR LIKE BASIS
WINTERSHALL DEA INVESTOR PRESENTATION
PAGE 21• TBU
WINTERSHALL DEA INVESTOR PRESENTATION
PROFITABILITY
EBITDAX (€ MILLION) ADJUSTED NET INCOME(1) (€ MILLION)
-41% -62%
+88%
2,801
+25% 512
128
500
1,643 399
68
195
2019 2020 Q3 2020 Q4 2020 2019 2020 Q3 2020 Q4 2020
(1) ADJUSTED NET INCOME IS NET INCOME ADJUSTED FOR SPECIAL ITEMS SUCH AS IMPAIRMENTS, EXPENSES RELATED TO THE MERGER, DECONSOLIDATION EFFECTS AND OTHER ONE-OFF EFFECTS
WINTERSHALL DEA INVESTOR PRESENTATION
PAGE 22• TBU
WINTERSHALL DEA INVESTOR PRESENTATION
LIQUIDITY AND NET DEBT
LIQUIDITY EVOLUTION (€ MILLION) NET DEBT (DEC 2020), PRO FORMA JAN 2021 SUBORDINATED
NOTES TRANSACTION (€ MILLION)(2)
€ 1.7 bn € 2.2 bn
Pro forma
leverage 2.4x
450 6,350
0 530 830
1,830 1,500
900 900
5,530 5,520
4,000 4,030 4,020
814 821
Dienstag, 31. Dezember 2019 Donnerstag, 31. Dezember 2020 Total debt Cash, cash eq. and Net Debt Subordinated Notes PF Net debt
financial receivables Dec 31, 2020 Issuance
(1) from cash pooling
Cash RCF WCL
Notes Debt to Banks Other
(1) UNDRAWN COMMITTED RCF, DUE 2025
(2) NET DEBT POSITION AS OF 31 DECEMBER 2020 PRO FORMA OF JANUARY 2021 SUBORDINATED TRANSACTION, ROUNDED TO THE NEAREST 10, INDIVIDUAL FIGURES MAY NOT SUM UP TO TOTAL, SUBORDINATED DEBT TREATED AS EQUITY
WINTERSHALL DEA INVESTOR PRESENTATION
PAGE 23APPENDIX
WINTERSHALL DEA INVESTOR PRESENTATION
PAGE 24WINTERSHALL DEA INVESTOR PRESENTATION
RESERVES(1)
OVERVIEW (BILLION BOE)
2P product split 2P regional split
Significant
undeveloped
Condensate
reserves upside
2P R/P MENA
14%
10%
16 years Other
1P R/P 2.1 liquids
15% Russia 61% 6% Latam
12 years 71% Gas
23% Northern
Europe
2PUD
50%
50%
2PD
2.7 3.6 5.7
1P 2P 2C 2P+2C
(1) AS OF 2020, DECEMBER 31ST INTERNAL RESERVES ESTIMATE
WINTERSHALL DEA INVESTOR PRESENTATION
PAGE 25WINTERSHALL DEA INVESTOR PRESENTATION
RESULTS SUMMARY
Unit FY 2020 Q4 2020 Q3 2020 FY 2019(2) Q4 2019(2)
Production(1) mboe/d 623 654 606 617 637
Environment
Brent $/boe 43 44 43 64 63
Gas TTF $/mscf 3.1 4.5 2.1 5.0 4.8
EBITDAX € million 1,643 500 399 2,801 649
Financial Results
Operating Cash Flow € million 1,604 602 401 1,866 325
Capex(3) € million 1,237 295 252 1,494 428
Free Cash Flow € million 159 278 89 -118 -248
Adjusted Net Income € million 195 128 68 512 71
31.12.2020 31.12.2020 30.09.2020 31.12.2019 31.12.2019
Balance Sheet
Net Debt € million 5,519 5,519 5,857 5,762 5,762
Liquidity
Leverage Ratio (LTM) x 3.4 3.4 3.4 2.1 2.1
Cash & Cash Equivalents € million 821 821 537 814 814
Liquidity € million 2,171 2,171 1,887 1,714 1,714
(1) ON A WORKING INTEREST BASIS, INCLUDING PROPORTIONAL PRODUCTION FROM AT EQUITY ACCOUNTED COMPANIES , EXCLUDING LIBYA ONSHORE PRODUCTION
(2) LIKE-FOR-LIKE PRESENTATION
(3) EXCLUDING CAPITALISED EXPLORATION AND ACQUISITIONS WINTERSHALL DEA INVESTOR PRESENTATION
PAGE 26WINTERSHALL DEA INVESTOR PRESENTATION
HIGHLY EXPERIENCED AND DIVERSE LEADERSHIP TEAM
Mario Mehren Paul Smith Dawn Summers Thilo Wieland Hugo Dijkgraaf
Chairman of the CFO COO Northern Board Member CTO
Board and CEO Europe and MENA for Russia, LatAm
and Midstream
CEO of Wintershall, Chairman of Co–Founder & CFO, Vesta Energy Chief Operating Officer, Beach Member of the Board of Executive Managing Director of Wintershall
the Board of Executive Directors (2017-2019) Energy (2018-2020) Directors of Wintershall (2015-2019) Norge (2017-2019)
(2015-2019)
CFO and Executive Vice President, Chief Operating Officer, Origin Various other positions with Various other positions with
Member of the Board of Executive Talisman Energy (2013 – 2016) Energy (2016-2018) Wintershall since 1999, including Wintershall since 2000, including
Directors of Wintershall General Manager, Libya Vice President and Project Director
responsible for Exploration & Executive Vice President, North Head of HSE , Operations and (2014 – 2015) and Vice of the Maria development, Norway
Production Russia, North Africa America, Talisman Energy (2009 – Development, Genel Energy (2013- President, Strategy & Portfolio (2012 – 2017)
and South America (2011-2015) 2013) 2015) Management (2013 – 2014)
Head of Finance & Information Various positions with BP between Various positions with BP between
Management, Wintershall 1993 and 2009 1993 and 2013
(2006 – 2011)
Various positions with BASF (1998-
2006)
10+ years in senior E&P roles 25+ years in E&P 25+ years in E&P 20+ years in E&P 15+ years in E&P
WINTERSHALL DEA INVESTOR PRESENTATION
PAGE 27WINTERSHALL DEA INVESTOR PRESENTATION
SHAREHOLDER STRUCTURE AND CORPORATE GOVERNANCE
SHAREHOLDER STRUCTURE GOVERNANCE
SHAREHOLDER COMMITTEE
Supervisory Board
Oversight of the Management Board Lord Browne
Chairman rotates every 15 months between two of Madingley
shareholders
5.7% 67% (33% Hans-Ulrich Engel
(72.7%) (27.3%) Shareholders’ Committee
Approval of annual budgets, new country entries,
Wintershall Dea GmbH major capital commitments and changes to corporate
Michael Heinz
governance
Executive Board German Khan
Responsible for delivering the strategy and ongoing
Ordinary shares operations
Preference shares(1)
(1) PREFERENCE SHARES WILL BE CONVERTED INTO ORDINARY SHARES IN WINTERSHALL DEA NO LATER THAN 36 MONTHS AFTER CLOSING BUT IN ALL CASES BEFORE AN IPO.
WINTERSHALL DEA INVESTOR PRESENTATION
PAGE 28WINTERSHALL DEA INVESTOR PRESENTATION
UPSTREAM PORTFOLIO OVERVIEW
Northern Europe Russia
Germany − Participation in world-class assets starting from
Managing late life assets and production decline; early 1990s
technological base with focus on EOR Russia − Low-cost production supported by giant reserves base
Norway − Long plateau production with significant cash flow
− Current production and development area with significant generation
short-medium term growth and attractive exploration
− Long-term contractual offtake agreements
upside in proximity to existing infrastructure
− Exploration: Focus on value creation in the vicinity of
operating fields and infrastructure
Rest of Europe Algeria Middle East and North Africa
Shallow water operations focusing on production
Mexico
optimization UAE Egypt
Libya Egypt Long history in the region with stable production even
during past political unrest
Latin America
UAE
Mexico Future of the Middle Eastern new production following the
− Mature onshore oil production and participation in one of acquisition of the Ghasha concession, highly promising gas
the world’s largest shallow-water discoveries and condensate offshore development project
− Exploration: Major exploration opportunity in recently
acquired blocks Algeria
Brazil
Brazil Participation in the gas development project in the Sahara
Exploration: Participation in offshore exploration licenses in with challenging geological and logistical demands
one of the most attractive hydrocarbon provinces aiming to
Argentina
build a significant resource base Libya
History of stable production interrupted by current
Argentina
geopolitical issues
Established operations in onshore and offshore fields
WINTERSHALL DEA INVESTOR PRESENTATION
PAGE 29WINTERSHALL DEA INVESTOR PRESENTATION
DEFINITIONS
Adjusted • Defined as EBITDAX less depreciation and amortisation, less exploration expenses, plus financial income, less financial expenses and less income taxes, adjusted for special
Net Income items as well as tax effects on adjusted special items or not considered items
CAPEX • Capex for the Group consists of payments for intangible assets, property, plant and equipment and investment property less capitalised exploration
• Defined as revenues and other income less production and operating expenses, less production and similar taxes, less general and administrative expenses and less cost of
EBITDAX
sales midstream, adjusted for special items
Free cash • Free cash flow for the Group comprises the cash flow from operating activities less payments for intangible assets, property, plant and equipment and investment properties,
flow less changes in financial receivables plus payments for financial acquisitions (that are not acquisitions)
Leverage • Net debt divided by last twelve months EBITDAX
LTIF • Lost time injury frequency per million work-hours
Methane
• Calculated in accordance with OGCI (Oil and Gas Climate Initiative) methodology
Intensity
• Net debt consists of liabilities to banks, senior bonds, interest bearing financial liabilities from cash-pooling towards related parties and leasing liabilities less cash and cash
Net Debt
equivalents and less interest-bearing financial receivables from cash-pooling from related parties
Production
• Production costs include G&A allocation but exclude export and processing tariffs, finance items and R&D
costs
TRIR • Total Recordable Incident Rate per million hours worked
NOTE: CERTAIN NUMERICAL FIGURES AND PERCENTAGES SET OUT IN THIS PRESENTATION HAVE BEEN SUBJECT TO ROUNDING ADJUSTMENTS.
WINTERSHALL DEA INVESTOR PRESENTATION
PAGE 30You can also read