CEWE ANNUAL PRESS & ANALYSTS' CONFERENCE - CEWE STIFTUNG & CO. KGAA MARCH 25, 2021 - CEWE IR
←
→
Page content transcription
If your browser does not render page correctly, please read the page content below

CEWE Annual Press &
Analysts‘ Conference
CEWE Stiftung & Co. KGaA

March 25, 2021
CEWE acts with clear priorities in Corona crisis

         We focus on health and safety of our employees
     1
     2   We secure production capabilities of our laboratories and printing plants

     3   We keep online and mobile sites up and communicate with our customers

     4   We ensure cost reductions and review investments

     5   We seek „Corona-upsides“

 2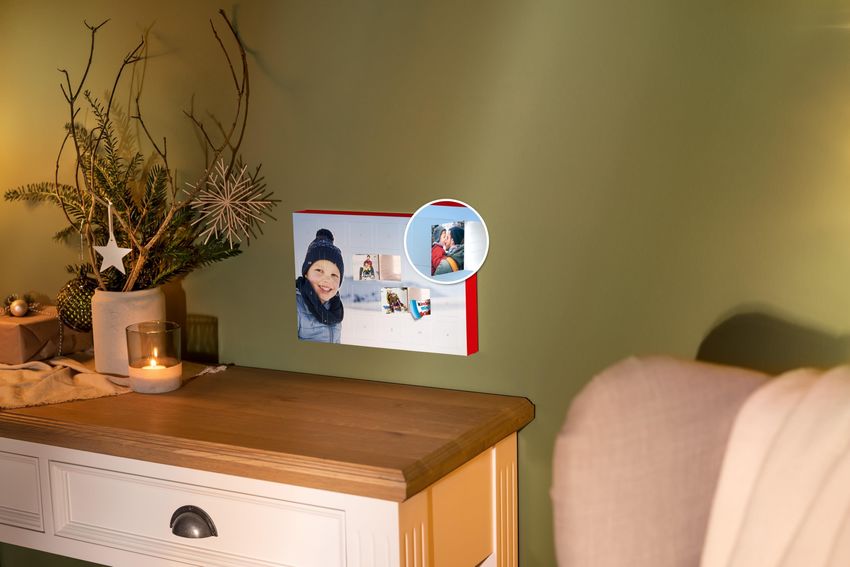
Revenue development: CEWE continues to grow in 2020

    Revenue (CONCEPTUAL)

            Photofinishing                                                                                   Transformation phase
            Commercial Online-Print                                                                          Analogue / Digital
            Hardware Retail
             199 1

                             199 3

                                                                     199 8

                                                                                     200 0

                                                                                                             200 3

                                                                                                                             200 5

                                                                                                                                                                     201 0

                                                                                                                                                                                     201 2

                                                                                                                                                                                                                             201 7

                                                                                                                                                                                                                                             201 9
    199 0

                     199 2

                                     199 4

                                             199 5

                                                     199 6

                                                             199 7

                                                                             199 9

                                                                                             200 1

                                                                                                     200 2

                                                                                                                     200 4

                                                                                                                                     200 6

                                                                                                                                             200 7

                                                                                                                                                     200 8

                                                                                                                                                             200 9

                                                                                                                                                                             201 1

                                                                                                                                                                                             201 3

                                                                                                                                                                                                     201 4

                                                                                                                                                                                                             201 5

                                                                                                                                                                                                                     201 6

                                                                                                                                                                                                                                     201 8

                                                                                                                                                                                                                                                     202 0

                                                                                                                                                                                                                                                             e20 21
3
2020 EBIT continues the trend of increasing earnings
in Euro millions
                                                                                                             EBIT 2020:
                                                                                                  79.7   79.7 Euro millions

                                                                                           56.8
                                                                                    55.7
                                                                             49.2
                                                                      47.0

                                                               36.4
                                                        32.6
                                   29.4   28.3   28.9
                            27.2

                     17.9
              11.2

             2008 2009 2010 2011 2012 2013 2014 2015 2016 2017 2018 2019 2020

4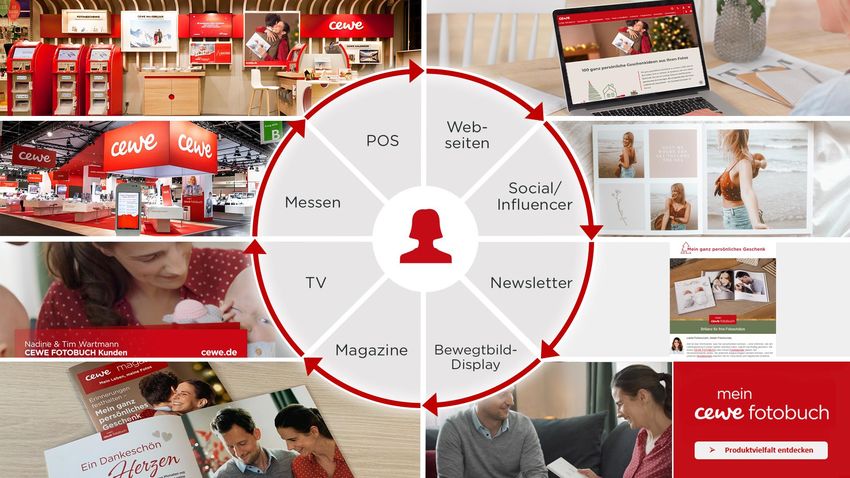
Agenda
1. Corporate Development by Business Segments

  1.1 Photofinishing
  1.2 Retail
  1.3 Commercial Online-Print
  1.4 Other

2. Group Results 2020

3. Sustainability

4. Financial Details

5. Innovation

6. Outlook 2021

7. Q&A
1.1
Photofinishing
CEWE’s omni-channel solution: Customer centric
                  THE CUSTOMER
                  CAN ORDER:                     PICKUP:

                      AT HOME

                                                   MAILORDER

                      IN STORE

                                                    IN STORE

                     ANYWHERE

7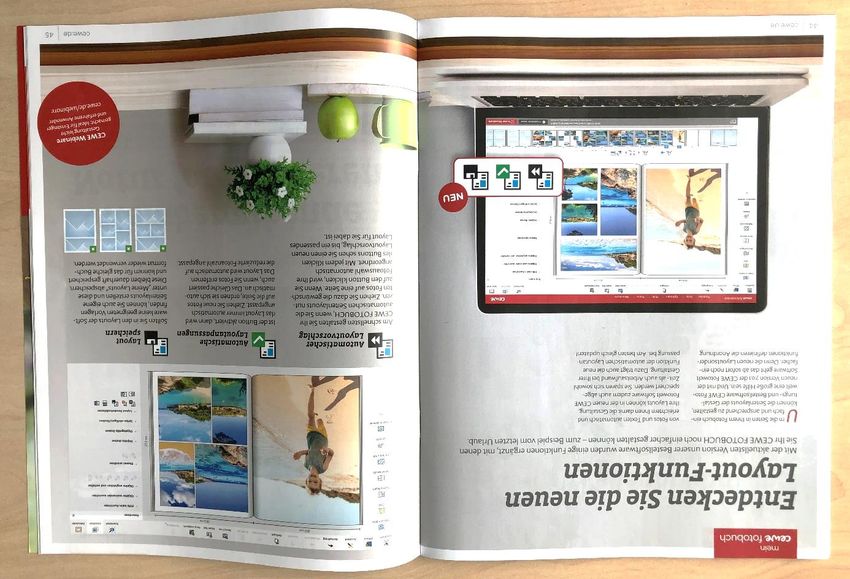
New CEWE Photo World App with automatically generated suggestions

  8

CEWE ordering software with new layout features

                                                  Automatic
                                                  layout proposal

                                                  Automatic
                                                  layout adjustment

                                                  Save layout

  9
New trading partner Boots in Great Britain :
Rollout went extremely well despite Corona

 10
11
Calendars
Kreativ Tipp: Kalender
Photo advent calendar with kinder® chocolate
Cards
Kreativ Tipp: Cards
CEWE PHOTOBOOK

                 Number of CEWE PHOTOBOOKS
                 in thousands

                                                                    -1.6%

                                              6.624      6.521
                  6.207   6.024    6.182

                  2016    2017     2018       2019       2020
                                  Rounding differences may occur.

     » Corona-related changes in holiday travel behavior reduced
      the number of (multi-photo product) CEWE PHOTOBOOK
16
Number of prints and turnover Photofinishing
Total prints Value per photo Turnover Photofinishing
in millions - 2.6% Turnover / photo +11.8% in Euro millions +8.9%
(Eurocent /photo
618,8
568,0
23,65 26,46 499,0
2.401 2.339 22,42
2.232 2.175 2.226 21,12 452,0 459,3
20,25
2016 2017 2018 2019 2020 2016 2017 2018 2019 2020
2016 2017 2018 2019 2020
Rounding differences may occur.
» Rising share of value-added (and single-photo) products increases turnover per photo
17Photofinishing-Turnover by Quarter
Seasonal distribution: CEWE 2016 to 2020 – Share in turnover by quarter as a million
The arrows symbolize the long-term development trend.
283.0
251.1
218.3
190.0 195.4
114.7 110.6 116.2* 110.4
85.5 85.6 94.5 103.5 85.9
97.2 95.4 96.3 100.4
81.1 82.1
2016 2017 2018 2019 2020 2016 2017 2018 2019 2020 2016 2017 2018 2019 2020 2016 2017 2018 2019 2020
Q1 2019 Q2 2019 Q3 2019 Q4 2019
Turnover 2019 97.2 m€ 116.2 m€ 251.1 m€
103.5 m€
Turnover 2020
Q1 Actual
114.7 m€ Q2 Actual
110.6 m€
Q3 Actual
110.4 m€ Q4 Actual
283.0 m€
» Photofinishing with growth in 2020
* in 2019, WhiteWall contributed completely inorganically to Q3 growth Rounding differences may occur.
18Business segment Photofinishing Photofinishing grew by 8.9% in 2020, with acquired wall-art specialist
WhiteWall still contributing non-organically to this growth in the period
in Euro millions from January to May
As of mid-March the coronavirus also had an impact on
+8.9 %
photofinishing: Instant-print POS business was affected by shop
Turnover closures, while online photofinishing business saw the stay-at-home
568.0 618.8
499.0 effect resulting in a strong level of incoming orders
452.0 459.3
Q3 was dominated by a change in holiday travel behaviour to result
in fewer (holiday) photos overall and in consequence also in fewer
orders for photos and less turnover
In Q4, Christmas business, which was once again even stronger,
2016 2017 2018 2019 2020 played a most significant role in the development of the entire year
EBIT
88.6 Photofinishing EBIT increased considerably by EUR 21.7 million
66.9
52.0 53.9 57.8
Besides additional contribution margins from the rise in sales
(particularly those from Christmas business due to considerable
economies of scale in production), the cost-reduction programme
initiated as early as in March also played a role in improving the EBIT
2016 2017 2018 2019 2020
2020 special effects: -5.0 Euro million
» Marked improvement in photofinishing earnings in 2020 Effects resulting from DeinDesign purchase-price allocation: - EUR 0.2 million
Effects resulting from Cheerz purchase-price allocation: - EUR 2.0 million
» It was mainly economies of scale in the production of Effects resulting from WhiteWall purchase-price allocation: - EUR 2.1 million
Restructuring (Photofinishing-share in Retail and DK): EUR -0.7 million
additional Christmas orders, together with reduced
2019 special effects: -3.6 Euro million
costs, that contributed to this improvement Effects resulting from DeinDesign purchase-price allocation: - EUR 0.4 million
Effects resulting from the Cheerz purchase-price allocation: - EUR 1.9 million
19 Rounding differences may occur.
Effects resulting from the WhiteWall purchase-price allocation: - EUR 1.2 millionOperational Photofinishing EBIT margin* continues to increase
15.1%
12.4%
11.7% 11.9% 12.1%
10.2% 10.5%
9.5%
8.6% 9.0%
7.8%
2010 2011 2012 2013 2014 2015 2016 2017 2018 2019 2020
» Especially economies of scale in the production of additional Christmas orders,
together with corona-related cost savings, contributed to this improvement
20 * without special items shown in segment reporting (mainly PPA-effects)Photofinishing-EBIT by Quarter
Seasonal distribution: CEWE 2016 to 2020 – EBIT before restructuring by quarter in million euros
2016 2017 2018 2019 2020 2016 2017 2018 2019 2020
The arrows symbolize the long-term development trend. 80.7
64.3
55.6
45.9 48.3
3.0 3.3 5.1 5.6 4.1
1.2 1.3 1.4 0.2 2.6 0.8 0.2
-0.5 -1.8 -1.1 2016 2017 2018 2019 2020 2016 2017 2018 2019 2020
2016 2017 2018 2019 2020 2016 2017 2018 2019 2020 2016 2017 2018 2019 2020 2016 2017 2018 2019 2020
Q1 2019 Q2 2019 Q3 2019 Q4 2019
EBIT 2019
3.0 m€ -1.1 m€ 0.8 m€ 64.3 m€
EBIT 2020
Q1 Actual
3.3 m€
Q2 Actual
5.1 m€
Q3 Actual
0.2 m€ Q4 Actual
80.7 m€
» Photofinishing with strong increase in earnings in 2020
Rounding differences may occur.
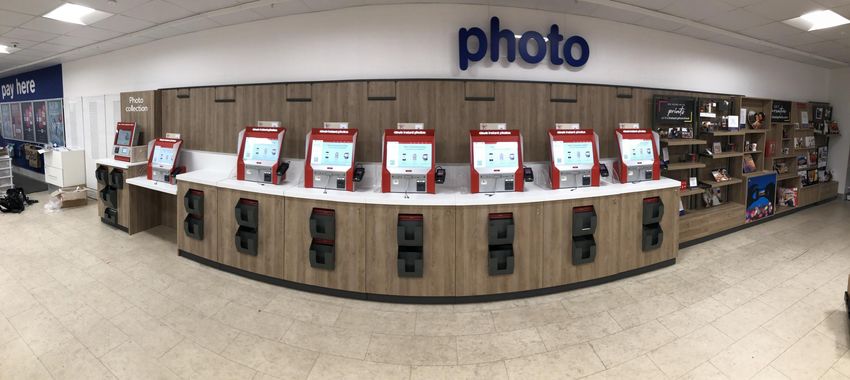
211.2 Retail
Retail with focus on photofinishing business
Own retail stores in NO, PL, CZ, SK
Strategic focus on photofinishing and
online business
EUR 34.1 million revenue (2020) with
photo-hardware (cameras, lenses, …)
» Retail segment contains hardware revenue only, photofinishing business
is shown in photofinishing segment
23Business segment Retail*
in Euro millions As a result of coronavirus-related business closures, hardware
retailing was impacted by the shutdown, with sales declining by
21.8% in 2020
Turnover * Due to a focus on photofinishing business and to refraining from
low-margin hardware business, the active reduction in turnover
-21.8 % before the onset of the coronavirus crisis was still at around a
54.9 53.0 48.7 strategic -10%
43.7 34.1
2016 2017 2018 2019 2020 Coming out of the crisis stronger: CEWE is closing altogether
more than 30 branches in all the countries in which the
EBIT * company conducts retail business
0.6 Corona-induced accelerated pursuance of an optimisation
0.3 0.1 0.0 strategy with a focus on photofinishing business and online
business – and with associated restructuring costs as a special
effect
Before these one-off effects, retailing achieved an operative
-4.2 EBIT that had been improved by EUR 0.2 million, to amount to
2016 2017 2018 2019 2020 EUR 230,000 (2019: EUR 35,000)
2020 one-off effects: - EUR 4.4 million
» Hardware retailing has been affected by Restructuring provisions for retailing: - EUR 2.9 million
Allowances for inventories of stocks: - EUR 1.5 million
coronavirus-related business closures
2019 one-off effects: none
» Accelerated implementation of the optimisation
* only hardware, no photofinishing
24
strategy initiated as early as in H1 2020 Rounding differences may occur.1.3 Commercial Online-Print
Commercial Online-Print

     Service focus           Cost leader in industrial online printing   Metropolitan area
                                                                              Berlin

           » Business and advertising prints: flyers, business cards,
            stationery, packaging, promotional items, etc.

26
Business segment Commercial Online-Print
in Euro millions Since as early as mid-March, COP in B2B printing has been strongly
impacted by coronavirus, with turnover declining by 34.3% in 2020
Aggregated as at the end of February (prior to the coronavirus), COP
Turnover was still increasing at a single-digit growth rate
-34.3 %
Efficient cost management together with a conversion to
101.6 103.2
84.0 84.0 performance-oriented allowances kept the decline in earnings under
67.8
control in spite of severe losses in turnover
Earnings were backed up in the amount of EUR 556,000 by
2016 2017 2018 2019 2020 reversing the remaining redundant Laserline restructure provision
In the previous year of 2019, a restructuring provision of EUR 5
EBIT million was established for merging Laserline and Saxoprint
production
Coming out of the crisis stronger: In order to ensure focussed,
1.6 1.6
efficient renewed stimulation of the online printing brands after the
coronavirus crisis, CEWE has been concentrating its brand portfolio
-1.6 -3.7
-7.7 on the Saxoprint, Viaprinto and Laserline brands since HY1 2020
2016 2017 2018 2019 2020 2020 special effects: + EUR 0.9 million
Effects resulting from the Laserline purchase-price allocation: - EUR 0.2 million
» In a B2B business environment, the COP has been Conversion to a performance-related allow. for depr. for Saxoprint: +EUR 0.6 m.
particularly hard hit by the coronavirus crisis in a B2B Reversal of remaining Laserline restructuring provision: + EUR 0.6 million
business environment 2019 special effects: - EUR 5.6 million
Effects resulting from the Saxoprint purchase-price allocation: - EUR 0.2 million
» Efficient cost management keeps the decline in earnings Effects resulting from the Laserline purchase-price allocation: - EUR 0.3 million
27 under control Restructuring provision for Laserline: - EUR 5.0 million
Rounding differences may occur.1.4 Other
Business Segment Other Structural and corporate costs and profits from
real estate property and the acquisition of stocks
in Euro millions are shown in the Other business segment.
Turnover +19.3%
6.6
5.5
3.0 4.0 The EUR 6.6 million in turnover is to be exclusively
2.2 allocated to futalis (2019: EUR 5.5 million)
2016 2017 2018 2019 2020
EBIT
EBIT mainly improved through futalis: futalis
continues to grow most positively, with earnings
-1.1 moving towards the break-even level
-2.6 -2.4
Besides, IR costs were also lower than in the
-7.2 -6.6 previous year mainly due to the switch from a
(physical) annual general meeting to a virtual online
2016 2017 2018 2019 2020 AGM
» Segment for Other business enhances turnover and improves earnings
Rounding differences may occur.
292. Group Results 2020
Turnover
in Euro millions
                                                                             +1.0%
                                                720.4             727.3     fx-adj.: +1.5%
                                                                   6.6
                                  653.3           5.5
      593.1         599.4                        43.7             34.1
                                    4.0
                                                                  67.8
        2.2           3.0          48.7          103.2
                     53.0                                                             Retail:             Development of turnover in Retail and
       54.9                       101.6                                               -21.8%              Commercial Online-Print is influenced by
       84.0          84.0                                                             (fx-adj.: -17.3%)
                                                                                                          the two shutdowns in 2020: The retail
                                                                                                          sector loses 21.8% turnover due to store
                                                                                      Commercial          closures, the COP even 34.3%.
                                                                                      Online-Print:
                                                                  618.8               -34.3%
                                                 568.0                                (fx-adj.: -34.5%)
                                  499.0
       452.0         459.3
                                                                                      Photofinishing:     Photofinishing more than compensates for
                                                                                      +8.9%               the decline in other business areas
                                                                                      (fx-adj.: +9.3%)

                                                                                                                         Rounding differences may occur.

      2016         2017          2018           2019              2020
       Pho tofinishing   Comme rci al O nline-P rint     Retail     Other

          » Growth in photofinishing can compensate for the
               (mainly corona-related) decline in other business areas
31
EBIT
Group-EBIT EBIT-Margin
in Euro millions in % of group turnover
79.7
56.8
53.7
47.0 49.2
11.0%
7.9% 8.2% 8.2% 7.9%
2016 2017 2018 2019 2020 2016 2017 2018 2019 2020
Rounding differences may occur.
» Earnings improvement in photofinishing - together with consistent cost management in all
areas of the company - overcompensates for the results of the retail and commercial online
printing business areas, which were influenced by the negative effects of the pandemic
32Earnings after tax
Earnings after tax Earnings per share
in Euro millions in Euro
51.9
7.20
36.3 5.01
32.8 31.7 4.54
29.6 4.40
4.12
2016 2017 2018 2019 2020 2016 2017 2018 2019 2020
Rounding differences may occur.
» Earnings after tax / earnings per share significantly increased
» Tax rate at expected 31.9%
33Results 2020: Dividend is to be increased again
in Euro
2.30* 12
years of consecutive
dividend increases
1.95 2.00
1.80 1.85
1.55 1.60
1.45 1.50
1.40
1.25
1.00 1.05
2008 2009 2010 2011 2012 2013 2014 2015 2016 2017 2018 2019 2020
* recommendation of board of management to
supervisory board and AGM (June 9, 2021)
» Dividend for the 2020 business year is to be increased to 2.30 euros
» Since analogue/digital transformation: twelfth consecutive dividend increase
343. Sustainability
Sustainability Report 2020
As one of the few German companies: CEWE
has been publishing a sustainability report on a
regular basis since 2010
Sustainability Report 2020 based on new 5000+
stakeholder survey
All CEWE brand products are produced climate-
neutral since 2016
CEWE already achieved the climate targets
originally set for 2025 in 2020: 50% reduction of
CO2e emissions (scope 1+2, compared to 2015)
Next goals:
» All papers used in production FSC-
certified by 2023
» Climate-neutral as a company by 2045
36CEWE acts in many dimensions of sustainability
Social commitment
» CEWE donated 1.5 million euros to
charity and local communities in 2020
» CEWE fosters photo festivals and photo
culture across Europe every year
Responsibility for employees
» CEWE regularly issues employee shares
» CEWE offers many programs to enhance
the work life/family balance
„Ehrbarer Kaufmann“
» CEWE acts on basis of the CEWE-
Customer Charter for responsible
digitisation
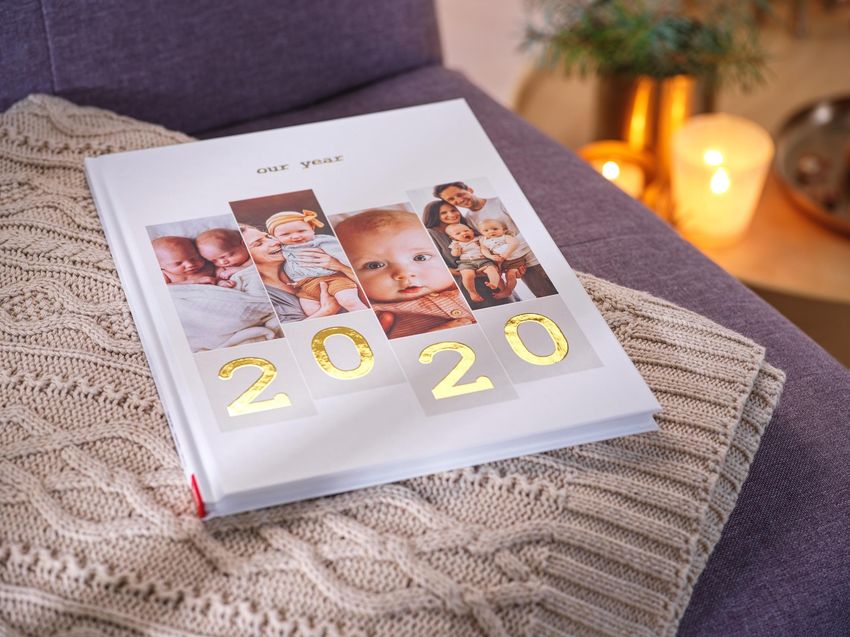
37CEWE wants to be a pioneer in the industry CEWE has already taken many steps to make its product range more and more environmentally friendly » Advent calendar with a 100% » CEWE PHOTOBOOK Pure biodegradable interior produced with recycled paper 38
Systematic analysis of the entire product portfolio
CEWE wants to know how sustainable materials and processes really are
Self-developed methodology evaluates all
CEWE products regarding the sustainability
aspects of ecology, society and economy
Targeted Optimized
Assessment based on more than 40 criteria identification sustainability
along the product life cycle of potential for
improvement of all CEWE
» raw materials products
» supply chain
» production
» use phase
» end of product life
39CEWE introduces „Supplier Sustainability Award“
Incentive, to raise awareness, to learn from each other and to pursue joint projects
» Fujifilm Europe B.V. received the CEWE Supplier » Schmidt GmbH - a supplier of wooden rails and stretcher
Sustainability Award in the ‘large enterprises’ category frames - won the ‘medium-sized enterprises’ category
Fujifilm Europe B.V. was awarded for the joint product development Schmidt GmbH was awarded for an active exchange and for addressing
project of Fujifilm and CEWE for creating FSC® certified photographic possible improvement options in the area of sustainability in its cooperation
paper, thus setting a new industry standard. with CEWE, as well as for the company’s outstanding commitment in the
field of environmental protection.
404. Financial details
Consolidated profit and loss account
(+) Sales growth in PF (+8.9%) compensated corona-related declines
Figures in millions of euros 2019 2020 ∆% ∆ Euro mill. in COP and RT
Revenues 720,4 727,3 1,0% 6,9
Increase / decrease in finished and unfinished goods 0,2 -0,4 -322% -0,6 (+) Reversal of accruals
Other own work capitalised 1,0 1,3 28,3% 0,3 (+) Gains resulting from foreign exchange differences
Other operating income 22,2 23,0 3,8% 0,8
Cost of materials -187,5 -170,1 -9,3% 17,3 (+) Material expense ratio declined in line with change in turnover structure
Gross profit 556,4 581,1 4,5% 24,8 PF / COP / RT
Personnel expenses -197,0 -196,1 -0,5% 0,9
Other operating expenses -245,4 -249,9 1,9% -4,5 (+) Job cutbacks in the business areas COP and RT
EBITDA 113,9 135,1 18,6% 21,1 (+) Social security insurance benefits (short-time work)
Amortisation/Depreciation -57,1 -55,4 -3,0% 1,7
Earnings before interest, taxes (EBIT) 56,8 79,7 40,2% 22,9 (-) PF business driven (mail-order shipping costs and retail partner commissions)
(-) Losses from exchange rate differences and allowances for bad debts
(+) Slightly lower advertising costs
Rounding differences may occur.
(+) LASERLINE restructuring costs in previous year
(+) Discontinuation of the LASERLINE production site in Berlin
(+) Changeover to a units-of-prodution-oriented depreciation at SAXOPRINT
(-) Restructuring accruals for optimization of shop structure in retail
42Balance Sheet
Assets Liabilities Positive overall
Scheduled amortization of
in Euro millions intangible PPA assets as well in Euro millions result: + € 49.1
625.5 as amortization of IFRS 16
625.5 m. and dividend
rights of use: - € 13.4 m. - € 14.5 m.:
567.1 567.1 + € 31.4 m.
Deferred tax assets as a result
472.2 of the positive course of 472.2
business: + € 4.7 m. IFRS 16 long-
406.1 406.1
301,0 term leasing
381.0 371,9 381.0 269,6 = 48.1% liabilities:
= 47.5% Equity ratio - € 3.7 m.
378,5 254,2
Non-current 286,7 Equity Equity ratio
assets 188,6 221,5 203,4 225,0 93,8
Short-term tax
liabilities:
95,4 + € 16.5 m.
Non-current 35,4
29,1 29,4 Trade accounts
253,5 liabilities payable (retail
Current 192,4 202,1 230,7 partners):
184,5 185,5 188,6 Current 148,4 151,7 182,6 + € 8.2 m.
assets
liabilities
Other current
Liquid funds reflect the mail liabilities (sales
2016 2017 2018 2019 2020 order business, which resulted in 2016 2017 2018 2019 2020 tax, personnel
liabilities):
a faster conversion into cash of
the turnover, and less income tax
Rounding differences may occur. + € 5.2 m.
payments: + € 69.9 m.
Trade accounts receivable due
» Positive business development to payment methods that convert
faster into cash:
- € 6.0 m.
(despite Corona) increases equity Inventories due to inventory
build-up in on-site finishing, at
ratio to 48.1% the same time inventory
reduction in retail: + € 2.1 m.
43From Balance Sheet to Management Balance Sheet
Balance Sheet Management Balance Sheet
Equity Equity
Non-current
Non-current assets assets
Non-current Gross financial
liabilities liabilities
Non-operating
Working Capital
liabilities
Current
Current assets
liabilities Balance sheet total: 406 million euros
Balance Sheet total: 625 million euros » The balance sheet total is reduced to capital
Short-term operative debts/
elements "to be paid for" (by way of dividends or
non-interest-bearing liabilities: interest) in the management balance sheet
219 million euros
44Management-Balance Sheet
Capital Employed Scheduled amortization Capital Invested
of intangible PPA assets
in Euro millions as well as amortization of
IFRS 16 rights of use:
in Euro millions
- € 13.4 m.
405.6 Deferred tax assets as a 405.6
result of the positive
Positive overall
course of business: 376.6 result: + € 49.1
376.6 + € 4.7 m.
m. and dividend
- € 14.5 m.:
292.3 + € 31.4 m.
292.3 Operating net W/C
256.0
232.8
256.0 371.9 Trade accounts 301.0
232,8 receivable due to
269.6
payment methods that
378.5 turn into cash more Equity IFRS 16 lease
Non-current quickly: - € 6.0 m. 254.2 liability - € 3.9 m.
286.7 225.0
assets 188.6 221.5 Trade payables to trading 203.4
partners: + € 8.2 m.
Gross financial 60.4
65.1 Pension
Other net W/C liabilities 1.6 3.8
Cash 102.8 0.2 provisions:
48.6 38.8 28.1 29.1 29.4 34.3 41.9 44.2 + € 4.5 m.
33.0 Short-term tax liabilities
Non-operating
-22.5 -34.9 due to business
Net -4.3 -4.3 -69.1 development: + € 16.5 m. liabilities Payment of non-
current liabilities
Working from leasing:
Capital 2016 2017 2018 2019 2020 Other current liabilities
(sales tax, personnel
2016 2017 2018 2019 2020 - € 3.7 m.
liabilities): + € 5.2 m. Rounding differences may occur.
» Capital employed increases due to the cash position
» Operating net working capital reduced for various reasons
45Free cash flow
Cash Flow from Outflow of funds from
Increase by € 39.6 Free-Cash Flow
operating business investment aktivities
m. through: in euro millions
in euro millions in euro millions
Earnings higher by
€ 16.1 m. (total
EBITDA and non- 142.3 2016 2017 2018 2019 2020 103.3
cash effects). About ~ € 25 m. more cash
flow due to payments for
Cash flows from 2020 that will become
operating net W / C effective only in 2021, e.g.:
102.7
+ =
higher by € 11.6 m. tax payments as well as
(e.g. faster
93.0 mailorder customer
payments to be passed on
monetization of 78.7
sales through 72.4 to retail partners
expansion of 46,4
internet-mailorder
business). 35,5
Cash flows from
other net W/C -39.0
(mainly VAT) -46.6
increased by 2,2
€ 2.8 m.
2,5
-70.2 -67.2
Income tax -76.2 2016 2017 2018 2019 2020
payments lower by
2016 2017 2018 2019 2020
€ 9.1 m.
Acquisition of Cheerz and Acquisition of WhiteWall Rounding differences may occur.
Laserline - € 38.3 m. - € 32.8 m..
» Above all, customer payments (mail order business) and postponed tax payments have led to higher
cash flows, which will lead to higher cash-outs to retail partners and tax authorities in Q1 2021
» Acquisition-free year reduces cash flow from investing activities
46
» The free cash flow increases by a total of EUR 67.7 millionROCE
Avarage capital
12-months-EBIT employes in the past 4 ROCE *
in euro millions quarters in %
in euro millions
79.7
Average capital 21.4
12-month EBIT
employed excluding 20.3 20.6
excluding IFRS 16:
IFRS 16:
€ 56.0 million 17.9
=
€320.8 million
56.8 384.8 385.9
53.7 14.8
47.0 49.2 300.9
242.6
220.1
2016 2017 2018 2019 2020 2016 2017 2018 2019 2020 2016 2017 2018 2019 2020
» Positive development of earnings increases ROCE to 20.6 % (despite IFRS 16 Leasing Accounting since 2019)
* ROCE = EBIT / Capital Employed. Rounding differences may occur.
475. Innovation
Digitization with responsibility

 49
Digitization with responsibility

 50
Super resolution
AI-based resolution enhancement for printing
Challenge through messenger pictures
» Low resolution & compression artifacts
Approach
» Resolution increase through artificial intelligence (GAN)
Products season 2020
» Wall art, advent calendars: every fourth picture improved
» Wall calendar A2: two of three images improved
51Photo selection and distribution
Holding together photos that “belong together”
Event detection Photo selection Photo distribution Page layout
526. Outlook 2021
e2021: 710 to 770
 Revenue e2021: CEWE should continue to grow                                                                                                                                                                                                    Euro millions

     Revenue (CONCEPTUAL)

             Photofinishing                                                                                   Transformation phase
             Commercial Online-Print                                                                          Analogue / Digital
             Hardware Retail
              199 1

                              199 3

                                                                      199 8

                                                                                      200 0

                                                                                                              200 3

                                                                                                                              200 5

                                                                                                                                                                      201 0

                                                                                                                                                                                      201 2

                                                                                                                                                                                                                              201 7

                                                                                                                                                                                                                                               201 9
     199 0

                      199 2

                                      199 4

                                              199 5

                                                      199 6

                                                              199 7

                                                                              199 9

                                                                                              200 1

                                                                                                      200 2

                                                                                                                      200 4

                                                                                                                                      200 6

                                                                                                                                              200 7

                                                                                                                                                      200 8

                                                                                                                                                              200 9

                                                                                                                                                                              201 1

                                                                                                                                                                                              201 3

                                                                                                                                                                                                      201 4

                                                                                                                                                                                                              201 5

                                                                                                                                                                                                                      201 6

                                                                                                                                                                                                                                      201 8

                                                                                                                                                                                                                                                       202 0

                                                                                                                                                                                                                                                               e20 21
54
EBIT development: e2021
in Euro millions
EBIT e2021:
84 72 to 84 Euro millions
79.7
72
56.8
55.7
49.2
47.0
36.4
32.6
27.2 29.4 28.3 28.9
17.9
11.2
2008 2009 2010 2011 2012 2013 2014 2015 2016 2017 2018 2019 2020 e2021
55CEWE Group Targets 2021
Targets PY 2020 Target 2021 Change in %
Photos 1 billion photos 2.34 ~2.3 to ~2.4 -2 to +3
CEWE PHOTO BOOK millions 6.52 ~6.4 to ~6.7 -2 to +3
Operational Investments 2 Euro millions 35.6 ~48
Revenue Euro millions 727.3 710 to 770 -2 to +6
EBIT Euro millions 79.7 72 to 84 -10 to +5
EBT 3 Euro millions 76.4 70 to 82 -8 to +7
Earnings after tax 4 Euro millions 51.9 48 to 56 -8 to +7
Earnings per share Euro 7.20 6.60 to 7.73 -8 to +7
1 The number of photos is the sum of the images with which CEWE photo products were designed and refers to all images that are used in value-added products Rounding differences might occur.
(e.g. CEWE PHOTOBOOK, CEWE CARDS, CEWE CALENDAR, CEWE WALL PICTURES and other photo gifts)
2 Outflows from investments in property, plant and equipment and intangible assets, netted against inflows from the sale of property, plant and equipment and intangible assets; without acquisitions/company acquisitions
3 Without subsequent valuations of equity instruments
4 Based on the normalized group tax rate of the previous year
» The ranges of these 2021 targets reflect the uncertainty that is currently arising
from the pandemic and potential effects on CEWE's business development
567. Q&A-Session CEWE Annual Press & Analysts‘ Conference 2021
This presentation contains forward-looking statements that are based on current assumptions and
     forecasts of the management of CEWE. Known and unknown risks, uncertainties and other factors
     could lead to material differences between the forward-looking statements given here and the actual
     development, in particular the results, financial situation and performance of our Company. The
     Company assumes no liability to update these forward-looking statements or to conform them to future
     events or developments.

     All numbers are calculated as exactly as possible and rounded for the presentation. Due to this,
     rounding differences might occur.

58
You can also read