2019 Interim Results Announcement - 13 August 2019 - Nexteer
←
→
Page content transcription
If your browser does not render page correctly, please read the page content below
2019
                      Interim Results
                      Announcement
                                                        13 August 2019

             Copyright 2019, Nexteer Automotive Corporation.   All rights reserved.
1   CONFIDENTIAL
Safe Harbor Statement
    These materials have been prepared by Nexteer Automotive Group Limited (“Nexteer” or the “Company”) and are being furnished to you solely for informational purposes. The
    information contained in these materials has not been independently verified. NO REPRESENTATION OR WARRANTY EXPRESS OR IMPLIED IS MADE AS TO, AND NO RELIANCE
    SHOULD BE PLACED ON, THE FAIRNESS, ACCURACY, COMPLETENESS OR CORRECTNESS OF THE INFORMATION OR OPINIONS CONTAINED HEREIN. It is not the intention
    to provide, and you may not rely on these materials as providing, a complete or comprehensive analysis of the Company’s financial or trading position or prospects.

    Neither Nexteer nor any of its affiliates, advisors or representatives shall have any liability whatsoever (in negligence or otherwise) for any loss that may arise from any use of this
    presentation or its contents or otherwise arising in connection with this presentation.

    Certain statements contained in these materials constitute forward-looking statements. Such forward-looking statements involve known and unknown risks, uncertainties and other
    factors, many of which are beyond our control, which may cause the actual results, performance or achievements of the Company to be materially different from those expressed by, or
    implied by the forward-looking statements in these materials. The Company undertakes no obligation to update or revise any forward-looking statement, whether as a result of new
    information, future events or otherwise. Many factors may cause the actual development to be materially different from the expectations expressed here. Such factors include, for
    example and without limitation, changes in general economic and business conditions, fluctuations in currency exchange rates or interest rates, the introduction of competing products,
    the lack of acceptance for new products or services and changes in business strategy.

    In this document, all references to “Booked Business Amount” are to our estimation of the value of all booked business under contracts that have been awarded to us. The Booked
    Business Amount is based on estimated lifetime volume of the programs derived from indicative production arrangements provided by the applicable OEM customers and information
    provided by third-party industry sources. In calculating the Booked Business Amount, we also assume that the relevant contracts will be performed in accordance with their terms. Any
    modification or suspension of the contracts related to the booked business by our customers could have a material and adverse effect on the value of the booked business. The value of
    booked business is not a measure defined by International Financial Reporting Standards (“IFRS”), and our methodology for determining the Booked Business Amount may not be
    comparable to the methodology used by comparable companies in determining the value of their booked business. While we believe that our current Booked Business Amount is a
    relevant financial metric, the information in relation to the booked business and the Booked Business Amount included in this document does not constitute a projection, forecast or
    prediction of our profits, and the actual contract value may be different from the estimated Booked Business Amount due to various factors and uncertainties beyond our control. We
    cannot assure you that our estimated Booked Business Amount contained in this document will be indicative of our future operating results.

    This document does not constitute an offer, solicitation, invitation, or recommendation to purchase or subscribe for any securities and no part of it shall form the basis of or be relied upon
    in connection with any contract, commitment or investment decision in relation thereto.

2
2019 1H Business Update

                              Michael Richardson
                              Executive Board Director
                              President

3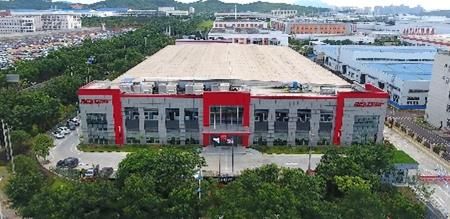
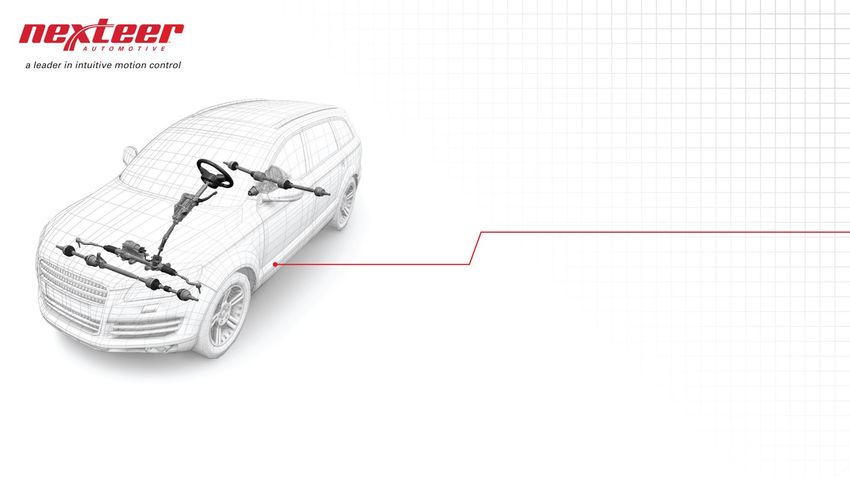
Strategy for Profitable Growth

       Expand      Strengthen    Capitalize on   Optimize Cost   Pursue Select   Target China
     & Diversify   Technology   EPS as Enabler     Structure     Acquisitions    & Emerging
    Revenue Base   Leadership     for ADAS                        & Alliances      Markets

                     A Well-Defined Plan to Drive Stakeholder Value

4
Enterprise Priorities
    2019 1H Execution Highlights

    ▪ Successful launch of 21 programs across multiple
       product lines, regions & customers

    ▪ Increased Order-to-Delivery Backlog to US$25.6billion

    ▪ Continued Globalization with Regional Autonomy

    ▪ Improved Operational Efficiency

    ▪ Committed Investment on ADAS / NEV Technologies

5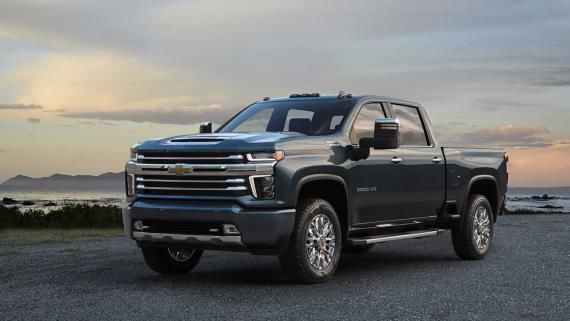
Launch of 21 Customer Programs

                                                                       2                          10
                                              9
                            ▪ GM GMC Sierra HD,              ▪ PSA DS 3 Crossback SPEPS   ▪ Mahindra XUV300 Driveline
                                 Chevrolet Silverado HD      ▪ PSA Peugeot 208 SPEPS      ▪ Tata Harrier Driveline; Pump
                                 HPS Gear; Pump; Driveline                                ▪ Nissan DAYZ Driveline
                            ▪ Ford Lincoln Aviator                                        ▪ Mitsubishi eK Wagon Driveline
                                 Column; Driveline                                        ▪ BYD F3 BEPS
                            ▪ Ford Explorer                                               ▪ MG Hector BEPS
                                 Column; Driveline                                        ▪ GM Cadillac XT6 REPS; Driveline
                            ▪ GM Cadillac XT6                                             ▪ Chang’An** CS35 Plus Driveline
                                 REPS; Driveline

    ** Attributed to a non-consolidated joint venture
6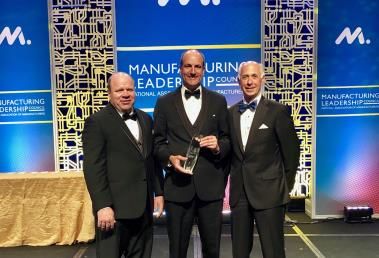
New Launch Vehicles

              PSA                            Chevrolet        GMC       Cadillac
         DS3 Crossback                     Silverado HD     Sierra HD    XT6

                                  Tata
                                 Harrier

          Mahindra                           BYD              Lincoln   Peugeot
          XUV300                              F3              Aviator     208

                             Nissan
                             DAYZ

          Mitsubishi                         MG             Chang’An     Ford
          eK Wagon                          Hector          CS35 Plus   Explorer

                       Q1 2019                            Q2 2019

7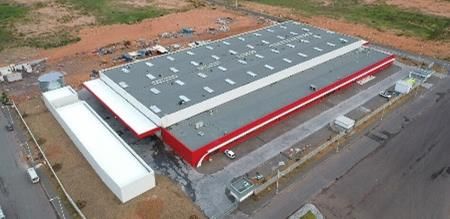
Enterprise Priorities
    2019 1H Execution Highlights

    ▪ Successful launch of 21 programs across multiple
       product lines, regions & customers

    ▪ Increased Order-to-Delivery Backlog to US$25.6 billion

    ▪ Continued Globalization with Regional Autonomy

    ▪ Improved Operational Efficiency

    ▪ Committed Investment on ADAS / NEV Technologies

8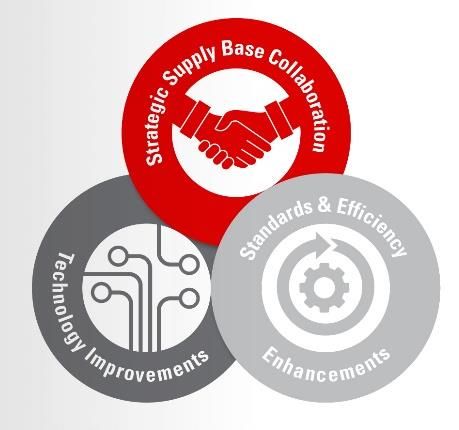
Backlog Composition

                                             Order to Delivery Backlog* as of June 30, 2019

                                                                                        16%
                                                                     25.6                                                      26%
        25.2           -1.8           +2.3            -0.2
                                                                                  10%
                                                                                  3%
                                                                                        $25.6B                                        $25.6B     53%
                                                                                                                  EPS
                                                                                                      71%         CIS         21%                            N. America
                                                                                                                  HPS                                        Asia Pac.
                                                                                                                  DL                                         EMEA-SA

                                                                                                      $25.6B
                                                                                  35%

      Dec 31,       1H 2019       Gross New          Adj.           Jun 30,                                                              New Booking Composition
       2018         Revenue        Booking         (Vol./FX)         2019                18%
                                                                                                                                           New /
                                                                                                12%   11%                     10%         Conquest     55%
                                                                                                            8%
                                                                                                                   4%    2%
                                                                                                                                         Incumbent     45%
    * Booked business information is compiled through our internal records, and
                                                                                  GM     Ford   FCA   BMW   PSA   RNM   SGMW Others
      such information has not been audited nor reviewed by our auditors.

9
Backlog Trend

        25.6       26.2                                                       24.9       25.0       25.2       25.3       25.6
                              24.0       23.7        23.9          24.0

       Dec. 31,   Mar. 31,   Jun. 30,   Sep. 30,    Dec. 31,      Mar. 31,   Jun. 30,   Sep. 30,   Dec. 31,   Mar. 31,   Jun. 30,
        2016       2017       2017       2017        2017          2018       2018       2018       2018       2019       2019

                                                   EPS      CIS      HPS     DL

10
Enterprise Priorities
2019 1H Execution Highlights
▪ Successful launch of 21 programs across multiple
product lines, regions & customers
▪ Increased Order-to-Delivery Backlog to US$25.6 billion
▪ Continued Globalization with Regional Autonomy
▪ Improved Operational Efficiency
▪ Committed Investment on ADAS / NEV Technologies
11Strategic Global Footprint Expansion
Wuhan, China
EPS Manufacturing JV
with Dongfeng
In Construction
Liu Zhou, China
Self-owned New Facility
Kenitra, Morocco In Production
EPS & Driveline
Manufacturing
In Construction Bangalore, India Suzhou, China
Software Center APAC Regional
In Production Technical Center
In Construction
Chennai, India
EPS & Driveline
Manufacturing
In Production
12Morocco Plant Grand Opening
Booked Revenue
Kenitra, Morocco In million USD
EPS & Driveline 250
Manufacturing
200+
200
150
100
Ground Breaking Grand Opening
50
March 2018 June 2019
0
2019 2020 2021 2022 2023
13Liu Zhou New Plant Start of Production
Liu Zhou, China
EPS 东风雷诺
Manufacturing
▪ Wholly-owned Facility Replacing the
Previously Rented Plant
▪ Implemented “Smart Manufacturing” to
Include Digital Trace™ Manufacturing
Measure
Ground Breaking Grand Opening
December 2017 June 2019 ▪ Expanded Engineering Capabilities to
Include NVH Laboratory, Test Track,
Vehicle Testing Lab and Product
Performance Analysis Center
14Globalization with Regional Autonomy
Core Engineering Competency
Globalisation - Global Aggregate*
70%
67%
63%
58%
53%
50%
2014 2015 2016 2017 2018 2019
* includes Applications Engineering and Continuous Improvement activities
Regional Autonomy and Competency approaching 70%
15Enterprise Priorities
2019 1H Execution Highlights
▪ Successful launch of 21 programs across multiple
product lines, regions & customers
▪ Increased Order-to-Delivery Backlog to US$25.6 billion
▪ Continued Globalization with Regional Autonomy
▪ Improved Operational Efficiency
▪ Committed Investment on ADAS / NEV Technologies
16Saginaw Driveline Transformation
Launch Where We’re Headed
2H 2018 2020 & Beyond
▪ Global consistency leading to better quality and
customer value
▪ Reduced lead time across the supply chain and
utilizing more supplier technology
▪ Improved efficiency in plant operations
▪ Improved capacity utilization
▪ Technology improvement facilitating quality and
cost improvements
17Saginaw Driveline Transformation
Manufacturing Process Staffing
10%
30%
45%
Where We’re Headed 60%
2020 & Beyond 90%
70%
55%
40%
2018 2019 2020 2021 2018 2019 2020 2021
Mfg Source ▪ +3,900 part numbers impacted
Floor Space Utilization (sq. ft.) ▪ +500 part numbers to be sourced
▪ +50 sequences of equipment and
material relocations
▪ +1,100 pieces of equipment moved /
relocated
▪ Consolidation of 2 facilities to 1 -
~50% reduction in floor space
2018 2019 2020 2021 utilization
18Saginaw Driveline Transformation
A Proof-Point
Existing BOP New BOP
Where We’re Headed
2020 & Beyond
Improvement
Manning 70%
Std. Hours 36%
Floor Space 63%
Scrap/FTQ 83%
19Ford’s “Silver Level SGMW’s “Excellent PSA’s “Platinum
Manufacturing Award” Responding & Int’l Pioneer Supplier Status Certificate
Awards” of Excellence”
Industry for EPS Production at
Nexteer Suzhou for Nexteer Asia Pacific for Nexteer EMEA & SA
Recognition
NAM’s “Manufacturing Moto Idea’s “Decade ASQ’s “Int’l Team
Leadership Award” Award” Excellence Award
for Enterprise Integration & for Nexteer Poland’s Finalist”
Technology Leadership Impact on Automotive for Nexteer Suzhou
Sector
20Enterprise Priorities
2019 1H Execution Highlights
▪ Successful launch of 21 programs across multiple
product lines, regions & customers
▪ Increased Order-to-Delivery Backlog to US$25.6 billion
▪ Continued Globalization with Regional Autonomy
▪ Improved Operational Efficiency
▪ Committed Investment on ADAS / NEV Technologies
21EPS Product Readiness on NEV Truck
Lead EPS Supplier on North America Full Size Truck and SUV
EV’s
o GM, Ford and FCA all planning Nexteer REPS
o Nexteer holds 90% of the ICE and EV Truck market
Well-positioned with developed technologies applicable to Truck
EV’s
o Up to 24 kN REPS loads (battery packs → heavier vehicles)
o 12 Volt systems (standard)
o 48 Volt capabilities (if-needed)
o Modular Power Pack (MPP) electronics applicable for both
ICE and EV’s including ADAS L3-5
Low volume applications, most are incremental to today’s ICE
business
o Different customer base who will buy EV Trucks
22Full Size Truck (FST) REPS Powerpacks
~700 FIT ~400 FIT ~100 FIT ~10 FIT ~1 FIT
ADAS Level 4-5
Fail Operational
ADAS Level 3
Fail Safe
ADAS Level 2
ADAS Level 1
Nexteer Launch LEGACY 3Q2018 3Q2022 2Q2020 3Q2021
Power Inverter SINGLE DUAL DUAL DUAL DUAL
Micro SINGLE SINGLE DUAL DUAL DUAL
Input Power SINGLE SINGLE SINGLE DUAL DUAL
Chambers SINGLE SINGLE SINGLE SINGLE MULTIPLE
2323Automated Shuttle / Delivery Vehicles
▪ Market Description
– Autonomous vehicles used for first/last mile people
transportation, and goods delivery
– Speeds typically limited to 25 mph
– Restricted and highly controlled routes
– Intensified interest and investment
▪ Market Challenges
– Inexperienced system integrators, limited competency
in designing and validating systems, and building
vehicles.
– Immature Federal, State, and Local Regulations
– Technology and Infrastructure gaps
– Cost of development
▪ Opportunities
– Learning environment for development of future
ADAS/AV technology
– Nexteer competency in system design, test, and
integration
– Fit with CNXMotion technology of integrated steering
and braking control algorithms.
24Enterprise Priorities
2019 1H Execution Highlights
▪ Successful launch of 21 programs across multiple
product lines, regions & customers
▪ Increased Order-to-Delivery Backlog to US$25.6billion
▪ Continued Globalization with Regional Autonomy
▪ Improved Operational Efficiency
▪ Committed Investment on ADAS / NEV Technologies
251H 2019 Financial Highlights
Bill Quigley
Senior Vice President
Chief Financial Officer
261H 2019 Financial Highlights
Financial Performance Impacted Largely by Environmental Factors
1. Currency headwind from USD strength against both RMB & Euro
2. Lower OEM production across all regions compared with 2018
3. Decline in China OEM production most impactful
4. GM NA K2 to T1 platform transition driving NA Columns revenue
comparison
Revenue Headwind Driving Earnings and Cash Flow Performance
27Key Financial Metrics ($ in millions)
Revenue EBITDA Net Profit* Free Cash Flow
(% of revenue) (% of revenue)
-10% -16% -34% -75%
$2,047 $331 $183
$200
$1,832
$277
$131
16.2% 15.1% 9.8% 7.2%
$45
1H 2018 1H 2019 1H 2018 1H 2019 1H 2018 1H 2019 1H 2018 1H 2019
* Net Profit Attributable to Equity Holders
28Revenue Comparison ($ in millions)
Global Revenue Y-O-Y Revenue Drivers
(structural %)
$2,047 $2,047
$1,832
14%
14% ($40)
20% ($82) $1,832
17%
($84)
($9)
66% 69%
($215)
1H 2018 1H 2019 1H 2018 FX China NA All Other 1H 2019
Market CIS
N. America Asia Pac.
EMEASA
FX, China Market and NA Columns Key Drivers
29Revenue by Region ($ in millions)
Global Revenue Regional Distribution
(structural %) (growth %)
N. America Asia Pac. EMEASA
$2,047
$1,832
14% $286
$1,343 $418
14% $1,275 $252
20% 17% ($68) ($20) ($20)
$305 ($14)
($93)
66% 69%
1H 2018 1H 2019 1H 2018 V/P/O* 1H 2019 1H 2018 FX V/P/O* 1H 2019 1H 2018 FX V/P/O* 1H 2019
N. America Asia Pac. * Volume / Price / Other
EMEASA
30Revenue by Product Line ($ in millions)
Global Revenue Product Line Distribution
(structural %) (growth %)
EPS Columns Driveline HPS
$2,047
-8% -20% -11% -16%
4% $1,832
15% 15%
4%
15% $1,321 $337 $304
$1,222 $85
17% $270
14% $269 $71
64% 67%
1H 2018 1H 2019 1H 2018 1H 2019 1H 2018 1H 2019 1H 2018 1H 2019 1H 2018 1H 2019
EPS Columns Driveline HPS China NA K2/T1 China As Expected
Market Transition Market
31EBITDA by Region ($ in millions)
N. America Asia Pac. EMEASA
(% of revenue) (% of revenue) (% of revenue)
16.3%
21.0% 13.3%
14.8%
$220 10.1%
$88 $34
$189
19.5% $29
$60
1H 2018 1H 2019 1H 2018 1H 2019 1H 2018 1H 2019
32Sequential Performance
N. America Asia Pac. EMEASA
(% of revenue) (% of revenue) (% of revenue)
Revenue
$1,282
$1,275
$363 $252
$305 $220
($8) ($58) $32
2H 2018 1H 2019 2H 2018 1H 2019 2H 2018 1H 2019
EBITDA
$34
$183 $189 $80 $29
$60
$6 ($20) $5
14.3% 14.8% 22.0% 19.5% 13.1% 13.3%
2H 2018 1H 2019 2H 2018 1H 2019 2H 2018 1H 2019
33EBITDA to Net Profit Walk ($ in millions)
1H 2019 1H 2018 Change Commentary
▪ D&A reflecting program
EBITDA $ 277 $ 331 $ (54)
launches – engineering and
D&A 117 91 (26) capital investment
Net Finance Costs 2 6 4
▪ Lower Net Finance Costs and
Share of JV Earnings 2 2 - Income Tax Expense
Income Tax Expense 23 29 6
– Debt amortization / strong
Minority Interest 1 3 2
cash balances
Net Profit $ 131 $ 200 $ (64)
– Jurisdictional profitability
Effective Tax Rate 14.7% 12.6%
34Investment for Future Growth ($ in millions)
Engineering / Prod. Development* Cap-Ex*
(% of revenue) (% of revenue)
7.8%
6.2% 4.6%
3.4%
$144 $84
$127
$67
2018 2019 1H 2018 1H 2019
• Engineering and product development costs charged to income
statement and development costs capitalized as intangible asset.
Cap-Ex presented based on assets acquired in the period
35Free Cash Flow and Balance Sheet ($ in millions)
Dec 2018
Dec 2018 1H 2019
1H 2019
Cash and Capital
1H 2018 1H 2019 Gross Debt $ 377 $ 338
Finance Leases $ 5 67
Less: Cash 675 585
Net Debt / (Cash) $ (293) $ (180)
$140
Total Equity $ 1,710 $ 1,765
$195 Total Net Capital $ 1,417 $ 1,585
$240 Net Debt / Net Capital n.a. n.a.
$323
Liquidity
$183 $183 Cash $ 675 $ 585
Credit Facilities 376 376
$45 Total $ 1,051 $ 961
Cash from Investing Free Cash Cash Investing Free Cash Leverage / Coverage
Ops Activities Flow from Ops Activities Flow
Gross Debt to EBITDA 0.6x 0.6x
Net Debt to EBITDA n.a. n.a.
362019 Rest of Year Considerations
1. FX likely to remain a headwind
2. Seasonality in OEM production; maintain a cautionary view on
China OEM production forecasts
3. Focused cost initiatives in place to mitigate soft OEM
production environment
4. Substantial number of customer program launches - majority
in APAC
5. Laser focused on customer conquest opportunities
37Strategy for Profitable Growth
Expand Strengthen Capitalize on Optimize Cost Pursue Select Target China
& Diversify Technology EPS as Enabler Structure Acquisitions & Emerging
Revenue Base Leadership for ADAS & Alliances Market
A Well-Defined Plan to Drive Stakeholder Value
38You can also read