Rabobank Market Strategy - Sweetener colloquium - February 2019 - IDFA
←
→
Page content transcription
If your browser does not render page correctly, please read the page content below

Rabobank Market Strategy

Sweetener colloquium – February 2019
       Christian Lawrence +1-212-808-6923
       christian.lawrence@rabobank.com
       Market Strategy
       Rabobank International – New York
       MARKETING COMMUNICATION
                                            1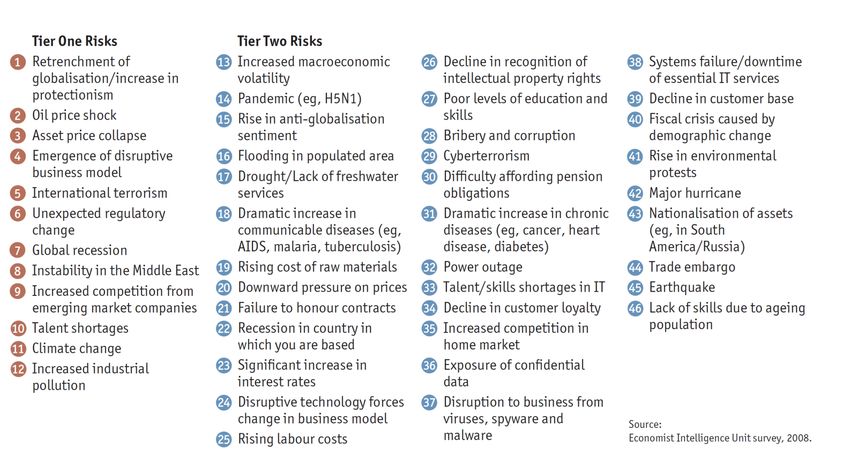
Structural issues

                    1
Debt has been the main driver of growth since the ‘80s
But has the debt = growth limit been reached?
                                    Government debt to
                                         world GDP
                                   Business debt to world
                                                               ...and much of the recent rise
                                             GDP               has been for share buybacks,
                                     Household debt to                not investment!

                                         world GDP
                                   Financial debt to world
                                             GDP

   2007 = 338%                     Despite the debt crisis,               2018> 370%
 (1 square = 1% of global GDP)                                        (1 square = 1% of global GDP)
                                 debt has continued to rise.

                                                                                                      3
US = government + corporate, EM = corporate + other
     Record US corporate debt       China gets 1 dollar of growth
     Record US government debt          for 8 dollars of debt

                                                                    4
The emerging world is now a bigger slice of the global
        GDP pie than the developed world
                              100

                                                                              Emerging Markets
                               90
% World GDP, PPP equivalent

                               80
                               70
                               60
                               50
                               40

                                                                              Anglos Europe
                               30
                               20
                               10
                                0
                                 1850          1900         1950      2000
                                   Australia    Canada    UK       US
                                   France       Germany   Italy    Other Europe
                                   Japan        CIS       LatAm    EM Asia
                                   ME           Africa                                           5
As EM leverages up so does the US government
Debt to GDP about to pass WWII

                         USD 1.5bn a
                            DAY in
                           interest
                         payments!

                                               6
Why didn’t cheap money fuel growth? = ‘Financialisation’
 (The only slide I have kept in my deck for the past 4yrs!)
                                                                                  •     Low wage growth in
                                                     Lack of                            G10 economies
             Structural issues               investment/reform
             (too much debt)                  limits productivity                 •     High levels of private
                stymieing a                   growth which sees                         debt
                recovery in                     structural issues
             growth/inflation                     unaddressed                     •     Growing income and
                                                                                        wealth inequality.

                                                                                  •     Lack of real world
                                                                                        investment.
   More stimulus                     A
    Central banks                 “Money-          Limited incentives to invest   = Falling productivity
mandated to respond                                 Why try and achieve TFP?
to low inflation with            go-round”           Just buy financial assets
                                                     instead: share buybacks      = Lack of wage growth
   more stimulus

                                                                                      =Disgruntled voters
                           Stimulus leads to
                              even lower
                            corporate/govt
                                                                                      = Rise of
                           borrowing costs
                                                                                      populism               7
All this debt hasn’t fuelled much real world growth
BUT, it has led to asset price inflation
    QE...“Higher stock prices will boost consumer wealth and help increase
             confidence, which can also spur spending“ - Bernanke

                                                                             8
Asset inflation + low wage growth = rising inequality
   Rising inequality = political populism
                                                                                                       Median Net Worth, 15yr change
 The top 10% of US households now own                                                                         1998           2013      Change
            84% of all stocks                                                             All Families    $ 102,500.00 $     81,200.00  -21%
   – Edward Wolff (Economist at NYU)                                                      Bottom 20%      $ 8,300.00 $        6,100.00  -27%
                                                                                    800   20%- 40%        $ 47,400.00 $      22,400.00  -53%
                                                                                          40-60%          $ 76,300.00 $      61,700.00  -19%
        44% of the US can’t find                                                    700   Top 10%         $ 646,600.00 $ 1,130,700.00   75%
         $400 in an emergency
             - Fed survey                                                           600

                                                                                    500

                                                                                    400
                                                   QE 1
                                                   begins                           300

                                                                                    200

                                                                                    100
 1983 = 100
                                                                                    0
                                                               2010
1983
       1986
              1989
                     1992
                            1995
                                   1998
                                          2001
                                                 2004
                                                        2007

                                                                      2013
                                                                             2016

                     US household median income
                     US houshold net worth                                                                                               9
Did low wages help pull down unemployment?
If so, will higher wages drive unemployment?

                                               10
Did low wages help pull down unemployment?
If so, will higher wages drive unemployment?
11Workers receive a smaller and smaller piece of the pie
12
%
10
8
6
4
US corporate profit as a share of GDP
2
'57 '62 '67 '72 '77 '82 '87 '91 '96 '01 '06 '11 '16
12When inequality rises, voters want to shake up the system..
Brexit, Trump, Italy, AMLO, Macron, Bolsonaro
European elections on May 23rd could highlight a seismic shift in the European outlook
13Late cycle behaviour
1The US is close to the longest recovery on record but
growth is now slowing (and not just in the US)
130
Months of US economic expansion
110
90
70
50
30
10
-10
1868-69
1885-87
1894-95
1904-07
1915-18
1924-26
1938-45
1954-57
1970-75
1857
2009 - 19
1982-90
15Tighter monetary policy and trade wars are weighing
Surveys are turning for the worse
16The classic US recession indicator...inversion is the signal
then the curve bull steepens into the recession
17Value equities outpacing growth equities although
Powell u-turn reversed this
2002
18Defensive equities outpacing cyclicals...
Until the Powell put came back into play!
19Consumer confidence: present vs. expectations at
stretched levels (as we see before every recession)
20Growth is primarily supported by consumption…
But how much is consumption being supported by credit?
21Home sales and autos are suffering...badly
New seriously delinquent auto loans just hit ‘08 highs
22Tighter US financial conditions & shrinking balance sheet
23Has the PBOC help US equities this year?
RR cuts, sneak QE, balance sheets expand again
24Fed’s DOT plot projects 2 rate hikes in 2019 but Powell
has turned dovish and we expect 0 (and cuts in 2020)
Chairman Powell January 6th 2019: “We’re listening
Rabobank expects no further hikes in
carefully with – sensitivity to the message that the
2019 and we expect the Fed to pause markets are sending and we’ll be taking those downside
its balance sheet unwind in H2 of this risks into account as we make policy going forward” ...
year before cutting rates in 2020. The Fed is able to “adjust policy quickly and flexibly”
25If the US sneezes, the rest of the world catches a cold
26If recession spreads, how can other countries respond?!
Are they really going to raise rates if the Fed is cutting?
27Trade
1Number 1 risk according to survey of 600 executives
Source: Economist Intelligence Unit (EIU)
29
Financial Markets ResearchThis is not just about trade, this is about world power...
#MCGA #MAGA
Don’t
tread on
us!
30China plays by a different set of rules – unfair competition
and innovation stealing? This is now a Cold War
19th Party Congress shows
China rejecting US-centric world order
President Xi
now leader for
life?
• China’s Great Firewall – VPNs banned in 2018?
“The new world order cannot be just • Cyber-Security Law requires all data on Chinese
dominated by capitalism and the West, and citizens to be kept only within China
the time will come for a change.” • WeChat app being officially recorded at all times
• China aiming for Social Credit System by 2020
• Monitor and rank actions of every citizen & legal
“By 2050 China is set to regain its might person to generate “official trustworthiness” score
and re-ascend to the top of the world.” • Belief that big data and AI can make central-
planning beat free markets
31
Financial Markets ResearchDebt, debt and more debt (Oh, and liquidity injections too)
China manipulates the exchange rate
and tries to stop capital flight.
In Q4 exports to Hong Kong surged
hinting at the ‘15/’16 dynamic of over
invoicing to get money out of the
mainland. There was a huge surge in
precious stone imports into China too.
32
Financial Markets ResearchWhat about the rest of the world?
On balance, the (looming) effect
on other countries depends on the
type of country…
The geopolitical plates are moving
• Advanced economies who are
important trading partners for
China could be negatively
affected (Australia, NZ)
• Countries who have a cheap
labor advantage could benefit
(Vietnam, Indonesia, Mexico)
• Some LatAm countries may see
export destinations shift
(Brazil, Argentina)
33Despite all of this…volatility still remains relatively low as
vol events prove short lived while policy is easy
In addition, the market is structurally short vol due to the proliferation of
passive investing, ETFs and traders trying to pick up premium by selling vol
34Summary
The US is still the cleanest shirt in the dirty laundry basket but will fall
US isrecession
into still the cleanest
next yearshirt in thewill
– others dirty laundry basket expect USD to
follow
outperform
Lack of wageand expect
growth ratesa to
means move
lack lower driven inflation and the
of demand
continued rise of populism
Fed will not be able to raise rates further, it will halt the balance
sheet unwind in H2 and start cutting rates in 2020
Debt continues to rise globally and this remains a key concern
China is key and USD/CNY is set to explode higher
Trade Wars are likely to get worse before they get better
This is not just about trade, this is a cold war with China
Less differentiation between EM and more “running to 1”
in terms of correlations
Market volatility likely to remain sporadic but if the Fed doesn’t halt
the balance sheet unwind it will pick up more structurally in H2
35Important notice
Non Independent Research
This document is issued by Coöperatieve Rabobank U.A. incorporated in the Netherlands, trading as Rabobank London (“RL”). The liability of its members is limited. RL is authorised
by De Nederlandsche Bank, Netherlands and the Prudential Regulation Authority (PRA) and subject to limited regulation by the Financial Conduct Authority (FCA) and PRA. Details
about the extent of our authorisation and regulation by the PRA, and regulation by the FCA are available from us on request. Registered in England and Wales No. BR002630. This
document is directed exclusively to Eligible Counterparties and Professional Clients. It is not directed at Retail Clients.
This document does not purport to be impartial research and has not been prepared in accordance with legal requirements designed to promote the independence of Investment
Research and is not subject to any prohibition on dealing ahead of the dissemination of Investment Research. This document does NOT purport to be an impartial assessment of the
value or prospects of its subject matter and it must not be relied upon by any recipient as an impartial assessment of the value or prospects of its subject matter. No reliance may be
placed by a recipient on any representations or statements made outside this document (oral or written) by any person which state or imply (or may be reasonably viewed as stating or
implying) any such impartiality.
This document is for information purposes only and is not, and should not be construed as, an offer or a commitment by RL or any of its affiliates to enter into a transaction. This
document does not constitute investment advice and nor is any information provided intended to offer sufficient information such that is should be relied upon for the purposes of
making a decision in relation to whether to acquire any financial products. The information and opinions contained in this document have been compiled or arrived at from sources
believed to be reliable, but no representation or warranty, express or implied, is made as to their accuracy, completeness or correctness.
The information contained in this document is not to be relied upon by the recipient as authoritative or taken in substitution for the exercise of judgement by any recipient. Any
opinions, forecasts or estimates herein constitute a judgement of RL as at the date of this document, and there can be no assurance that future results or events will be consistent with
any such opinions, forecasts or estimates. All opinions expressed in this document are subject to change without notice.
To the extent permitted by law, neither RL, nor other legal entities in the group to which it belongs accept any liability whatsoever for any direct or consequential loss howsoever arising
from any use of this document or its contents or otherwise arising in connection therewith.
Insofar as permitted by applicable laws and regulations, RL or other legal entities in the group to which it belongs, their directors, officers and/or employees may have had or have a
long or short position or act as a market maker and may have traded or acted as principal in the securities described within this document (or related investments) or may otherwise
have conflicting interests. This may include hedging transactions carried out by RL or other legal entities in the group, and such hedging transactions may affect the value and/or
liquidity of the securities described in this document. Further it may have or have had a relationship with or may provide or have provided corporate finance or other services to
companies whose securities (or related investments) are described in this document. Further, internal and external publications may have been issued prior to this publication where
strategies may conflict according to market conditions at the time of each publication.
This document is not intended for distribution in the United States or to or for the account of US persons and the distribution of this document in other jurisdictions may be restricted
by law and recipients of this document should inform themselves about, and observe any such restrictions. This document may not be reproduced, distributed or published, in whole or
in part, for any purpose, except with the prior written consent of RL. By accepting this document you agree to be bound by the foregoing restrictions.
Please email fm.global.unsubscribe@rabobank.com to be removed from this mailing list
36
© Rabobank London, Thames Court, One Queenhithe, London EC4V 3RL +44(0) 207 809 3000You can also read