Q1 '20 Earnings Call Presentation - February 6, 2020
←
→
Page content transcription
If your browser does not render page correctly, please read the page content below

Q1 ’20 Earnings Call Presentation
February 6, 2020

Hillenbrand Participants

• Joe Raver
   ̶   President & Chief Executive Officer

• Kristina Cerniglia
   ̶   Senior Vice President & Chief Financial Officer

• Rich Dudley
   ̶   Senior Director, Investor Relations

        | Q1 ’20 Earnings Call Presentation
Disclosure Regarding Forward-Looking Statements

Throughout this presentation, we make a number of “forward-looking statements” within the meaning of the Private Securities Litigation Reform Act of 1995. As the words imply, these are statements
about future plans, objectives, beliefs, and expectations that might or might not happen in the future, as contrasted with historical information. Forward-looking statements are based on assumptions
that we believe are reasonable, but by their very nature they are subject to a wide range of risks. If our assumptions prove inaccurate or unknown risks and uncertainties materialize, actual results
could vary materially from Hillenbrand’s (the “Company”) expectations and projections.

Words that could indicate that we are making forward-looking statements include the following:

  intend                         believe                       plan                          expect                         may                           goal                          would
  become                         pursue                        estimate                      will                           forecast                      continue                      could
  target                         encourage                     promise                       improve                        progress                      potential                     should

This is not an exhaustive list but is intended to give you an idea of how we try to identify forward-looking statements. The absence of any of these words, however, does not mean that the statement is
not forward-looking.

Here is the key point: Forward-looking statements are not guarantees of future performance, and our actual results could differ materially from those set forth in any forward-looking statements. Any
number of factors, many of which are beyond our control, could cause our performance to differ significantly from what is described in the forward-looking statements. These factors include, but are not
limited to: the outcome of any legal proceedings that may be instituted against the Company, or any companies we may acquire; risks that the integration of Milacron or any other integration,
acquisition, or disposition activity disrupts current operations or poses potential difficulties in employee retention or otherwise affects financial or operating results; the ability to recognize the benefits of
the acquisition of Milacron or any other acquisition or disposition, including potential synergies and cost savings or the failure of the Company or any acquired company to achieve its plans and
objectives generally; global market and economic conditions, including those related to the credit markets; volatility of our investment portfolio; adverse foreign currency fluctuations; involvement in
claims, lawsuits and governmental proceedings related to operations; our reliance upon employees, agents, and business partners to comply with laws in many countries and jurisdictions; labor
disruptions; the impact of the additional indebtedness that the Company has incurred in connection with the acquisition of Milacron and the ability of the Company to comply with financial or other
covenants in its debt agreements or meet its de-leveraging goals; the dependence of our business units on relationships with several large providers; increased costs or unavailability of raw materials
or certain outsourced services; continued fluctuations in mortality rates and increased cremations; competition in the industries in which we operate, including from nontraditional sources in the death
care industry; cyclical demand for industrial capital goods; impacts of decreases in demand or changes in technological advances, laws, or regulation on the revenues that we derive from the plastics
industry; certain tax-related matters; and changes to legislation, regulation, treaties or government policy, including any resulting from the current political environment. For a more in-depth discussion
of these and other factors that could cause actual results to differ from those contained in forward-looking statements, see the discussions under the heading “Risk Factors” in Part I, Item 1A of
Hillenbrand’s Form 10-K for the year ended September 30, 2019, filed with the Securities and Exchange Commission (“SEC”) on November 13, 2019, and in Part II, Item 1A of Hillenbrand’s Form 10-
Q for the quarter ended December 31, 2019, filed with the Securities and Exchange Commission on February 5, 2020. We assume no obligation to update or revise any forward-looking information.

               | Q1 ’20 Earnings Call Presentation                                                                                                                                                                     3
Acquisition of Milacron Provides Compelling Strategic and Financial Benefits

                                                      Enhances Growth Opportunities with Leading Brands
                                                      and New Technologies

                                                      Adds Complementary Businesses; Increases Scale
                                                      and Diversification
    A pivotal step in
    Hillenbrand's vision
    to become a world-                                Creates and Drives Efficiencies with Significant Cost
                                                      Synergies
    class global
    diversified industrial
    company                                           Delivers Strong Financial Benefits Including Significant
                                                      Recurring Revenue, EPS and Margin Accretion

                              A Transformative Deal to Create Meaningful Shareholder Value

      | Q1 ’20 Earnings Call Presentation                                                                        4
Macro Trends Support Long-Term Sustained Growth for Durable Plastics

                                                                                Secular Trends
 •    Demand for products driven by strong secular trends,                                     •    Medical applications focus on safety, improved drug and
      including a growing middle class                                                              therapy delivery, as well as durability

 •    Automotive increased use of light-weight plastics to                                     •    Construction ongoing shift to plastics that are more durable,
      improve fuel efficiency                                                                       lightweight and require little maintenance

 •    Packaging in emerging markets to improve food shelf life,                                •    Increased desire for eco-friendly innovations in the use of
      freshness, and safety                                                                         plastics and base materials

                                                                  Diverse, Long-Term Drivers

     Electronics          Consumer Goods                  Automotive                 Packaging                Eco-friendly               Medical              Construction
    Superior quality,       Shortened product         Vehicle light-weighting    Increased freshness,      Bio Resin and recycled   Conversion to plastic    Shift to plastics for
    shorter product      lifecycles, innovation in                                 extended shelf life,          materials             for safety and       durability, light weight
lifecycles, and design         multi-material                                     and product visibility                                disposability       and low maintenance
       flexibility           products, design
                                 flexibility

                | Q1 ’20 Earnings Call Presentation                                                                                                                              5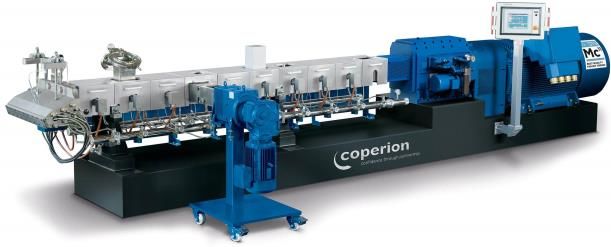
Milacron Strengthens Position Across Plastics Value Chain

            Innovation in Biodegradable                                Full System Provider for World’s Largest,
                 Plastics and Recycling                                Most Complex Polyolefin Systems

                                             PLASTICS
       New Capabilities in Molding and        Value Chain              Core Product Engineering Capabilities to
    Extrusion to Produce End Products                                  Innovate and Solve Customers’ Challenges

          Stronger Position Across the Plastics Value Chain to Capitalize on New Opportunities

       | Q1 ’20 Earnings Call Presentation                                                                         6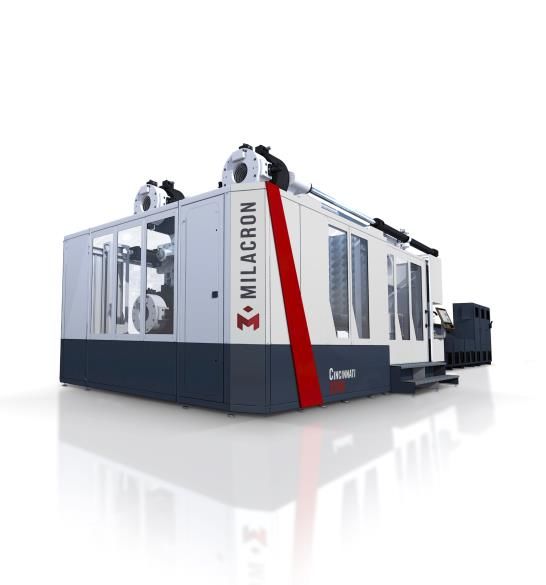
Q1 FY 2020 Highlights

• Consolidated Q1 2020 Highlights
    ̶   Revenue of $567 million increased 38% compared to prior year; Organic revenue increased 5%
    ̶   GAAP EPS of $(0.05) decreased $0.50 primarily as a result of business acquisition costs and restructuring charges; adjusted EPS1 of
        $0.63 increased 29% compared to prior year

• PEG Q1 2020 Highlights
    ̶   Revenue of $307 million increased 9% compared to prior year
    ̶   Adjusted EBITDA margin1 was 16.8%, up 40 bps compared to prior year

• Batesville Q1 2020 Highlights
    ̶   Revenue of $127 million decreased 1% compared to prior year
    ̶   Adjusted EBITDA margin1 was 18.1%, down 270 bps compared to prior year

• Milacron Q1 2020 Highlights
    ̶   Revenue of $133 million
    ̶   Adjusted EBITDA margin1 was 19.8%

          | Q1 ’20 Earnings Call Presentation   1Adjusted   EPS and adjusted EBITDA margin are non-GAAP measures. See appendix for GAAP reconciliation.   7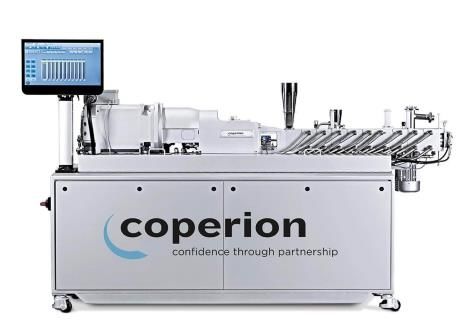
Consolidated Performance – Q1 FY 2020
                      Revenue                                     Net Income1                                            GAAP & Adjusted                                        Operating Cash Flow
                                                                                                                             EPS2
                                 $567                                                                                                           Adj. EPS
                                                                                                                                                  $0.63
                                                                                                                                                                                    $36
                                                                                                                           Adj. EPS
                  $410                                                                                                       $0.49

                                                                 $28M
                                                                                                                          GAAP EPS
                                                                                                                            $0.45
                                                                                                                                                                                             $18

                                                                                                                                               GAAP EPS
                                                                                                                                                 $(0.05)

                                                                                     ($3M)

                 Q1 2019        Q1 2020                         Q1 2019             Q1 2020                                Q1 2019              Q1 2020                           Q1 2019   Q1 2020

                                                                           Hillenbrand Consolidated
 Q1 2020 Consolidated Composition:                                                                           Q1 2020 Consolidated Summary:
                                                                                                             • Revenue of $567 million grew 38% compared to the prior year (5% organic), including 1%
                                     Revenue Adj. EBITDA2                                                      of negative foreign currency impact; the Process Equipment Group grew 9%, partially
                                                                                                               offset by a decrease in Batesville of 1%; Milacron added revenue of $133 million for the
 Process Equipment Group                  54%         51%                                                      quarter
 Batesville                               22%         23%                                                    • GAAP net loss of ($3) million; adjusted EBITDA2 of $92 million increased 43% and
 Milacron                                 24%         26%                                                      adjusted EBITDA margin2 of 16.2% expanded 60 bps primarily driven by the impact of
                                                                                                               Milacron and focused cost controls and restructuring in PEG, partially offset by inflation
 Total                                    100%       100%                                                      and unfavorable mix in Batesville
                                                                                                             • Operating cash flow decreased $18 million driven primarily by business acquisition and
                                                                                                               integration costs

                                                    1Net   Income attributable to Hillenbrand
              | Q1 ’20 Earnings Call Presentation   2Adjusted   EPS, adjusted EBITDA, and adjusted EBITDA margin are non-GAAP measures. See appendix for GAAP reconciliation.                               8
Process Equipment Group Performance – Q1 FY 2020
Revenue Adjusted EBITDA1
$307
$282
$51
$46
Q1 2019 Q1 2020 Q1 2019 Q1 2020
Process Equipment Group
Q1 2020 Summary:
• Revenue of $307 million increased 9% over the prior year; Excluding the impact of FX, revenue grew 10%; Revenue growth
was primarily driven by continued demand for large extrusion and material handling systems for the production of plastics,
which was partially offset by lower demand in other industrial end markets, including proppants
• Adjusted EBITDA margin1 of 16.8% increased 40 basis points primarily due to lower operating expenses as a result of
focused efforts to reduce discretionary spending, partially offset by the increased proportion of lower margin, large systems
projects and the decline in demand for higher margin separating equipment
| Q1 ’20 Earnings Call Presentation
1Adjusted EBITDA and adjusted EBITDA margin are non-GAAP measures. See appendix for GAAP reconciliation. 9Batesville Performance – Q1 FY 2020
Revenue Adjusted EBITDA1
$128 $127
$27
$23
Q1 2019 Q1 2020 Q1 2019 Q1 2020
Batesville
Q1 2020 Summary:
• Revenue of $127 million decreased 1% compared to the prior year; Batesville’s unit volume increased despite an estimated
decrease in North American burials driven by an increased rate at which families opted for cremation
• Adjusted EBITDA margin1 of 18.1% was 270 basis points lower than the prior year due to inflation, including higher
healthcare costs, and unfavorable product mix, partially offset by productivity
| Q1 ’20 Earnings Call Presentation
1Adjusted EBITDA and adjusted EBITDA margin are non-GAAP measures. See appendix for GAAP reconciliation. 10Milacron Performance – Q1 FY 2020
Revenue Adjusted EBITDA1
$133
$26
Q1 2020 Q1 2020
Milacron
Q1 2020 Summary:
• Milacron’s contribution for the quarter, consisting of 41 days, included revenue of $133 million and Adjusted EBITDA1 of $26
million, which does not include its legacy corporate costs
• Directionally, Milacron’s results for the first quarter were below the prior year due to headwinds in their key end markets as a
result of the global economic slowdown, including weak automotive market and general softness in China, which is affecting
capital investment
| Q1 ’20 Earnings Call Presentation
1Adjusted EBITDA is a non-GAAP measure. See appendix for GAAP reconciliation. 11Hillenbrand Outlook: FY 2020 Updated Guidance
Revenue Other Guidance Assumptions
Original Range Updated Range Original Updated
Batesville -3% -1% -3% -1% FX ~minimal impact ~1%
Process Equipment Group 2% 4% 2% 4% Depreciation ~$27M ~$56M
Organic HI 1% 3% 1% 3% Amortization ~$30M ~$64M
Milacron ($M) 850 880 Interest Expense ~$21M ~$75M
Total HI ($M) 2,667 2,733 Adjusted ETR ~27% ~27-28%
Average Diluted Share Count 73.4
Adjusted EBITDA Margins Free Cash Flow > GAAP Net Income > GAAP Net Income
CapEx ~2% of revenue ~3% of revenue
Original Range Updated Range
Deal & Integration Costs ~$80-85M
Batesville ~20% ~21% ~20% ~21% Corporate SG&A ~2.3% of revenue
Process Equipment Group 18.0% 18.2% 18.0% 18.2%
Milacron 17.8% 18.3%
EPS
Original Range Updated Range
Adjusted EPS 2.45 2.60 2.30 2.55
Adjusted Cash EPS1 3.48 3.75
1Adjusted Cash EPS excludes Depreciation & Amortization
| Q1 ’20 Earnings Call Presentation 12Significant Cost Synergies Identified; Additional Operational Efficiency and
Revenue Opportunities Expected
Additional Opportunities
$50M Operational Efficiencies
• HOM implementation globally
• Footprint optimization
Run-Rate Cost Synergies within 3 years post-close
• Reducing public company costs
Revenue Synergies
• Realizing operating efficiencies
• Cross-sell extruder and material
• Capturing direct and indirect spend opportunities handling equipment
• Leverage combined service
footprint to further penetrate
aftermarket
Targeting ~$20-25M of Run-Rate Cost Synergies within the First 12 Months Post-close; Accelerating Realization Within FY 2020
| Q1 ’20 Earnings Call Presentation 13Q&A
14Replay Information
• Dial-in for US and Canada: 1 (800) 585-8367
• Dial-in for International: +1 (416) 621-4642
• Conference ID: 5373374
• Encore Replay Dates: 2/7/2020 – 2/20/2020
• Log on to: http://ir.hillenbrand.com
| Q1 ’20 Earnings Call PresentationAppendix
16Disclosure Regarding Non-GAAP Measures
While we report financial results in accordance with United States generally accepted accounting principles (GAAP), we also provide certain non-GAAP operating performance measures. These
non-GAAP measures are referred to as “adjusted” measures and exclude expenses associated with business acquisition, development, and integration, restructuring and restructuring related
charges, inventory step-up, and backlog amortization, and debt financing activities related to the acquisition of Milacron (including net interest expense on our $375.0 senior unsecured notes for the
period prior to completing the acquisition). The related income tax for all of these items is also excluded. These non-GAAP measures also exclude the non-recurring tax benefits and expenses
related to the interaction of certain provisions of the U.S. government enacted tax legislation referred to as the Tax Cuts and Jobs Act of 2017 and certain tax items related to the acquisition of
Milacron, including the revaluation of deferred tax balances in connection with enacted statutory tax rate reductions in certain foreign jurisdictions. Such items could have a substantial impact on
GAAP measures of Hillenbrand’s financial performance. Non-GAAP information is provided as a supplement to, not as a substitute for, or as superior to, measures of financial performance
prepared in accordance with GAAP. Such items could have a substantial impact on GAAP measures of Hillenbrand’s financial performance. Hillenbrand also does not attempt to provide
reconciliations of forward-looking non-GAAP earnings guidance to the comparable GAAP measure, as permitted by Item 10(e)(1)(i)(B) of Regulation S-K, because the impact and timing of these
potential charges or gains is inherently uncertain and difficult to predict and is unavailable without unreasonable efforts. In addition, the company believes such reconciliations would imply a degree
of precision and certainty that could be confusing to investors.
One important non-GAAP measure that we use is adjusted earnings before interest, income tax, depreciation, and amortization (“adjusted EBITDA”). A part of our strategy is to selectively acquire
companies that we believe can benefit from our core competencies to spur faster and more profitable growth. Given that strategy, it is a natural consequence to incur related expenses, such as
amortization from acquired intangible assets and additional interest expense from debt-funded acquisitions. Accordingly, we use adjusted EBITDA, among other measures, to monitor our business
performance.
Another important non-GAAP measure that we use is backlog. Backlog is not a term recognized under GAAP; however, it is a common measurement used in industries with extended lead times
for order fulfillment (long-term contracts), like those in which our Process Equipment Group and Milacron businesses compete. Order backlog represents the amount of consolidated revenue that
we expect to realize on contracts awarded related to the Process Equipment Group and Milacron businesses. Backlog includes expected revenue from large systems and equipment, as well as
replacement parts, components, and service. Given that there is no GAAP financial measure comparable to backlog, a quantitative reconciliation is not provided.
We use this non-GAAP information internally to make operating decisions and believe it is helpful to investors because it allows more meaningful period-to-period comparisons of our ongoing
operating results. The information can also be used to perform trend analysis and to better identify operating trends that may otherwise be masked or distorted by these types of items. The
Company believes this information provides a higher degree of transparency.
| Q1 ’20 Earnings Call Presentation 17Reconciliation of Adjusted EBITDA to Consolidated Net Income
Three Months Ended
December 31,
2019 2018
Adjusted EBITDA:
Process Equipment Group $ 51.5 $ 46.2
Milacron 26.3 -
Batesville 23.0 26.7
Corporate (8.9) (8.8)
Less:
Interest income (1.3) (0.2)
Interest expense 14.7 5.5
Income tax (benefit) expense (12.4) 14.5
Depreciation and amortization 25.9 14.1
Business acquisition, development, and integration costs 53.8 0.6
Restructuring and restructuring related charges 2.4 0.5
Inventory step-up 9.6 0.1
Consolidated net (loss) income $ (0.8) $ 29.0
| Q1 ’20 Earnings Call Presentation 18Reconciliation of Non-GAAP Measures
Three Months Ended December 31,
2019 2018
($ in millions)
Net (loss) income attributable to Hillenbrand $ (3.1) $ 28.3
Business acquisition, development, and integration costs 53.8 0.6
Restructuring and restructuring related charges 2.4 0.5
Inventory step up 9.6 0.1
Backlog amortization 4.2 0.3
Debt financing activities 1.6 -
Tax effect of adjustments (18.2) (0.4)
Tax adjustments (7.4) 1.8
Adjusted net income attributable to Hillenbrand $ 42.9 $ 31.2
Three Months Ended December 31,
2019 2018
Diluted EPS $ (0.05) $ 0.45
Business acquisition, development, and integration costs 0.79 0.01
Restructuring and restructuring related charges 0.04 0.01
Inventory step up 0.14 -
Backlog amortization 0.06 -
Debt financing activities 0.03 -
Tax effect of adjustments (0.11) (0.01)
Tax adjustments (0.27) 0.03
Adjusted Diluted EPS $ 0.63 $ 0.49
| Q1 ’20 Earnings Call Presentation 19You can also read