Outlook for the Hotel Industry - The impact of current events on hotel performance and values

Page created by Luis Terry
 
CONTINUE READING
Outlook for the Hotel Industry - The impact of current events on hotel performance and values
Outlook for the
Hotel Industry
The impact of current events on
hotel performance and values
April 2020
Outlook for the Hotel Industry - The impact of current events on hotel performance and values
An
Unprecedented
  Downturn
Outlook for the Hotel Industry - The impact of current events on hotel performance and values
Hotel Occupancy                            2020       2019

60.0%
                                                             -7.2%
                                                                 -24.4%                 -67.4%
                                                                                                 -68.5%
                                                                      -56.4%

                                                                                                          The data for the U.S.
10.0%
          1/11 1/18 1/25       2/1   2/8   2/15 2/22 2/29           3/7     3/14 3/21 3/28         4/4

Hotel ADR
$170
                                            2020          2019
                                                                                                          show substantial
                                                                                                          declines and
                                                                                                          appears to be
$120
                                                                 -4.6%                  -39.4%
                                                                         -10.7%                  -41.5%
                                                                            -30.2%
    $70
          1/11 1/18 1/25       2/1   2/8   2/15 2/22 2/29           3/7      3/14 3/21 3/28         4/4   bottoming out.
Hotel RevPAR                               2020       2019
$110

                                                           -11.6%
                                                                                                                Data Source: STR
    $60
                                                                    -32.5%             -80.3%
                                                                                                -81.6%
                                                                           -69.5%
    $10
3         1/11   1/18   1/25   2/1   2/8   2/15    2/22    2/29     3/7      3/14    3/21   3/28    4/4
Outlook for the Hotel Industry - The impact of current events on hotel performance and values
4
Outlook for the Hotel Industry - The impact of current events on hotel performance and values
If your hotel is closed please let STR know!

Find more FAQs on STR’s Covid-19 page
 5
Outlook for the Hotel Industry - The impact of current events on hotel performance and values
6
Outlook for the Hotel Industry - The impact of current events on hotel performance and values
7
Outlook for the Hotel Industry - The impact of current events on hotel performance and values
U.S. Lodging Market Trends Through Prior Cycles

                                  Supply % Change                      Demand % Change                        Occupancy
    8.0%                                                                                                                  65.9% 66.1% 66.1%
                                                                                                                    65.4%                 68%

    6.0%    63.5%                                              62.8%                                                                                          66%

                                     61.3% 63.1%                                                      62.2%                                                   64%
    4.0%                                                                                                                         65.4%
                          58.9%                                                         59.9%                     64.4%                                       62%
    2.0%
                                                63.0%                                                                                                         60%

    0.0%
                                                                                                   61.3%                                                      58%

    -2.0%     60.0%           59.2%                               59.8%
                                                                                                                                                              56%
                                                                                     57.5%
    -4.0%                                                                                                                                                     54%

    -6.0%                                                                 54.6%                                                                               52%

    -8.0%                                                                                                                                                     50%
            2000
                   2001
                           2002
                                  2003
                                         2004

                                                        2006
                                                                2007
                                                                       2008
                                                                              2009
                                                                                     2010
                                                                                            2011
                                                                                                    2012
                                                                                                           2013
                                                                                                                   2014
                                                                                                                          2015

                                                                                                                                         2017
                                                                                                                                                2018
                                                                                                                                                       2019
                                                 2005

                                                                                                                                  2016
8                                                        Source: STR
Outlook for the Hotel Industry - The impact of current events on hotel performance and values
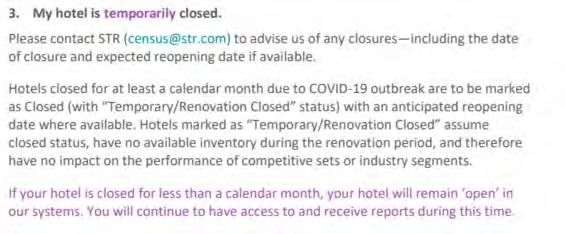
U.S. Lodging Market Trends through Prior Cycles                                                   FR
                       Occupancy         % Change ADR                % Change RevPAR
                                                             8.1%
    10.0%                          8.5% 7.6%                        6.6%   8.1%                        70.0%
             5.4%       7.4%                          5.2%
                                               6.1%                               6.1%
                                                                                         2.9%          60.0%
     5.0%                                                                                       0.9%
                     0.6%                                           5.5%                               50.0%
     0.0%                                                                     3.1%
                                                                                         2.9%
                                                                                                       40.0%
     -5.0%                            -2.0%
                      -4.0%                                                                            30.0%
             -5.9%
    -10.0%
                                                                                                       20.0%
    -15.0%                                                                                             10.0%
                                                      -16.5%
    -20.0%                                                                                             0.0%

9                                              Source: STR
Outlook for the Hotel Industry - The impact of current events on hotel performance and values
Outlook for the U.S. Lodging Industry
 The following forecasts for the U.S. lodging industry reflect the current outlook of market participants,
 assuming recovery from COVID-19 begins in the second half of 2020.

                         Historical                                        Forecast
                     2018         2019         2020         2021           2022           2023          2024
 Occupancy             66.1%       66.1%         43.1%        59.7%          62.9%          64.5%         65.0%
 Percent Change                     0.0%        -34.7%        38.5%           5.3%           2.5%          0.8%
 Average Rate       $129.97      $131.17       $111.61      $117.45        $123.42        $128.36       $132.21
 Percent Change                     0.9%        -14.9%         5.2%           5.1%           4.0%          3.0%
 RevPAR              $85.96       $86.76        $48.15       $70.17         $77.68         $82.79        $85.94
 Percent Change                     0.9%        -44.5%        45.7%          10.7%           6.6%          3.8%

This represents the current expectation for the timing and pattern of recovery, with occupancy expected to
recover first, followed by ADR. All forecasts are in current dollars.

10                                             Source: STR, HVS
Current Forecasts in a Historical Context
                                                                                The years to recovery reflect the time
                          Years to Recovery                                     from the trough year to the peak (i.e., a
         2001 Recession         2009 Recession         Current Forecast         return to prior levels).
                                                                                HVS’s occupancy forecast anticipates a
         4.5                                                                    rebound in demand once travel
               4                  4                    4                        restrictions are lifted, the COVID-19 virus
                          3.5                    3.5
                                                                                is contained, and consumers resume
                                                                                business and leisure travel.
     3
                                                                                HVS anticipates that ADR will take longer
                                                                            >   to recover than in prior cycles given the
                                                                        2       magnitude of the rate declines. This
                    1.5                    1.5              1.5   1.5           reflects our expectation that rate will be a
                                                                                key marketing tool used to stimulate
                                                                                demand recovery. The availability of the
                                                                                shadow supply (Airbnb, Sonder, etc.),
                                                                                which was not a factor in prior cycles, will
                                                                                also influence ADR recovery.
     Occupancy     Average Rate              RevPAR           Demand
11                                    Source: HVS
Outlook for Supply Growth
 As of January 2020, supply was forecast to increase by roughly 2.0% in 2020 and 2021. Given
 the recent events, supply growth is now expected to be lower, and at a slower pace, than
 previously anticipated.

          Under-         Market conditions          Financing        Changes in market    Some properties
       construction       will likely lead to     challenges will      conditions may     may close and not
     projects may face   delayed openings;      delay construction    render proposed       reopen or be
        delays with        some projects           start dates.             projects       converted to an
      materials/FF&E,    may be placed on                              infeasible; as a       alternate,
      which will push             hold.                                  result, some        resulting in
       back planned                                                    projects may be     negative supply
      opening dates.                                                    postponed or           growth.
                                                                           canceled.

12
Hotel
Operating
Leverage
Full-Service Hotel Operating Leverage Analysis                                              FR
     Full-Service Hotels                2007           2009             2014       2018
     Occupancy                        70.0%          62.5%             73.9%      74.4%
     Average Rate                      $167           $147              $181       $202
     RevPAR                            $117             $92             $134       $151
     % Change                                         -21%               46%        13%
     Revenue PAR                   $67,301         $52,650            74,975     85,412
     % Change                                         -22%               42%        14%
     Expenses PAR                  $50,298         $43,143           $55,911     64,292
     % Change                                         -14%               30%        15%
     EBITDA PAR                    $17,003          $9,507            19,064     21,120
     % Change                                         -44%              101%        11%
     EBITDA Ratio                     25.3%          18.1%             25.4%      24.7%
     Multiple of EBITDA Change
     to Revenue Change:                                      2.0 X       2.4 X      0.8 X
14                           Source: STR Host Almanac, HVS
Limited-Service Hotel Operating Leverage Analysis                                          FR
      Limited-Service Hotels               2007          2009         2014        2018
      Occupancy                           69.2%         63.3%        74.2%       75.5%
      Average Rate                          $95            $85        $102        $128
      RevPAR                                $66            $54         $76         $97
      % Change                                           -18%          41%        27%
      Revenue PAR                      $24,349       $20,128        28,516      36,835
      % Change                                           -17%          42%        29%
      Expenses PAR                     $14,606       $13,583       $17,710      23,677
      % Change                                             -7%         30%        34%
      EBITDA PAR                        $9,743        $6,545        10,806      13,158
      % Change                                           -33%          65%        22%
      EBITDA PAR                          40.0%         32.5%        37.9%       35.7%
      Multiple of EBITDA Change
      to RevPAR Change:                                    1.9 X        1.6 X      0.7 X
15                             Source: STR Host Almanac, HVS
When a Hotel Suspends Operations
     While the market has been talking about hotels “closing,” in most cases, hotels are really just
     temporarily suspending operations until demand warrants resuming operations.
     In evaluating the option to suspend operations, hoteliers should consider:
      How consistent (or inconsistent) are                   What are your franchisor’s and manager’s
       occupancy levels? They may be too volatile              policies/procedures/requirements
       to reduce even variable expenses low                    concerning suspending operations?
       enough to sustain efficient/profitable                 Consider applicable terms of any loans; what
       operations.                                             is your lender’s perspective?
      Which is the better option to minimize                 Consider SBA loans and other federal
       losses?                                           >     programs for which the business may qualify
         •   Suspended Operations: fixed costs and
             some operational costs, such as utilities

                                                                                   >
             and skeleton staff, will remain,
             regardless of operational status, vs.           ✓ Establish a strategy for maintaining a market
                                                               presence and pursuing future business
         •   Continued Operations: revenue less
             operating costs less fixed costs                ✓ Develop a plan for resuming operations

16
Hotel Values
     &
Transactions
U.S. Average Price Per Key in the Past Investment Cycle                                                                                                                          FR
                                                                                                                                              Full-Service Hotels
                     Hotel                    Full Service                      Limited Service                                                Full-service hotel asset pricing is more
250,000                                                                                                                                          volatile than that of limited-service
230,000
                                                                                                                                                 hotels during the course of an economic
                                                                                                                                                 cycle.
210,000
                                                                                                                                               Prices began to decline late in the cycle
190,000
                                                                                                                                                 following their peak in late 2006.
170,000
                                                                                                                                               The average price decline of
150,000                                                                                                                                   >      approximately 50% reflects substantial
130,000                                                                                                                                          impact to EBITDA during the downturn,
110,000                                                                                                                                          as well as the profile of assets
 90,000                                                                                                                                          transacted.
 70,000                                                                                                                                        Fewer large, high-priced hotels owned
 50,000                                                                                                                                          by well-capitalized owners sell toward
                                                                                                                                                 the end of the cycle as prices come
          Dec-06

                   Dec-07

                            Dec-08

                                     Dec-09

                                               Dec-10

                                                        Dec-11

                                                                  Dec-12

                                                                           Dec-13

                                                                                    Dec-14

                                                                                             Dec-15

                                                                                                      Dec-16

                                                                                                               Dec-17

                                                                                                                        Dec-18

                                                                                                                                 Dec-19
                                                                                                                                                 under pressure.
                                                                                                                                               Once hotel performance bottoms out,
                                                                 Source: RCA                                                                     investors jump in to reap high returns on
                                                                                                                                                 the recovery.
  18
U.S. Average Price Per Key in the Past Investment Cycle                                                                                                                              FR

                   Hotel                      Full Service                          Limited Service                                             Limited-Service Hotels
250,000                                                                                                                                          Limited-service hotel values are
230,000                                                                                                                                           less volatile due to their lower
210,000                                                                                                                                           operating leverage, which lessens
190,000                                                                                                                                           EBITDA fluctuations during an
170,000                                                                                                                                           economic cycle.
150,000                                                                                                                                     >    Transactions are less impacted by
130,000
                                                                                                                                                  the capital markets due to the
110,000
                                                                                                                                                  smaller size and lower value of
 90,000
                                                                                                                                                  these assets, as well as the
 70,000
                                                                                                                                                  entrepreneurial profile of the
 50,000                                                                                                                                           typical buyer/owner operator.
          Dec-06

                   Dec-07

                            Dec-08

                                     Dec-09

                                                Dec-10

                                                         Dec-11

                                                                  Dec-12

                                                                           Dec-13

                                                                                      Dec-14

                                                                                               Dec-15

                                                                                                        Dec-16

                                                                                                                 Dec-17

                                                                                                                          Dec-18

                                                                                                                                   Dec-19
                                                  Source: RCA
 19
A Look at U.S. Historic Price Per Key* and Cap Rate* Trends
                                                    U.S. Price Per Key                                        Cap Rate                                                Timeline of the Investment Cycle
100,000                                                                                                                                                    9.4%       Market Peak – Prices peaked in Q3 2007 and
 95,000                                                                                                                                                               began to slide prior to the market shock in Q3
                                                                                                                                                           9.2%       2008.
 90,000
 85,000                                                                                                                                                    9.0%       Market Trough – Prices bottomed out in Q4
                                                                                                                                                                      2009, and once hotel performance bottomed out,
 80,000                                                                                                                                                    8.8%       investors jumped in. Hedonic average price per key
 75,000                                                                                                                                                               declined by 27% from peak to trough.
                                                                                                                                                           8.6%   >
 70,000
                                                                                                                                                                      Recovery – Prices reached prior peak in Q2 2015,
 65,000                                                                                                                                                    8.4%       reflecting a five-year recovery from trough (2009)
 60,000                                                                                                                                                               to peak (2015).
                                                                                                                                                           8.2%
 55,000
                                                                                                                                                                      Cap Rates – Cap rates began to rise in Q2 2006
 50,000                                                                                                                                                    8.0%       and peaked in Q1 2009 following the financial
                                                                 Dec-10
           Dec-04
                    Dec-05
                             Dec-06
                                      Dec-07
                                               Dec-08
                                                        Dec-09

                                                                          Dec-11
                                                                                   Dec-12
                                                                                            Dec-13
                                                                                                     Dec-14
                                                                                                              Dec-15
                                                                                                                       Dec-16
                                                                                                                                Dec-17
                                                                                                                                         Dec-18
                                                                                                                                                  Dec-19
                                                                                                                                                                      crisis shock. Cap rates began to rapidly decline
                                                                                                                                                                      once hotel performance bottomed out, as cap
                                                                 Source: RCA                                                                                          rates were based on depressed TTM EBITDA.
       *PPK based on the RCA Hedonic Series (RCA HS), which reflects pricing for the average property rather than an average of the
       prices of properties that have transacted. The cap rate data are also based on the RCA HS and reflect cap rates for the average
  20   property, not the average for the properties transacted.
Capitalization Rates During Previous Downturn                                                                                       FR
                                                                                               During healthy economic periods, full-
                                                                                                service hotel cap rates generally average
                 U.S. Hotel         Limited Service           Full Service                      150 basis points (bps) below those of
                                                                                                limited-service hotel cap rates.
10.5%
                                                                                               During the Great Recession, this differential
10.0%                                                                                           decreased to 50 bps.
                                                                                               Full-service cap rates increased by almost
 9.5%
                                                                                                150 bps from Q1 2008 to Q4 2009, while
 9.0%                                                                                           limited-service cap rates increased by only
                                                                                          >     75 bps, reflecting the greater impact on full-
 8.5%                                                                                           service EBITDA during the downturn.

 8.0%                                                                                          Once the recovery commenced, full-service
                                                                                                cap rates declined more rapidly and to a
 7.5%                                                                                           greater degree than limited-service cap
                                                                                                rates, reflecting buyers’ expectations of
 7.0%                                                                                           significant full-service hotel EBITDA rebound
                 Mar-08

                                   Mar-09

                                                     Mar-10

                                                                        Mar-11
        Sep-07

                          Sep-08

                                            Sep-09

                                                               Sep-10

                                                                                 Sep-11
                                                                                                because of positive operating leverage.
                                                                                               The traditional differential between full-
                                                                                                service and limited-service cap rates
                                                                                                resumed post recession.
  21                                 Source: RCA
Transaction Activity
                                      Historical Hotel Transactions                                       Transaction volume in this
                                                                                                           cycle is expected to mirror
                                      Transactions    Dollar Volume (M)                                    the 2008/09 downturn and
                           $14,000                                        700                              recovery.
                           $12,000                                        600                             Volume of transactions will
Dollar Volume (Millions)

                                                                                Number of Transactions
                                                                                                           be low in 2020, with deal
                           $10,000                                        500
                                                                                                           volume expected to
                            $8,000                                        400                              accelerate in 2021.
                            $6,000                                        300                             Pending deals may close
                            $4,000                                        200                              but are likely to be re-
                                                                                                           traded. The closing of some
                            $2,000                                        100
                                                                                                           pending sales is being
                               $0                                         0                                extended to allow the
                                                                                                           parties to evaluate the
                                     2012 Q3
                                     2007 Q1
                                     2007 Q3
                                     2008 Q1
                                     2008 Q3
                                     2009 Q1
                                     2009 Q3
                                     2010 Q1
                                     2010 Q3
                                     2011 Q1
                                     2011 Q3
                                     2012 Q1

                                     2013 Q1
                                     2013 Q3
                                     2014 Q1
                                     2014 Q3
                                     2015 Q1
                                     2015 Q3
                                     2016 Q1
                                     2016 Q3
                                     2017 Q1
                                     2017 Q3
                                     2018 Q1
                                     2018 Q3
                                     2019 Q1
                                     2019 Q3
                                                                                                           transaction as market
                                                                                                           conditions evolve.

                                                Source: RCA
          22
How Will Hotel Values Be Affected in the Current                               FR
     Downturn?
        Hotel values will be temporarily impacted by the crisis and its economic
         fall-out due to depressed EBITDA and uncertain outlook.
        Most hotel owners will not sell unless necessary.
        Financing options are constrained as lenders pull back from the hotel
         sector:
              ‒ CMBS market is currently closed to the hotel sector
              ‒ Lenders who are still active are decreasing loan-to-value ratios
                and increasing spreads
              ‒ SBA lenders have temporarily paused new originations in
                anticipation of new guidelines related to higher government
                guarantees (not to be confused with the SBA disaster loans, which
                are still are active)
        Conditions create opportunities for all-cash buyers, which will put
         downward pressure on prices as sellers seek certainty of execution.
        All-cash and low-leverage buyers will anticipate refinancing when
23
         conditions improve, enhancing the ROI potential.
How Will Individual Hotels and Markets Be Affected?                                              FR

          More Vulnerable                                              Less Vulnerable

                                    Secondary and tertiary
       Full-service hotels,                                       Hotels that primarily rely
        dependent on group          markets are expected to         on transient segments
        business                    hold up better and trade
                                    at a smaller discount to       Economy and midscale
       Gateway markets that        2019 values.                    properties
        depend on international
        travel                                                     Suburban, small metro
                                                                    town properties
       “Fly to” markets that       Gateway and the top 10         “Drive to” resorts
        depend on air travel
                                    metro markets will be
       Airport markets             more volatile; larger value    Extended-stay hotels
                                    declines are anticipated in    Drive-to markets, which
       Independent properties
                                    the near term, with greater     can be expected to recover
       Markets influenced by the   potential for accelerated       faster than those
        energy sector               appreciation thereafter.        dependent on air travel
                                                                   Properties affiliated with
                                                                    strong brands
 24
How Will Hotel Values Be Affected in the Current Downturn?                                                                                      FR
HVS has modeled three scenarios, addressing the range of potential impact of hotel values. The model considers a
base scenario and three alternate scenarios, which reflect the range of potential impact. This model is intended to
reflect the potential range and degree of impact on hotel values. The impact of current conditions on an individual
property would depend on the characteristics of the property, its market, and its location.

              Reflects the                        Anticipates                               Assumes more                         Assumes greater
              anticipated values                  moderate declines in                      significant impact in                negative EBITDA in

                                                                         Most Likely Case
              over time, based on                                                           the first year                       the first year,
  Base Case

                                                  RevPAR and EBITDA.

                                                                                                                    Worst Case
              stable market           Best Case   The degree of the                         (breakeven EBITDA).                  followed by
              conditions; this case               impact and declines                       The degree of the                    diminishing negative
              assumes that the                    is assumed to                             impact and declines                  impact as the market
              capital market                      diminish over time                        is assumed to                        recovers. This case
              conditions as of                    as the market                             diminish over time                   assumes a longer
              1/1/2020 remain in                  recovers.                                 as the market                        recovery period.
              place.                                                                        recovers.

              In all scenarios, the capital market is assumed to result in higher discount and terminal capitalization
              rates in 2020, diminishing as the market recovers.
 25
Best Case – the value decline
                                  Anticipated Pattern of
is 20% as of 2020. EBITDA         Value Decline and Recovery
recovers to base-case levels by
2024.                                                   Base          Best Case          Most Likely           Worst Case

Most Likely Case – the value                       $90,000
decline is 27% as of 2020.                         $85,000
EBITDA recovers to base-case
                                                   $80,000
levels by 2024.

                                  Value Per Room
                                                   $75,000
Worst Case – the value decline
is 35% as of 2020. EBITDA                          $70,000
recovers to base-case levels by                    $65,000
2025.
                                                   $60,000

                                                   $55,000
For context, according to the                      $50,000
RCA hedonic data, the value of                                 2019   2020        2021   2022          2023   2024    2025
an average hotel declined by
27% in the last downturn.                                                         Source: HVS
26
Current Expectations for Market Values
                      Annual Percent Change in Value
                    2020    2021     2022       2023        2024     2025

                                                                   23%
                                                                                                         Relationship to 2019 Value
                                   15%                                   15%                            Best Case   Most Likely       Worst Case
      12%                                12%
            8%                                                                 7%
                 4% 2% 4%                      6%                                   4% 5%
                                                                                                2020     81%           74%              66%
                                                    3% 4%
                                                                                            >   2021     91%           86%              81%
                                                                                                2022     98%           96%              93%
                                                                                                2023    103%          102%             100%
                                                                                                2024    105%          105%             104%
                                                                                                2025    109%          109%             109%
-20%                                                                                             Value is forecast to recover to and exceed
                            -27%                                                                             2019 value by 2023
                                                              -35%
        Best Case                    Most Likely                      Worst Case

 27                                                                  Source: HVS
Investor Strategies in the Current Environment
     In the current market, hotel acquisitions will be motivated by the opportunity to buy at depressed prices,
     as both cash flows and debt availability are well below prior norms. The expected EBITDA recovery
     following the downturn should enable buyers to achieve high returns.

     With debt less readily available, transactions may require one – or a combination – of the following
     options:

                      %
         Third-party financing at lower
         leverage and a higher interest             Seller financing                        All-cash purchase
         rate

     Buyers acquiring hotels in the current environment do so with the expectation that the hotel’s cash flow
     will improve and that the availability of debt for hotels will return to prior levels. At that point, the buyer
     would either sell or refinance the hotel.

28
Example of Valuation Assuming Refinancing Following Recovery
                                                                 Initial purchase is assumed at reduced 50% LTV, with
                                 DCF Investment Parameters        equity requiring a 16% IRR, reflecting low leverage.
                               Current             Stabilized    The unlevered discount rate derived from a value,
                              Valuation            Valuation      assuming low leverage throughout a 10-year holding
Interest Rate                    5%                    5%         period, equates to 12%.
Loan-to-Value                   50%                   65%
Equity Yield Rate               16%                   17%
                                                                 The refinancing model assumes that the hotel is
                                                                  refinanced at the end of Year 4. A normalized LTV of
Terminal Cap Rate               8.5%                  8.5%
                                                                  65% and equity IRR of 17% are assumed; the unlevered
Derived Discount Rate           12%                 10.25%
                                                                  10-year DCF discount rate equates to 10.25% based on
Refinancing Year                                End of Year 4
                                                                  these parameters as of that point in time.
                                       Conclusion Assuming       A 10-year DCF based on four years of low leverage, a
                                           Refinancing            refinancing, and six years of higher leverage results in a
      Value Conclusion                     $33,400,000            blended unlevered discount rate of 10.9%, which
      Derived Discount Rate                  10.9%                reflects an investor’s overall return expectations.
      Cap Rate - TTM EBITDA                  11.8%
      Cap Rate - 1st Yr. EBITDA               -7.3%              The cap rates derived from the concluded value reflect
      Cap Rate - Deflated Stab. EBITDA         9.7%               the challenge of using a cap rate to value hotels at this
                                                                  time.

 29                        Source: HVS
Example of Refinancing Following EBITDA Recovery

            EBITDA                                                            Total Cash
          Available for                          EBITDA After Plus Refi/Sales Flow to Equity Yield       Discounted Cash
     Year Debt Service        Debt Service       Debt Service    Proceeds       Equity   Rate             Flow to Equity

     2020    -1,397,000   -     1,091,000    =     -2,488,000                -2,488,000        0.86207     (2,145,000)
     2021     1,667,000   -     1,091,000    =        576,000                   576,000        0.74316         428,000
     2022     2,923,000   -     1,091,000    =      1,832,000                 1,832,000        0.64066      1,174,000
     2023     3,534,000   -     1,091,000    =      2,443,000     15,736,000 18,179,000        0.55229     10,040,000
     2024     3,640,000   -     2,132,000    =      1,508,000                 1,508,000        0.45611         688,000
     2025     3,749,000   -     2,132,000    =      1,617,000                 1,617,000        0.38984         630,000
     2026     3,862,000   -     2,132,000    =      1,730,000                 1,730,000        0.33320         576,000
     2027     3,978,000   -     2,132,000    =      1,846,000                 1,846,000        0.28478         526,000
     2028     4,097,000   -     2,132,000    =      1,965,000                 1,965,000        0.24340         478,000
     2029     4,220,000   -     2,132,000    =      2,088,000     23,998,000 26,086,000        0.20804      5,427,000
                                                                                         Equity Value      17,822,000
                                                                             Value of Initial Mortgage     15,547,000
                                                                                Total Property Value       33,400,000

               Unlevered Discount Rate Equating EBITDA Before Debt Service to Property Value: 10.9%
30
                                                         Source: HVS
U.S. Hotel Market Conclusion
  RevPAR levels will continue to be substantially depressed     Hotel discount rates will be elevated in the near term;
  until travel and other restrictions are lifted and            the degree of elevation will vary based on location,
  individuals are comfortable traveling again.                  market, and property specifics.

  We anticipate that occupancy will recover faster than         The opportunity to refinance or sell a hotel offsets the
  average rate, as hotels use price as a marketing tool to      current constrained capital market; as a result, discount
  stimulate demand recovery and attract guests.                 rates will not increase as significantly as current metrics
                                                                would suggest.

  The pace of supply growth is expected to slow, as
  projects under construction are delayed and as new            Over the longer term, values will recover as cash flows
  projects are postponed or abandoned.                          improve and capital markets return to more traditional
                                                                parameters.

  In the interim, hotel owners may choose to suspend
  operations to minimize EBITDA losses.                         Well-capitalized buyers should be in a position to
                                                                acquire hotels at prices well below both replacement
                                                                cost and recent norms, creating an opportunity for high
                                                                returns.
   As in prior cycles, hotel values have declined sharply and
   will remain depressed until EBITDAs “hit bottom” and
31
   there is evidence of a recovery.
This cycle is unique in terms of the rapid and dramatic decline of demand, but there are
                  similarities to other cycles that provide insight as to how this cycle will unfold.

                  Franchisors are providing some relief to hotels, lifting select brand and service standards
                  and offering concessions concerning reserves for replacement and PIP requirements.

                  Historically, lenders who take back hotels and hold onto them until values recover
                  typically made out far better than those who looked for a quick sale.

 Final Thoughts   If borrowers are staying in contact with their lenders, maintaining their properties, and
                  paying taxes and insurance, lenders may be willing to work with borrowers.

                  A hotel that suspends operations is not the same as a closed hotel and should not have
                  the stigma that has historically been associated with closed hotels.

                  Lending has been more disciplined with generally lower leverage and stricter due diligence, resulting in
                  a stronger financial position for both owners and lenders than was the case in prior cycles.

32
PLANNING
Superior Results Through Unrivaled Hospitality Intelligence.
Everywhere.
                                                                                                    Site Selection
                                                                                                    Market Study                                FR
                                                                                                 Investment Search
                                                                                             Product Recommendation
HVS has been supporting the hospitality industry in                                             Financial Projections
the U.S. and around the world for over 40 years. Our                                        Financial Feasibility Analysis
senior staff represents a collective 300+ years of                                           Economic Impact Analysis              ACQUISITION &
experience advising our industry, including through                                         Architectural Concept Design           DEVELOPMENT
multiple prior cycles and events.                                    DISPOSITION            Construction Costs Estimates
                                                                                                                              Valuation & Pricing Guidance
                                                                      Exit Strategy                                              Appraisal for Financing
Our expertise covers the full range of hospitality                Brokerage & Advisory                                          Debt & Equity Financing
assets and spans the full lifecycle of a hotel, including        Adaptive Reuse Analysis                                       Due Diligence Coordination
services that support developers, owners, operators,            Shared Ownership Analysis                                      Brand Selection & Contract
                                                                                                                                       Negotiations
lenders, and investors. With 40+ offices in markets         >
                                                                     Pricing Analysis
                                                                                                                              Operator Selection & Contract
across the U.S., we offer local insights on a real-time                                                                                Negotiations
basis.                                                                                                                          Interior Design & Project
                                                                                                                                      Management
                                                                                                                                    Executive Search
This knowledge and experience is available to                                               OWNERSHIP & OPERATION
                                                                                                                                 Pre-Opening Oversight
support you as you navigate these challenging times.                                               Asset Management
Our platform is fully functional on a remote basis, so                                      Management Agreement Analysis
even though we are not currently traveling, our staff                                                 & Negotiation
                                                                                                   Hotel Management
can access the full resources of HVS on your behalf.                                           Appraisal for Refinancing
                                                                                            Operation Performance Analysis
Let us know how we can assist you.                                                          Repositioning Study & Valuation
                                                                                                Repositioning Design &
      Suzanne R. Mellen, MAI, CRE, FRICS, ISHC                                                         Budgeting
         smellen@hvs.com | +1 415 706-4385                                                   Timeshare Conversion Review
                                                                                             Capital Improvement Financing
 33
You can also read