Map My Property User Guide - April 2015
←
→
Page content transcription
If your browser does not render page correctly, please read the page content below
Map My Property
   User Guide

      April 2015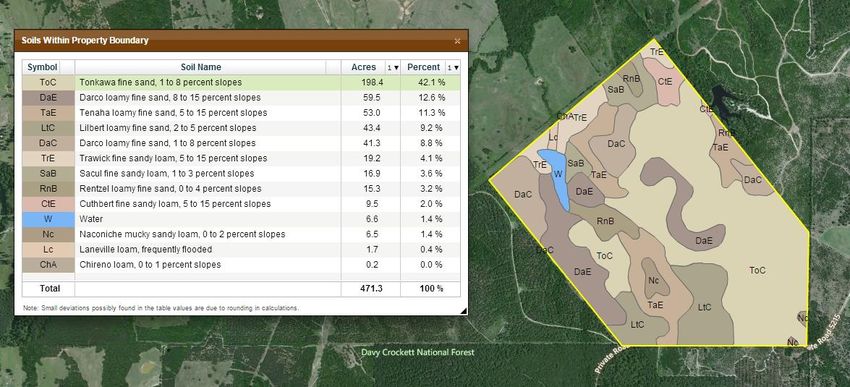
Texas A&M Forest Service
 Service

                                                           Map My Property

                                                        Table of Contents

             About Map My Property .........................................................................................                    2
             Accessing Map My Property ....................................................................................                     2
             Links .........................................................................................................................    3
             Navigating the Map .................................................................................................               3
                Navigating to a Specific Location ......................................................................                        3
                Zooming and Panning .......................................................................................                     4
                Selecting a Base Map ........................................................................................                   4
             Toolboxes ................................................................................................................         5
             Find Location of Property ........................................................................................                 5
                 Type Address ....................................................................................................              5
                 Type latitude and Longitude .............................................................................                      5
             Define Boundaries ...................................................................................................              6
                 Draw .................................................................................................................         6
                 Load ..................................................................................................................        7
                 Save ...................................................................................................................       7
             Soils and Vegetation ................................................................................................ 7
                 Soils ................................................................................................................... 7
                 Vegetation Type ................................................................................................ 9
                 Clip .................................................................................................................... 9
                 Transparency .................................................................................................... 10
             Measure ..................................................................................................................        10
                Area ...................................................................................................................       10
                Distance ............................................................................................................          11
                Circle .................................................................................................................       11
             Add Labels ............................................................................................................... 11
             Add Linear Features ................................................................................................ 12
                Line ................................................................................................................... 12
                Freehand ........................................................................................................... 12
             Add Points of Interest ............................................................................................. 12
             Print or Export to PDF ............................................................................................. 13

Map My Property                                                                                                                                     Page 1
April 2015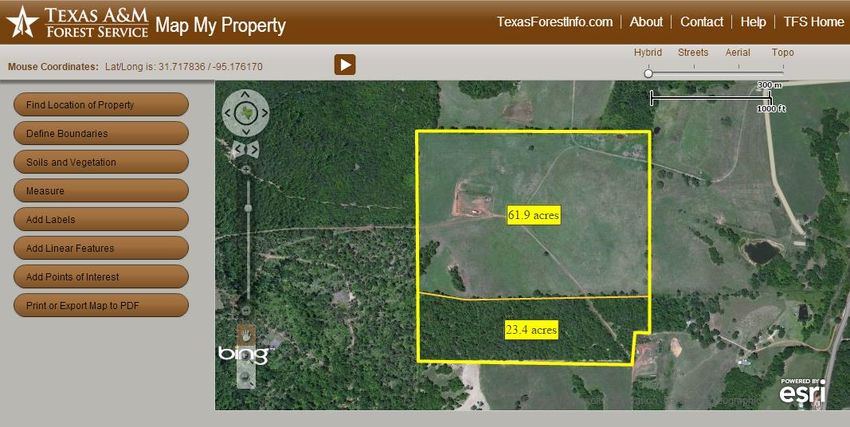
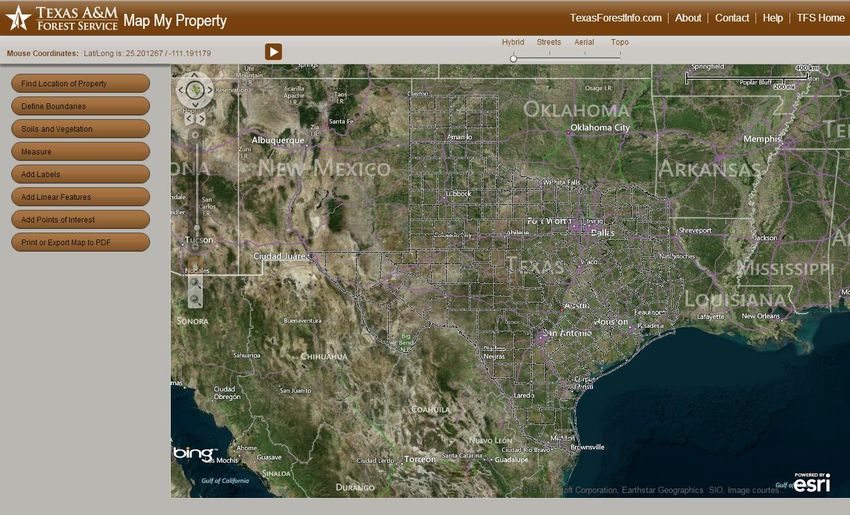
Texas A&M Forest Service
 Service

About Map My Property
Map My Property is a mechanism for the Texas A&M Forest Service to provide users with tools to locate
their property, draw and edit the property boundary, measure areas and distances, create labels, linear
features, and points of interest, and preview the property boundary map before it is printed or converted
to PDF. The application also allows users to view and identify soils and vegetation types, clip these layers to
the property boundary, and display in a table the proportion of each type of soil or vegetation in the
property.

Accessing Map My Property
The Map My Property application is located at http://tfsfrd.tamu.edu/MapMyProperty/ and is
accessible using Microsoft Internet Explorer, Mozilla Firefox, Google Chrome, or Apple Safari. It is
recommended that Firefox or Google Chrome be used with the application to optimize performance.

Map My Property main page

Map My Property                                                                                           Page 2
April 2015
Texas A&M Forest Service
 Service

Links

TexasForestInfo.com
TexasForestInfo.com will take you to the Texas Forest Information Portal.

About
The About page provides a brief statement on what Map My Property is used for.

Contact
The Texas A&M Forest Service invites you to provide feedback on the Map My Property application.
Please click on the email address provided and send your questions, comments, and suggestions for
improvement.

Help
User documentation is provided online. Click the Help link available on the main page to access this user
guide. Additionally, for quick information, press the icon provided in the upper right part of each
expanded toolbox.

TFS Home
Click TFS Home to go to the Texas A&M Forest Service main page.

Navigating the Map
There are several ways to navigate the map. You can zoom to a specific location by entering an address or
geographic coordinates in the Find Location of Project Area toolbox. Alternatively, you can manually
pan and zoom around the map using the standard Navigator tool in the upper left of the map panel.

Navigating to a Specific Location
Please see description of the “Find Location of Property” toolbox.

Map My Property                                                                                        Page 3
April 2015
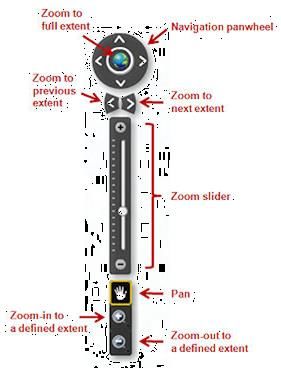
Texas A&M Forest Service Service Zooming and Panning There are several ways to zoom and pan around the map using the navigation control found on the top left side of the application. Navigation Panwheel • Zoom to Full Extent – Click on the Texas icon and it will zoom to the full extent of the map. • Pan up – Click on the arrow pointing up to pan the map up. • Pan down – Click on the arrow pointing down to pan the map down. • Pan right – Click on the arrow pointing right to pan the map to the right. • Pan left – Click on the arrow pointing left to pan the map to the left. Zoom to Previous Extent – Click on the arrow pointing left to zoom to the previous extent in extent history. Zoom to Next Extent – Click on the arrow pointing right to zoom the next extent in extent history. Zoom Slider – Incremental Zoom – use the + and - buttons or move the circular handle to the desired zoom level. Pan button – Click on the icon to pan on the map. This tool is usually needed after using the zoom-in-to- a-defined-extent or the zoom-out-to-a-defined-extent tool. Zoom-in-to-a-defined-extent-button – Click on the icon and click on the map to draw a rectangle that will be the extent to which the tool will zoom in the map. The cursor will change to a icon. To return to the regular cursor and disable the zoom-in tool, click on the pan button. Zoom-out-to-a-defined-extent button – Click on the icon and click on the map to draw a rectangle that will be the extent to which the tool will zoom out the map. The cursor will change to a icon. To have a regular cursor and disable the zoom-out tool, click on the pan button. Selecting a Base Map You can view different base maps anytime you desire by sliding to the map option you prefer to view: Hybrid – Bing! aerial imagery and labeled roads Streets – Esri roads Aerial – Esri imagery Topo – Esri topographic basemap Map My Property Page 4 April 2015
Texas A&M Forest Service
 Service

Toolboxes
The left panel in Map My Property consists of toolboxes that contain tools that locate and draw the
boundaries of your property, identify and clip soils, display sensitive areas, conduct operational planning
procedures, measure area and distance, add labels, add linear features, add points of interest, and preview
a map with your property boundary before you print it or save it to PDF. In addition, there are several tools
to produce various reports for the project area.

Find Location of Property
This toolbox is used to locate your project area quickly. You can either type the
address of your property or enter the coordinates in decimal degrees.

Type Address
Type an address or place name and press the Find Address button. Valid
addresses can be in the format of number, street name, city and state
abbreviation (or zip code) such as “200 Technology Way, 77845” or “200
Technology Way, College Station, TX.” Additionally, you can enter just the place
name and state abbreviation (or zip code) such as “Jot 'Em Down, Texas” or the
street name, city and state (or zip code), for example “FM 2154, 77845” or “US
290, Dripping Springs, TX.” If there is a match, the tool window will show the
address returned and the map will zoom in to the place matching that location.

Click on Clear Location to delete the point on the map displaying the location of the address used to
find the location of the project area.

Type Latitude and Longitude
If you have coordinates for the project area in decimal degrees, you can type
them in the boxes below "Type Latitude and Longitude" and click on the Search
button. If coordinates are entered correctly, the map will zoom in to the place
matching the coordinates. Click on Clear Location to delete the point displaying
the location of the coordinates used to find the location of the property.

Map My Property                                                                                         Page 5
April 2015
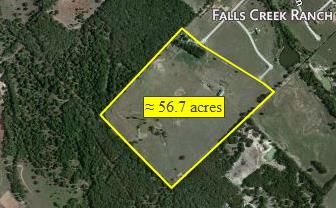
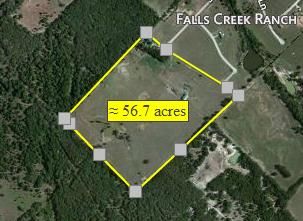
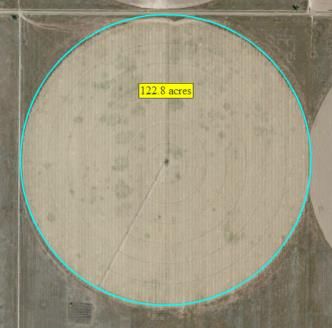
Texas A&M Forest Service
 Service

Define Boundaries
This toolbox contains tools to define the boundaries of the project area. You
can draw a boundary and/or load a GPX file with GPS points or a shapefile
containing a polygon of the project area.

Draw
To define the project area by drawing it on the map, click on the Draw button.
After moving the cursor to the map, click along the perimeter of the project
area at each point along the boundary where the direction changes. On the
final corner, or vertex, double-click on the point to complete the boundary.

If you are not satisfied with part of the drawing and want to edit it, click on the
drawn property to enable the editing mode and view vertices (gray squares)
that can be dragged to reshape the boundary. To drag any vertex, click on it
and drag it to a new location. To delete individual vertices, right-click on the
vertex and click on "Delete vertex". To add a vertex, click anywhere on the
boundary and a new vertex appears. To disable the editing mode, click anywhere on the map outside the
boundary.

To delete individual boundaries or individual acres labels, right-click inside the boundary or on the acres
label and click on "Delete Me". To move the entire boundary, click on the drawing to enable editing mode,
and then drag the entire drawing to a new location. To move the acres labels, click once on the label and
then move it.

To draw additional areas, for instance, stands or management areas, repeat the previous steps. Holding
the  button down while adding a vertex will cause the new point to “snap” to an existing boundary
point. This is especially useful when drawing stands within a tract boundary.

If you are not satisfied with the entire drawing, click on Clear Boundaries to delete it from the map. If you
do not wish to display the acres labels inside the property boundary, click on Clear Acres Labels and the
labels will be removed from the map.
 Drawn boundary and acres label                         Drawn boundary in editing mode with vertices

The color, line style, line width, and transparency can be set using the appropriate tool setting in the
toolbox. However, these settings must be set prior to drawing a boundary. Default values are yellow,
solid, 2 points, and 0 transparency for the respective settings.

Map My Property                                                                                            Page 6
April 2015
Texas A&M Forest Service
 Service

Load
Map My Property allows you to load either a GPX file that contains GPS points or load a shapefile containing
a polygon of a boundary. To load either type of file, click on Load. In the Select-file-to-upload window,
navigate to the appropriate path, or folder, on your computer, select the file type at the bottom of the
window (default is ZIP file), select the file to load, and click on Open.

If a GPX file is loaded, the points will be converted to a polygon if the area is smaller than 10,000 acres.

If a shapefile is loaded, it must be in the form of a zipped file (since a shapefile is actually made up of a
minimum of three files).

A loaded file can be edited the same way as described above for drawing a boundary. Also, remember to
set your boundary properties, e.g. color, before loading, as the loaded file will take on the properties of the
current settings in the toolbox.

Save
Map My Property allows an easy way to save your boundary as a zipped shapefile in order to load it back in
during a new, later session, or to have it accessible to load into other GIS software programs, such as
ArcMAP, located on your local computer.

To save your boundary to a zipped shapefile, click on Save. When the Select-location-download window
appears, navigate to the appropriate location on your local computer and type in a file name making sure to
end the name is “.zip”, and clicking on Save. Not adding the “.zip” file name extension will result in the file
being unloadable later.

Soils and Vegetation
Map My Property can display a soils layer and a vegetation type layer using the
Soils and Vegetation toolbox.

Soils
This toolbox contains several tools for displaying soils and their attributes either
across the entire map or just within the project area.

The Soils layer was developed from the Natural Resource Conservation Service
(NRCS) Soil Survey Geographic (SSURGO) database. For a description of SSURGO,
refer to the NRCS Description of SSURGO Database at
http://www.nrcs.usda.gov/wps/portal/nrcs/detail/soils/survey/?cid=nrcs142p2_053627. For additional
information on soil surveys, read the NRCS Soil Survey Manual at
http://www.nrcs.usda.gov/wps/portal/nrcs/detail/soils/planners/?cid=nrcs142p2_054262.

To display the soils across the whole map, ensure that Soils is checked and then check on the
Visible checkbox. Soil labels will also appear if zoomed in enough.

Map My Property                                                                                                 Page 7
April 2015
Texas A&M Forest Service
 Service

To investigate various attributes associated with an individual soil, check the Identify checkbox. When the
Identify checkbox is checked, click on an individual soil on the map to display a window listing a set of
selected attributes for that soil.

The soils layer shows map units, which are
collections of areas defined and named the same in
terms of their soil components. For simplicity, the
term soil here refers to a map unit. The following
attributes have been extracted from SSURGO and
included here:
Mapunit Key: Unique number for soil used to relate
to attribute tables.
Mapunit Symbol: Label used on map to identify
each soil.
Mapunit Name: Name of soil.
Slope Gradient: Percent slope.
Flooding Frequency: The annual probability of a flood event expressed as a class including None, Very Rare,
Rare, Occasional, Frequent, and Very Frequent.
Drainage Class: The natural drainage condition of the soil refers to the frequency and duration of wet periods
including Excessively Drained, Somewhat Excessively Drained, Well Drained, Moderately Well Drained,
Somewhat Poorly Drained, Poorly Drained, Very Poorly Drained.
Potential Erosion Hazard: The relative potential erosion hazard for the soil when used as a site for forest
roads and trails, expressed as a rating class including Not Rated, Slight, Moderate, Severe, and Very Severe.
Hydric Classification: An indication of the proportion of the soil, expressed as a class, that is “hydric,” based
on the hydric classification of individual components of the soil, or map unit. Classes include Unknown, Not
Hydric, Partially Hydric, and All Hydric.
pH Top Horizon: pH of top horizon as determined using the 1:1 soil-water ratio method. A measure of the
relative acidity or alkalinity of a soil sample (acid < 7; alkaline > 7)
Ecological Class ID: Ecological Classification ID is the identifier of a particular ecological community. It also
serves as a hyperlink to NRSC information about that Ecological Class.
Ecological Class: Ecological Classification Name is the descriptive name of a particular ecological community.
Range Productivity (lb/ac/yr): The estimated annual production of range forage in pounds per acre per year.
Forest productivity (cuft/ac/yr): The annual growth of forest overstory trees in cubic feet per acre per year.
Site Index Max Values (age 50): Weighted average of the highest site index (height of trees at 50 years of
age) value for any tree species within a component for each soil (map unit).
Site Index Loblolly Pine (age 50): Weighted average of site index for loblolly pine.
Site Index Shortleaf Pine (age 50): Weighted average of site index for shortleaf pine.
Site Index Longleaf Pine (age 50): Weighted average of site index for longleaf pine.

Map My Property                                                                                            Page 8
April 2015
Texas A&M Forest Service
 Service

Site Index Water Oak (age 50): Weighted average of site index for water oak.
Site Index Southern Red Oak (age 50): Weighted average of site index for southern red oak.
Site Index Willow Oak (age 50): Weighted average of site index for willow oak.
Site Index Sweetgum (age 50): Weighted average of site index for sweetgum.
Site Index Cottonwood (age 50): Weighted average of site index for eastern cottonwood.

Vegetation Type
The toolbox can also be used to display vegetation type either across the entire map or just within the
project area.

The Vegetation Type layer was produced by the Texas Parks and Wildlife Department and partners under
the Texas Ecological Systems Classification Project. A 398-class, 10-meter spatial resolution current
vegetation map was completed for the state of Texas. The national Ecological Systems Classification
provided the fundamental mapping targets. Land cover from 3-date, 30-meter resolution satellite imagery,
and abiotic site types from digital county soil surveys and DEM-derived variables, were used together to
model the current vegetation. For additional information on the development of this layer, please see
vegetation documentation from Texas Parks and Wildlife Department.

To show this layer, check Vegetation Layer and ensure Visible is checked. Labels will only show if the zoom
level is sufficient. Click on the Identify checkbox and click on anywhere on the map to display the name of
the vegetation type and the system and subsystem that type belongs to. The vegetation type name and the
subsystem name is hyperlinked to PDF documents that provide short descriptions and photographs.

Clip
Soils or vegetation types can also be shown for only the project area. To do this, click on Clip. The active
layer will be clipped to the boundary of the project area. In addition, a table will display listing the soils or
vegetation types along with the acres and percent of the area they comprise. They will be listed in

Map My Property                                                                                              Page 9
April 2015
Texas A&M Forest Service
 Service

descending order of area. This functionality is only available for project areas of less than 10,000 acres.
Clicking on a soil or vegetation layer on the map will highlight it in both the map and in the table. Likewise,
clicking on a soil or vegetation type in the table will highlight it both in the table and the map. Clicking on a
highlighted soil or vegetation type in either the table or the map will deselect it. The identify tool also
works with the project area layers as they do with the map wide layers.

Transparency
To see what is under the soils or vegetation type layer, adjust the Layer Transparency slider handle to the
right. The higher the value, the more transparent the soils layer will be. A transparency value of 75 and
greater will cause the active layer to display with no fill and with outlines and labels as orange, similar to
the NRCS’s Web Soil Survey.

Click on Clear Clipped Layer to clear the project area soils.

Measure
Map My Property provides several tool for measuring areas or distances.

Area
To measure a polygonal area, click on the Area button. Click on the map where
you want to begin measuring and continue to define the perimeter of the area
you are measuring. Using the  key while defining the perimeters will
“snap” to existing boundaries. Double-click to complete the measurement.
Upon completion of the measurement, a label will appear with the amount of area measured.

Map My Property                                                                                            Page 10
April 2015
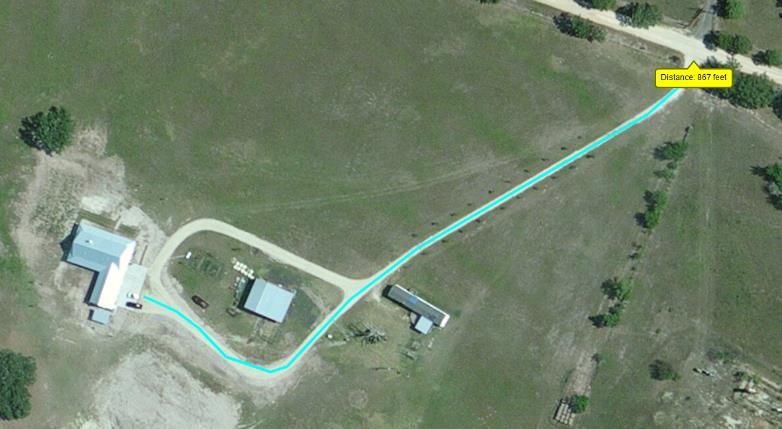
Texas A&M Forest Service
 Service

Distance
To measure a linear distance, click on the
Distance tool. Measure the distance as is
described above for polygonal areas. The
distance will be displayed in feet for distances
less than 3 miles and in miles for distances
greater than 3 miles.

Circle
Circular areas can also be measured. This may
be useful in displaying the area within a certain
distance of a user-defined point. Either a drawn circle or a circular area having a user-defined radius can be
drawn. Clicking on the Circle button will expand it to show the Draw Circle tool and the Create Radius tool.

To draw a circle, click on Draw Circle and click on the map at the user-defined
center of the circle to be measured and while holding the mouse button down,
drag to the desired size on the map. To draw a circle of a specified radius, click
on Create Radius, enter a radius value in feet and click on the map at the
desired location.

Clear the measurement lines or polygons and labels by clicking Clear.

Add Labels
The Add Labels toolbox contains a tool and several settings to add user-
defined labels to a map.

Besides the text, color, size, and font can be set. In addition, other settings
such as bold and italic can be defined.

To add a label, enter the text for the label and click on Add Label to
activate the tool. Click on the desired location on the map to add the label.
If the label is not exactly where you want it, click on it and drag it to a new
location.

If you want to change any attributes to different values than what are
provided as defaults, you’ll need to change the values before adding the
label. Once the label has been added, its appearance cannot be changed,
with the exception of location.

To delete individual labels, right-click and select Delete me. To delete all labels at once, click on Clear
Labels.

Map My Property                                                                                           Page 11
April 2015
Texas A&M Forest Service
 Service

Add Linear Features
The Add Linear Features toolbox contains two tools for adding linear
features such as roads, streams, and utility right-of-ways. Linear features
can either be drawn as polylines (connected segments of straight lines) or as
freehand lines, such as the way you might draw using a pencil.

The style can be set (solid, dash, dot, etc.), the color, the width (in points),
and the transparency. As described for labels, these settings must be set
before adding the linear features.

Line
To draw a polyline linear feature, click Line and click on the map at the
starting point and begin adding straight-line segments. Double-click to
complete the feature.

Freehand
To draw a freehand linear feature, click
Freehand and click on the map at the desired
starting point and while holding the mouse
button down, drag the mouse along the desired
route of the feature. To complete the feature,
release the mouse button.

Editing of vertices, or points, along the features can be done the same way as described for defining
boundaries. Click Clear to remove all linear features.

Add Points of Interest
Map My Property also includes a toolbox that contains a tool for adding points of
interest. The toolbox provides many ways to define the appearance of a point of
interest. The shape can be defined including circle, cross, diamond, square,
triangle, and x. The size can be changed from default of 20 points. The color and
transparency of the fill can be defined as well as the style, color, width, and
transparency of the outline of the symbol.

To add a point of interest, click Add Point of
Interest. Once the tool is activated, click on the
map at the desired location. As with labels, the
point can be moved. However, the appearance
cannot be modified.

Right-click and select Delete me to remove an individual point of interest. To
remove all points, click Clear Points of Interest to clear all points.

Map My Property                                                                                         Page 12
April 2015
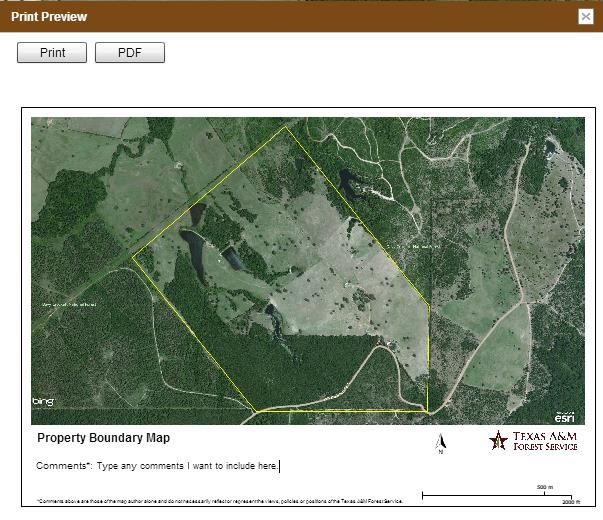
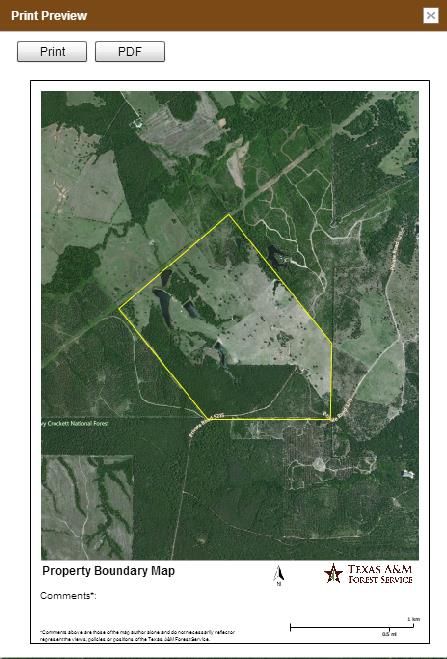
Texas A&M Forest Service
 Service

Print or Export Map to PDF
Besides printing pre-designed reports, Map My Property includes a toolbox to
print or export a map to PDF format. The Print or Export Map to PDF toolbox
contains two options for printing maps: one to print at a landscape aspect
ratio (long side horizontal) and one to print at a portrait aspect ratio (long side
vertical).

Both options allow you to preview the map before printing or saving to PDF. Make sure you position the
project area on the screen before clicking on either button. You may need to pan the map around to find
the best position.

On the print preview screen, any user-defined text can be entered into a text area to the right of the
Comments label. This text will be printed or exported with the map.

Clicking on Print will take you to your computer’s print screen from which you can print as you normally do.
One important thing to note here is that if you print to landscape, you will need to set your printer
properties to landscape; else, the map will print as landscape but on a page positioned as portrait.

Clicking on PDF will bring up your computer’s Save As window from which you can save to a PDF. It is
important here to ensure that the file name ends in “.pdf”.

Portrait                                           Landscape

Map My Property                                                                                          Page 13
April 2015
You can also read