BEFESA - First Quarter 2019 Presentation - BEFESA
←
→
Page content transcription
If your browser does not render page correctly, please read the page content below

BEFESA                            BEFESA

First Quarter 2019 Presentation
                                      8 May 2019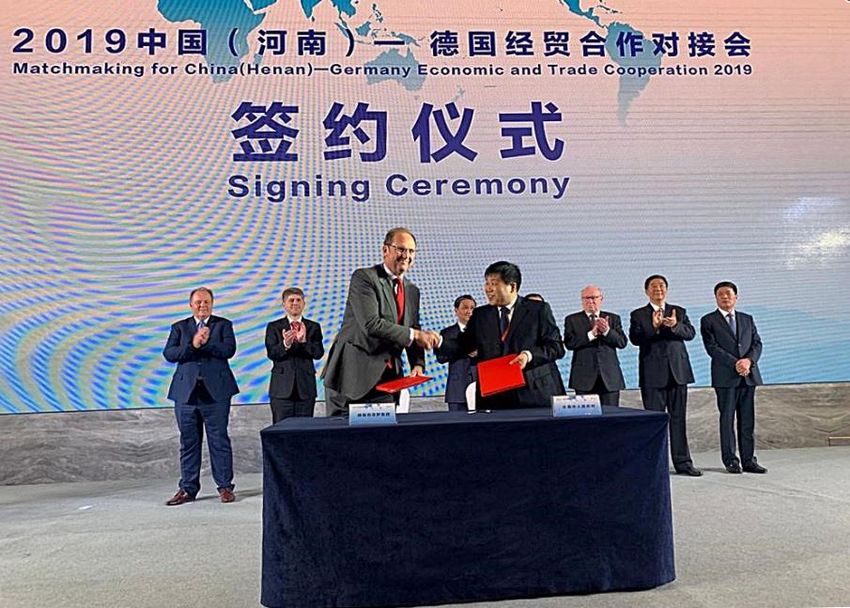
BEFESA                                                                                                                                       Disclaimer
This presentation contains forward-looking statements and information relating to Befesa and its affiliates that are based on the beliefs of its management,
including assumptions, opinions and views of Befesa and its affiliates as well as information cited from third party sources. Such statements reflect the current
views of Befesa and its affiliates or of such third parties with respect to future events and are subject to risks, uncertainties and assumptions.

Many factors could cause the actual results, performance or achievements of Befesa and its affiliates to be materially different from any future results,
performance or achievements that may be expressed or implied by such forward-looking statements, including, among others: changes in general economic,
political, governmental and business conditions globally and in the countries in which Befesa and its affiliates do business; changes in interest rates; changes
in inflation rates; changes in prices; changes to national and international laws and policies that support industrial waste recycling; legal challenges to
regulations, subsidies and incentives that support industrial waste recycling; extensive governmental regulation in a number of different jurisdictions, including
stringent environmental regulation; management of exposure to credit, interest rate, exchange rate and commodity price risks; acquisitions or investments in
joint ventures with third parties; inability to obtain new sites and expand existing ones; failure to maintain safe work environments; effects of catastrophes,
natural disasters, adverse weather conditions, unexpected geological or other physical conditions, or criminal or terrorist acts at one or more of our plants;
insufficient insurance coverage and increases in insurance cost; loss of senior management and key personnel; unauthorized use of Befesa’s intellectual
property and claims of infringement by Befesa of others’ intellectual property; Befesa’s ability to generate cash to service its indebtedness changes in business
strategy and various other factors. Should one or more of these risks or uncertainties materialize, or should underlying assumptions prove incorrect, actual
results may vary materially from those described herein as anticipated, believed, estimated, expected or targeted.

Befesa and its affiliates do not assume any guarantee that the assumptions underlying forward-looking statements are free of errors nor do they accept any
responsibility for the future accuracy of the opinions expressed herein or the actual occurrence of the forecasted developments. No representation (express or
implied) is made as to, and no reliance should be placed on, any information, including projections, estimates, targets and opinions, contained herein, and no
liability whatsoever is accepted as to any errors, omissions or misstatements contained herein or otherwise resulting, directly or indirectly, from the use of this
document.

This presentation is intended for information only and should not be treated as investment advice. It is not intended as an offer for sale, or as a solicitation of
an offer to purchase or subscribe to, any securities in any jurisdiction. Neither this presentation nor anything contained therein shall form the basis of, or be
relied upon in connection with, any commitment or contract whatsoever. This presentation may not, at any time, be reproduced, distributed or published (in
whole or in part) without prior written consent of Befesa.

First quarter 2019 figures contained in this presentation have not been audited or reviewed by external auditors.

This presentation includes Alternative Performance Measures (APMs), including EBITDA, EBITDA margin, EBIT, EBIT margin, net debt and capital expenditures
which are not measures of liquidity or financial performance under International Financial Reporting Standards (IFRS). EBITDA is defined as operating profit for
the period (i.e. EBIT) before the impact of amortisation, depreciation, impairment and provisions. EBITDA margin is defined as EBITDA divided by revenue. EBIT
is defined as Operating profit for the year. The Company uses EBIT to monitor its financial return after both operating expenses and a charge representing the
cost of usage of both its property, plant and equipment and definite-life intangible assets. EBIT margin is defined as EBIT as a percentage of revenue. These
non-IFRS measures should not be considered in isolation or as an alternative to results from operating activities, cash flow from operating, investing or
financing activities, or other financial measures of Befesa’s results of operations or liquidity derived in accordance with IFRS. Befesa believes that the APMs
included in this report are useful measures of its performance and liquidity. Other companies, including those in the industry in which Befesa operates, may
calculate similarly titled financial measures differently than Befesa does. Because all companies do not calculate these financial measures in the same manner,
Befesa’s presentation of such financial measures may not be comparable to other similarly titled measures of other companies. These APMs are not audited.
                                                                                                                                                                      2
BEFESA                                                                      Today’s Presenters

                CEO since 2000                     CFO since 2014                         Since 2008

              Javier Molina                       Wolf Lehmann                         Rafael Pérez

              CEO                                 CFO; including                       Director of
                                                  responsibilities                     Investor Relations
                                                  for Operational                      & Strategy
                                                  Excellence and IT

▪ Leading the Company
                                 ▪ 20+ years in finance and           ▪ Director of Investor Relations
  since 1994
                                   operational leadership roles         and Strategy of Befesa
                                                                        since 2008
                                 ▪ 50/50 General Electric /
                                   Private Equity

                                                                                                            3
BEFESA                                                                  Key Highlights

 FY 2019 targeting EBITDA growth of +3% to +5% / €182 to €185m; considering
 reference Treatment Charge (TC) of up to $245/t & ~$2,850/t avg. ´19 LME zinc price

 Expecting stronger H2´19 vs. H1´19 mainly due to Turkey back in operations
 with increased capacity Q3 onwards and continued Stainless recovery

 Q1 volumes in core segments as expected: Steel Dust throughput at 169kt (-10% YoY)
 due to downtime to increase Turkey capacity; Salt Slags ~flat (-1% YoY)

 Q1 EBITDA at €43m (-3% YoY); As anticipated impacted by
 - Lower volume in Turkey & unfavourable reference TC;
 +Partially offset by: Better zinc hedges, recovered Stainless operations &
   upgraded high efficiency furnaces in 2nd Aluminium delivering results

 Profitability continues at solid 24% EBITDA margin; Leverage at x2.2

 Execution of organic growth projects on track: Turkish plant six-month shutdown
 to increase capacity started January ‘19; Korea washing plant progresses as planned

 China - Plant #1 (Jiangsu): Broke ground April ’19; Ramp-up planned H2’20;
 Plant #2 (Henan): Signed agreement; Breaking ground Q4’19; Ramp-up H1’21

 Free float increased to 81% after Triton placed 13% in April ’19
                                                                                         4
BEFESA Consolidated Key Financials
Q1 EBITDA as expected at €43.0m (-3.4% YoY): Impacted by lower volumes in
Turkey and unfavourable reference TC; partially offset by improved hedging
prices, recovered performance in Stainless and upgraded high efficiency furnaces
Revenue Highlights
(€m)
▪ Q1 revenue 2019 down 8% YoY to €179.1m primarily due to:
- Lower volumes in Turkey due to scheduled six-month downtime
195.4 179.1 to upgrade capacity from 65kt to 110kt
- Unfavourable zinc reference TC for 2019 ~$245/t vs. $147/t ‘18
- Lower market prices: LME zinc prices down 14% (Q1’19: €2,380/t;
Q1 '18 Q1 '19
Q1’18: €2,776/t); aluminium alloys market prices down 17%
(Q1’19: €1,528/t; Q1’18: €1,833/t)
- Revenue decrease partially offset by:
(i) Improved hedging prices (Q1’19: €2,344/t vs. Q1’18: €2,021/t)
improved blended zinc prices (Q1’19: €2,374/t; Q1’18: €2,299/t)
(ii) Recovered YoY performance in Stainless
EBITDA and % margin
(€m)
▪ Q1 EBITDA at €43.0m (-3.4% YoY) / 24% EBITDA margin;
44.5 43.0 following the above drivers:
- Turkey shutdown to upgrade capacity & unfavourable TC;
+ Partially offset by better zinc hedges & recovered Stainless
operations (details above) -as well as-
Q1 '18 Q1 '19
+ 2nd Aluminium furnaces upgrades from 2018 delivering results
23% 24%
5
BEFESA                                                                             Steel Dust Recycling Services
Q1 EBITDA at €33.9, down €2.2 YoY; driven by lower volume in Turkey &
unfavourable ref. TC – partially offset by recovered Stainless & improved hedges
Revenue                                                            EAF dust throughput & capacity utilisation
(€m)                                                               (thousand tonnes, % of annual installed capacity)
                       €-6.5m / -6.4%
                    101.6           95.1

                                                                                               187.8
                                                                                                                  169.0

                    Q1 '18         Q1 '19

EBITDA and % margin                                                                                                             % Cap.
                                                                                               98%                 88%
(€m)                                                                                                                            Util‘n

                                                                                               Q1 '18             Q1 '19
                     36.1           33.9                            ▪ Throughput impacted as expected by downtime in Turkey
                                                                      to expand capacity from 65kt to 110kt since January ´19
                    Q1 '18         Q1 '19
                     36%            36%

Highlights                                                         Prices                    Q1          Q1       %                      LTM        %
                                                                                                                             2018
▪ Q1 revenue down 6% driven by 10% lower throughput                (€ per tonne)            2018        2019     Var.                    Q1’19     Var.
  YoY - Turkey plant upgrade; also higher TC referenced at          Befesa blended (*)
  approx. $245/t in ´19 vs. $147/t in ´18; partially offset with                            2,299       2,373    +3%         2,168       x,xxx    +xx%
                                                                    average zinc price
  higher blended zinc prices
▪ Q1 EBITDA following the above explained drivers as well           LME average price       2,776       2,380   -14%         2,468       2,368     -4%
  as improved performance in Stainless operations
                                                                    (*) Blended rate between hedged prices and average spot prices, weighted by the
                                                                    respective hedged and non-hedged volumes, reflecting the effective price to Befesa
                                                                                                                                                          6
BEFESA                                                         Aluminium Salt Slags Recycling Services
    Q1 EBITDA grew to €8.9m (+9% YoY) mainly driven by furnace upgrades in ´18
    showing results (2nd Aluminium) partially offset by lower aluminium alloy prices
     Revenue(1)                                                     Volumes & capacity utilisation
     (€m)                                                           (thousand tonnes, % of annual installed capacity)
                                                                     Salt Slags & SPL treated
                                   94.5                 83.8

                                   83.2                  71.6                                   131.0              129.1
                                   21.9                  22.3
                                                                                                                                % Cap.
                                  Q1 '18                Q1 '19                                 100%                 99%         Util‘n

     EBITDA and % margin(2)                                                                     Q1 '18             Q1 '19
     (€m)
                                                                     Aluminium alloys produced
                                   8.1                   8.9
                                    1.6                  2.5                                    49.6                48.0
                                    6.6                  6.4
                                                                                                                                % Cap.
                                  Q1 '18                Q1 '19                                  98%                 95%         Util‘n

                                  30%                   29%
                                                                                               Q1 '18              Q1 '19

     Highlights                                                     Prices                      Q1        Q1         %                    LTM      %
                                                                                                                                2018
                                                                    (€ per tonne)              2018      2019       Var.                  Q1’19   Var.
     ▪ 2nd Aluminium: Q1 EBITDA up €0.9m driven by higher
       margins due to more efficient furnaces showing results        Aluminium alloy
                                                                                              1,833      1,528      -17%        1,715     1,639   -4%
                                                                     average price (*)
       offsetting lower prices
                                                                     (*) Aluminium scrap and foundry ingots aluminium pressure diecasting ingot
     ▪ Salt Slags & Spent Pot Linings (SPL): Q1 EBITDA               DIN226/A380 European Metal Bulletin free market duty paid delivered works
       slightly down €0.2m YoY mainly due to decreased               Salt Slags subsegment
       aluminium alloy prices                                        Secondary Aluminium subsegment

(1) Total revenue after intersegment eliminations                                                                                                        7
(2) EBITDA margins refer to the Salt Slags subsegment
BEFESA                                                  Consolidated Net Debt / Leverage / Cash Flow / Ratings
    Leverage at x2.20 at Q1’19 ~stable compared to x2.14 at YE’18

  Net debt                                                                                              Q1’19 EBITDA to total cash flow – main drivers
  (€m, as of 31 March 2019)                                                                             (€m)
             538 (1)                           155                                                       EBITDA                    €43
                                                                             383
                                                                                                         WC change                 €-13          Loading of sales within quarters Q4/Q1
                                                                                                         & other
                                                                                                         Taxes                     €-5           Nominal 25% vs. cash tax rate
BEFESA 2019 – Outlook
Targeting EBITDA growth of +3% to +5% / €182 to €185m; Mainly based on:
+ Hedged ~€2,325 vs. €2,051 in ´18; Unhedged at current ~LME €2,522/$2,850 levels
- Limited by higher reference TC of up to $245/t in ´19
+ Stainless operations recovering vs. (€4m) negative EBITDA in ´18
+ Aluminium furnace upgrades implemented in ´18 delivering positive results
Expecting continued high utilization levels in both core segments; Steel Dust >90%
and Salt Slags >95%. Volume overall stable YoY.
Expecting stronger H2´19 vs. H1´19 mainly due to Turkey back in operations
with increased capacity Q3 onwards and continued Stainless recovery
With ~70% of zinc output hedged the earnings variation for the remaining 3 quarters
is limited to +/- €3m for each +/- €100/t LME Zinc price variation vs. €2,522 avg. ´19
Total CapEx expected at ~€85m: ~€60m to fund top growth projects –
Steel Dust: Turkey, Korea and China & Aluminium Salt Slags: Final furnace upgrade;
~€25m for maintenance / others, similar to 2018
Maintaining dividend policy of distributing 40 to 50% of net profit
Current operating cash flow run rate funds CapEx and dividend;
Expecting balanced total cash flow and full year leverage similar to current levels
9BEFESA Mid-Term Growth Roadmap
Accelerating growth through well defined business plan;
Hedging in place and executing top 5 growth projects + China
1 Hedging
• 2019: 92.4kt at ~€2,325/t
• 2020: 92.4kt at ~€2,260/t
• H1 2021: 46.2kt at ~€2,230/t
2 Organic growth
2019/20 focus – top 5 projects:
• Steel Dust:
Indicative earnings
- Turkey 65110kt; Ramp-up Q3´19
- Korea washing plant;
3 Completion Q4´19
• Aluminium Salt Slags:
2021+
2 - 2x tilting furnaces
(✓Bilbao, Barcelona Q3´19)
1
2019/20/21 - Expand Hannover (130kt 170kt)
2019 3 China
€176m
• Developing two EAF dust
recycling plants in two provinces:
- #1 (Jiangsu): broke ground in
April ´19; Ramp-up ~H2´20
Mid-term
2018 Hedging Organic China - #2 (Henan): agreement signed;
business
EBITDA growth
plan breaking ground in Q4´19;
Ramp-up ~H1´21
10
Note: Chart is illustrative and size of respective arrows in the chart is not indicative to the underlying growth potentialChina – Plant #1: Jiangsu
BEFESA 3
– Groundbreaking Ceremony
Broke ground at Changzhou plant on 10 April 2019;
Starting construction for ramp-up in H2 2020
1
Plant #1 in Changzhou
(Jiangsu province)
Key facts of the plant
• 1st Electric Arc Furnace (EAF) dust recycling plant
in China with capacity to recycle 110kt / year
• Total investment: ~€45m
Status
✓ Ground breaking ceremony on 10 April 2019
➢ Starting construction
➢ Scheduling to ramp up operations in H2 2020 11China – Plant #2: Henan
BEFESA 3
– Contract Signing
Signed development agreement on 8 April 2019;
Targeting ground breaking in Q4 2019
2
Plant #2 in Xuchang
(Henan province)
Henan background Key facts of the plant
Henan is located in central China, with a population of 95 • 2nd EAF dust recycling plant in the country
million people and a GDP of $726 billion. Over the past two
decades, Henan has developed rapidly, and is one of the most • Capacity to recycle 110kt EAF dust / year
important producers of EAF steel in China. • Total investment: ~€45m
Status
Plant location
✓ Signed development contract on 8 April 2019
Changge Dazhou Industrial Cluster, XuChang City. Potential to
also service Hu Bei province (on the southern border of Henan ➢ Targeting ground breaking in Q4 2019
province).
➢ Scheduling to ramp up operations in H1 2021 12BEFESA Investor Agenda
Financial Calendar Meet Befesa …
✓ Wednesday, 8 May 2019: 14 May 2019 – Midcap Partners
Q1 2019 Statement & Analyst Call Paris, Annual Small & Midcap Conference
21-23 May 2019 – Berenberg
Wednesday, 19 June 2019: New York, US Conference 2019
Annual General Meeting in Luxembourg
28 May 2019 – Mainfirst
Frankfurt, SMid Cap one-on-one Forum 2019
Thursday, 25 July 2019:
H1 2019 Interim Report & Analyst Call 5-7 June 2019 – Deutsche Bank
Berlin, dbAccess Conference
Thursday, 31 October 2019: 11-13 June 2019 – Stifel
Q3 2019 Statement & Analyst Call Boston, 2019 Cross Sector Insight Conference
27-29 August 2019 – Commerzbank
Frankfurt, Sector Conference 2019
10-12 September 2019 – J.P. Morgan
London, Pan European Small & Mid-Caps
19-20 September 2019 – Citi
London, SMID/Growth Conference 2019
23-25 September 2019 – Goldman Sachs & Berenberg
Munich, 8th German Corporate Conference
IR Contact 13-14 November 2019 – Goldman Sachs
Rafael Pérez London, 8th Global Natural Resources Conference
Director of Investor Relations & Strategy
T: +49 (0) 2102 1001 340 2-5 December 2019 – Berenberg
E: irbefesa@befesa.com London/Pennyhill Ascot, European Conference 2019
Note: Befesa’s financial reports and statements are published at 7:30 am CEST 13
Befesa cannot rule out changes of dates and recommends checking them in the Investor Relations / Financial Calendar section of our website www.befesa.comBEFESA
Appendix
14BEFESA Zinc Prices & Hedging Strategy
Hedging up to Jul. ´21 improves earnings & cash flows visibility for next 3 years
€ 3,000
Market zinc price vs. zinc hedges *
(€/tonne)
€ 2,500
€2,325
€2,260 H1 ’21:
€2,168
€2,160 €2,230
€ 2,000 €2,051
€1,939 €1,876
€ 1,500
2017 2018 2019 2020 H1 ’21
€ 1,000
LME zinc Swap Floor Average hedged price (€/t) €1,876 €2,051 €2,325 €2,260 €2,230
Average blended Zinc content hedged (kt) 73.2 92.4 92.4 92.4 46.2
€ 500
Source: London Metal Exchange (LME) zinc daily cash settlement prices; Company information
Zinc hedges & blended average prices – 2018 / 2019
32% or 44kt ~32% or ~44kt
2019 ▪ Hedges in place until and
@€2,468/t LME Unhedged @€2,522/t* LME
estimated including July 2021
2018 blended
or $2,925/t LME or ~$2,850/t LME
blended zinc price:
zinc price:
68% or 92kt ~68% or ~92kt ~€2,388/t ▪ Majority of hedges Euro based
€2,168/t Hedged
@€2,051/t @€2,325/t +€220/t or
hedge price hedge price +10% YoY
▪ Befesa providing no collateral
2018 2019E
15
* Assumes reference TC of $245/t with escalators between $2,700 to $3,000/t LME zinc – mid-point $2,850/t – similar to April price level. $2,850/t at FX USD/EUR 1.13 equal to €2,522/t.You can also read