Multiple Regression Time Series Model for forecasting Gold Prices
←
→
Page content transcription
If your browser does not render page correctly, please read the page content below
International Journal of Future Generation Communication and Networking
                                                              Vol. 14, No. 1, (2021), pp.2162–2168

       Multiple Regression Time Series Model for forecasting Gold Prices
      Tanmay Aggarwal1, Debapriya Nayak2, Somya Agarwal3, Parul Gupta4, Gauri Anand5
                   1,2,3,4
                             Narsee Monjee Institute of Management Studies Mumbai, Maharashtra

                                                      Abstract
 Prediction of price is an important aspect of the finance domain. This urge to create commercial value makes
developing fitter predictive model’s necessary. Gold Price is considered an easy liquid investment and is a
popular investment by people in rural regions. Gold is a commodity investment which requires a Global outlook
for safe investment and better returns. Multiple linear regression is statistical tool which helps to determine
relationship between many variables. In the regression one variable acts as a dependable variable while all the
other variable act as an independent variable. The forecasting based on multiple linear regression helps in the
prediction on values of the dependent variable. The study considers Gold price as the dependent variable and the
objective is to develop a multiple linear regression-based forecasting model based on financial factors such as -
Crude oil price, interest rate (repo rate), Indian currency price in dollars, Sensex (BSE), Inflation rate and US
Dollar index. Any sudden increase in demand can be traced with the help of such model as it will be being an odd
condition as compare to the structure and pattern of the forecasted gold price. This study will help us in developing
such a model for the gold price.
Keywords— Gold Price, Forecasting, Model, Multiple Regression, Global, Analysis

I.   INTRODUCTION
FOR Indian economy gold has always acted as a valuable contributor from several years. It is even considered as
a “safe heaven” for investments where they protect their wealth as investors feel it to be a good protection against
inflation. Gold’s prices are affected very differently as compared to other commodities because they totally
fluctuate depending on the supply and demand (Ismail, Zuhaimy & Yahaya, Azizi & Shabri, Ani, 2009). The price
of gold is influenced by a few economic and financial variables China is the largest and India is the second largest
importer of gold which accounts for a major percent of world ‘s demand while the gold production in India is just
0.7 % of the world’s production. The major consumption of gold in India is by the jewelry industry, investment
and industry needs (Jyothi Manoj and Suresh K K ,2018).

The study is an attempt to present the forecasting for prediction of gold prices using multiple linear regression.
There are many factors which affect the pricing of gold directly and a few of them affect the prices indirectly.
This study helps in forecasting and analyzing the investment in gold with recognition of global level variables.

This model will help us in knowing that how Crude oil price, interest rate (repo rate), Indian currency price in
dollars, Sensex (BSE), Inflation rate and US Dollar index will follow a relationship with the gold price directly
or indirectly. The regression analysis in which we use one dependent variable and multiple independent variables
is called a multivariate regression analysis (Tabachnick,1996). The forecasting plays an important role in
econometrics and also helps to determine government policies with optimality (Selvanathan, E.A., 1991.). The
business decision which are dependent on the prices of such commodities can make benefits from a feasible
prediction (Kutsurelis, J.E., 1998.). We will have a brief view over the error mean square values of the regression
model which will guide us about the predictive ability of the predictive model (Ismail, Z., F. Jamaluddin and F.
Jamaludin, 2008.). The data is wide spread across the time and is available from dated 1 st October 2000 to 1st
August 2020.

   Problem Statement: Problem which occurs is that the investors are not able to predict the gold price as the lag
based prediction model are not precise for Gold Price Predictions. In India majority investors are fundamental
investors and not the jack of every trade. Thus, giving a statistical essence to investment will help them in getting
better returns. The objective of predicting gold prices with a global influence outlook for better prediction and
helping investors to make gains will monitor following variables. This developed model will fulfil the objective
of proving how a global outlook of commodity investment provides better investment statistics.

II. LITERATURE REVIEW

                                                                                                              2162
ISSN: 2233-7857IJFGCN
Copyright ⓒ2020SERSC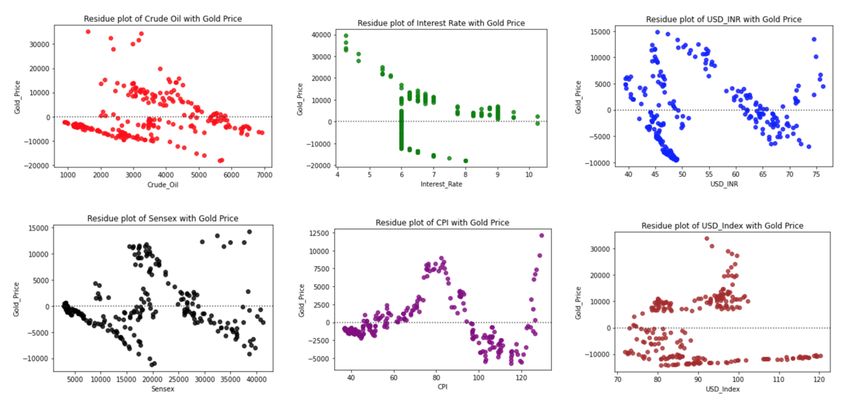
International Journal of Future Generation Communication and Networking
                                                            Vol. 14, No. 1, (2021), pp.2162–2168
The variation of independent variables synchronically is attempted by the multiple regression analysis (Ünver &
Gangam, 1999). The normal distribution, linearity, freedom of outliers acts as an assumption in a multiple
regression analysis and have no multiple relation amongst the independent variable (Büyüköztürk,2002). The is
no depth in literature which specifically mentions about gold price in a global outlook comparison. The correlation
of each independent variable is monitored to check the over fitness of the model.

Forecasting: It is a time series model helps in predicting the future values on the basis of an input which can either
be the past values or some other variable which influence its value. As per the forecasting done by Ismail et al.
(2009), where they collected the data for certain time period of the inflation rate in the US, the gold price was in
correlation with the inflation rate.

They were other explanatory variables taken which had the influence on the prices of gold. By studying the
analysis given by Toraman et al. (2011) we would reach to a conclusion after determination of co relation that
U.S exchange rate has a high correlation followed by a negative correlation by positive correlation of the oil
prices.

In India majority investors are fundamental investors and not the jack of every trade. Thus, giving a statistical
essence to investment will help them in getting better returns. The objective of predicting gold prices with a global
influence outlook for better prediction and helping investors to make gains will monitor following variables.

Interest rates : A country’s apex bank is responsible for determining the interest rate which each bank uses to
determine the Annual percentage rate (APR) range they offer to customers. The gold price and interest rate live
an inverse relation cycle where if the interest rate increases the gold price decreases due to the shift in investment
towards stocks and government bond and vice versa.

Crude Oil: Crude oil is a natural resource which has built the financial strength of many countries and acts as a
driving factor for the economy of these countries. Generally , crude oil prices affects inflation. gold is considered
to be as an inflation hedge, thus increasing the price of gold. But there is a positive moment between the price of
oil and price of gold.

USD - INR: Exchange rates play an important role in a nations level and type of trade, which is critical to almost
every free market economy. In normal circumstances, the gold and dollar have an inverse relationship between
them.
 Any devaluation in dollar shoots up the gold prices and vice versa. This type of negative relation exists firstly
since a declining dollar increases the value of currencies in the rest of the world.

SENSEX: The oldest stock index in India, Sensex is the benchmark index of Bombay Stock Exchange. The index
composition of Sensex is reviewed in June and December every year. The gold price and stock market show
negative relation between each other. When the economy is facing recession, investors move towards gold, raising
the price of gold and less investment is made in stocks, thus crashing the stock market

CPI: It serves as an economic indicator as it is measure of the inflation faced by the end user. A consistent rise in
the index indicates an overall economic growth because inflation is brought about by growth. When CPI rises ,
the currency value goes down and therefore public in general tend to hoard money in the form of gold. Therefore,
when CPI shoots up over a long period of time, gold becomes a factor to hedge against inflation. this pushes the
gold prices in times of inflation.

USD INDEX: The U.S. dollar index (USDX) is a measure of the value of the U.S. dollar relative to the value of
a basket of currencies of the majority of the U.S.'s most significant trading partners. The index is used to measure
the value of the dollar against a basket of six world currencies - Euro, Swiss Franc, Japanese Yen, Canadian dollar,
British pound, and Swedish Krona. Though INR is not in the basket, it is affected by any change in the dollar
index. Dollar index and INR move in the opposite direction. There is a relation between gold prices and USD
index. The stronger the value of US dollar, the lower will be the price of gold and vice versa.

III. METHODOLOGY
The data acquisition is done from authentic sources such as official government website. The data is treated and
filtered for the use of the model. Simplified imputer is used for the treatment of the null values. The auto
correlation between dependent variable and each independent variable is checked to check the data fitness. Scatter
plot and heat map are used for the relation analysis.
Multiple linear regression is a model which can be consider as one of the important statistical technique which
uses the principle least squares for parameters estimation.

                                                                                                               2163
ISSN: 2233-7857IJFGCN
Copyright ⓒ2020SERSC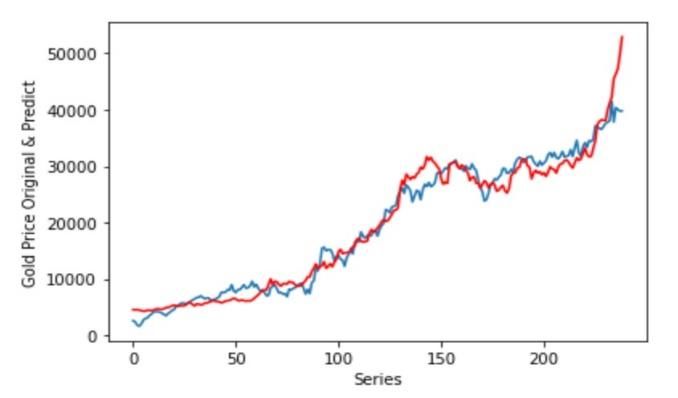
International Journal of Future Generation Communication and Networking
                                                             Vol. 14, No. 1, (2021), pp.2162–2168
                                             Y= b0 +b1X1+b2X2+b3X3+e1

Where Y = D(EOM),
X1= AAA Bond rates,
X2 = 3-4 rates,
X3 = D (3-4) year rates,
E= error term.

The estimation of the values of the parameters b 0, b1,…, bk will be done by the principle of least square. The
parameter which will be considering of least sum of square value of the residual will be best for estimation and
this will happen in the absence of multi collinearity of the taken variables.

The presence of multi collinearity makes it in efficient to determine the importance of independent variable in
explaining the variation caused by the dependent variable. The magnitude of mean squared error shows how close
regression line is to the given set of variables. The resident plots are created by taking the independent variable
on the x- axis or the horizontal axis while the residual is taken along the y – axis. IT is calculated by taking the
difference between the observed value of gold price and predicted value of gold price. The outcome of which is
referred to as the residual.

                                          Residual = Observed - Predicted

A correlation will be analyzed between the gold price and each explanatory variable. The visual analysis of the
co relation will help us in analyzing the relationship between the gold price and the variable. The scatter plots
variables and the nature of their correlation with the gold price. The statistical model summary gives us the f
statistic and t test value. The f test signifies variation of dependent variable in relation to the independent variable
to the model. The t test signifies the importance of an independent variable in the presence of all other variables.

IV. REGRESSION MODEL ANALYSIS

Data Study: The data is taken from authentic sources, Website of U.S treasury, U.S Government Website, Yahoo
Finance and Natinal Stock Exchange. The data is taken for a particular time period which is. 01/10/2000 to
01/08/2020. The regression model is created using Python 3.2 tool on MacBook iOS. We are using python 3
libraries on Jupyter Notebook for the purpose of analysis. The data consists of date columns and 239 rows. There
is no null value in any of the columns. The gold price is analyzed and the skewness of data is data is 0.24, which
indicates fair level of symmetry among the variables in the data set. The kurtosis of the data is -0.995847, which
indicates that the distribution has lighter tails than the normal distribution. The data here is a flat curve than the
normal distribution. The distribution is platykurtic, with very few values near the tails and close to the mean.

                                                Figure 1: Data Information

                                                                                                                 2164
ISSN: 2233-7857IJFGCN
Copyright ⓒ2020SERSC
International Journal of Future Generation Communication and Networking
Vol. 14, No. 1, (2021), pp.2162–2168
Figure 2: Data Statistical Information
Gold Price Analysis: Additive decomposition is done for the gold price to study the trend over the given time
period and what we analyzed is that the gold price shows an upward trend with a repetitive seasonality and the
residual lies near the horizontal line and thus the data is capable of showing good predictions. We took a visual
analysis of gold prices with all the independent variables individually to study the comparative trend over time.
The gold price shows a similar trend with crude oil prices, USD to INR, Sensex, CPI whereas it shows an unsimilar
pattern with the interest rate and USD Index.
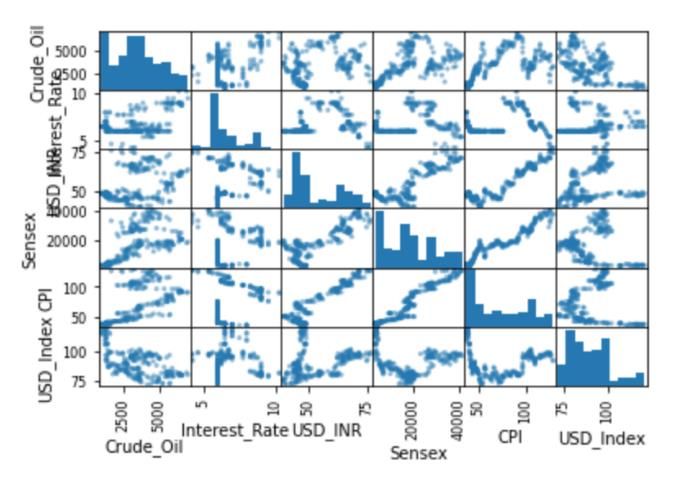
Scatter Plot: The scatter plot is plotted for all the independent variables being taken on x axis with gold price
which is a dependent variable is taken on y axis which can be seen in the graph below. The scatter plot between
the gold price and crude oil is close enough and shows a moderate positive correlation. The scatter plot between
gold price and interest rate shows a weak correlation between them and the scatter points are a bit close to each
other. The scatter plot between gold price in comparison with USD to INR, Sensex, CPI shows a strong correlation
and the scattered points are also close to each other. The scatter plot between gold price and USD Index shows a
downward trend and thus a negative correlation.
Figure 3: Scatter Plot of Independent Variables
Multiple Regression: A multiple regression model is designed where the gold price is considered as a dependent
variable and other explanatory variables are crude oil, interest rates, USD to INR, Sensex, Consumer price index
and USD index.
The Y intercept value is -2544.515336139986 and the coefficient value which signifies that how the mean of
dependent variable changes on given a one unit shift in the independent variable while holding other variables in
the model constant is Coefficients:
[1.27661583e+00-7.23404537e+02 2.89155123e+02-6.85908153e-01 6.96709372e+02 -
8.11774161e+00]
The prediction tool is used for forecasting of the dependent variables and we can see the plot of the predicted
variables below which are aligning with the original values. There is an exception in the year 2020 which is
because of the pandemic situation, the gold prices saw a certain hike.
2165
ISSN: 2233-7857IJFGCN
Copyright ⓒ2020SERSCInternational Journal of Future Generation Communication and Networking
Vol. 14, No. 1, (2021), pp.2162–2168
Figure 4: Multiple Regression Predictive Plot
A statistical model is designed to study the adjusted R squared, f test, probability f test, t test and Durbin Watson
values from the regression results. The R squared value is very close to 1 and which shows that the model is a
perfect fit. The F statistics is greater than Prob (F statistics) and thus shows support towards null hypothesis.
The Durbin Watson value is 0.231 which indicates a positive autocorrelation which is heathy for the model. The
t statistics show positive response towards crude oil, interest rate, USD to INR, Sensex and CPI and shows a
negative response towards USD Index. This shows that USD Index is not significant as an independent variable
in the model.
Residual Plot: The residual plots are created by taking the independent values on the x- axis or the horizontal axis
while the residual is taken along the y – axis.
Crude Oil to Gold Price - The plot for the data has values both above and below the horizontal axis. The pattern
shown by the points has more density below the x axis which indicates negative values. The residuals are showing
a decreasing trend indicating that the error variance decreases with the variable.
Interest Rate to Gold Price-The given dataset has more values above the axis and overall, the residuals have a
decreasing trend reflecting fall in error variance with the independent variable. The dataset also has some outliers
which are apparently visible.
Figure 5: Residual Plot of the Independent Variable with Reference to Gold Price
USD_INR, Sensex and CPI to Golf Price - The graph shows that there are a lot many outliers in the given dataset.
Since the points are randomly dispersed along the horizontal axis a linear regression model is appropriate for the
data. The variables US dollar and Sensex to gold price show a linear regression between them indicating a good
fit for linear model analysis.
2166
ISSN: 2233-7857IJFGCN
Copyright ⓒ2020SERSCInternational Journal of Future Generation Communication and Networking
Vol. 14, No. 1, (2021), pp.2162–2168
USD Index to Gold Price- The dataset has large y axis data points with very few outliers above the horizontal axis
which show that they show a poor correlation between them. The dataset also has some outliers which are
apparently visible.
We can assume that the normality in the residual is present and they are not related as they show different
characteristics on the residual plot.
Multiple collinearity: Apart from USD index, all the variables show a high correlation between each of them. A
linear combination of some of the variables is highly correlated with another variable. This was also observed
earlier from the Durbin Watson value.
Figure 6: Correlation Plot of all the values
Variance Inflation Factor: The VIF factor for the independent variable is much above 10 and thus shows multi
collinearity. As all the VIF factors are high values we can assume that they have same variance.
Crude oil-19.2, Interest Rate – 69.5, USD to INR- 716.4, Sensex-77.9 and CPI -435.1
Forecasting: Moving average is taken and the values are taken as future values for the variable for the time period
01/09/2020 to 01/12/2025. The optimum regression model is applied to these values and the predicted value of
the Gold Price can be observed form the graph below. The coefficient of determination is 0.98740 which is close
to 1 and show the goodness of fit is high. The adjusted R squared value is 0.986 which is close to 1 and the F
statistic, P (F statistic) and T test values are also favorable thus, the prediction hold good significance.
Figure 7: Forecasted Plot of the Gold Price
V. RESULT AND DISCUSSION
When we remove USD index from the model, we reach to the optimum model which has the highest adjusted R
squared value of 0.961 and also the f statistics value is much greater than the Prob (F statistics) and thus shows
null hypothesis must be rejected and our model provide a better fit than the intercept only model.
2167
ISSN: 2233-7857IJFGCN
Copyright ⓒ2020SERSCInternational Journal of Future Generation Communication and Networking
Vol. 14, No. 1, (2021), pp.2162–2168
The Durbin Watson value is 0.235 which shows a positive autocorrelation and the t test value is greater than its
probability value for all the independent variables and thus we receive the best model.
Mean squared error value for the model is 5208187.864580986 and the Coefficient of Determination value is
0.9615897843964092, which shows that MSE value is high which can be due to the high values of variables but
the coefficient of determination is very close to 1 which shows that the model has high goodness of fit. The
prediction for the time ahead which also fits as a good fit model and thus, can be considered a healthy and feasible
forecasting model
The assumptions which are to be satisfied for the models to be effective are:
1. Model Form: Linear relation between independent variables and dependent is satisfied
2. Independence of residuals: All the residuals are assumed to be not related which is partially satisfied.
3. Homoscedasticity: All the residuals are assumed to have the same variance which is not certain but the
variance values are too high and thus this is feasible.
4. Normality of residuals is present.
• The key findings are that the model is a perfect fit.
• There is a strong relation between the gold price and USD to INR, CPI and Sensex values.
• The global index values have influence on gold price without having a direct link with it.
•
VI. CONCLUSION
A prediction model is developed for the gold price in India dependent on 5 variables using the statistical
interpretations from these variables. The independent variables taken were crude oil prices, USD to INR, Sensex,
CPI and Interest rate. The model passes different aspects such as adjusted R squared, T test and Durbin Watson
with high favoring values. The model is passed as a perfect fit along with the residual analysis which depicts that
the model is a good fit and acceptable.
The data was taken for a long span of time period and there were no missing values which was favorable for the
regression model. We could observe a strong relation between the gold price and USD to INR, CPI and Sensex
values. In future, more variables can be a part of this model and the data can be for a longer time span leading to
the other heights of optimality. The objective to create a prediction model for fundamental investors to get better
retains is fulfilled as the model provides a fit model. This study explains how global figures analysis can help in
local based investments which are preferable by the people and also highlights the importance of global figures
on local grounds.
REFERENCES
[1] Forecast Model for Price of Gold: Multiple Linear Regression with Principal Component Analysis Jyothi Manoj*[a] and
Suresh K K [b]
[2] Graham, S., 2001. The price of gold and stock price indices for the United States.
[3] Gülden Kaya Uyanik , Nese Güler. A study on multiple linear regression analysis
[4] Ismail Z, Yahay A, Shabri A. Forecasting gold prices using multiple linear regression method. Am J Appl. Sci. 2009; DOI:
10.3844/ajassp.1509.1514.
[5] Kutsurelis, J.E., 1998. Forecasting financial markets using neural networks: An analysis of methods and accuracy. Master
Thesis, Naval Postgraduate School.
[6] Toraman C, Basarir C, Bayramoglu MF. Determination of factors affecting the price of gold: a study of MGARCH model.
Bus Econ Res J. 2011; 2: 1309-2448
[7] Adebiyi, Ayodele & Adewumi, Aderemi & Ayo, Charles. (2014). Stock price prediction using the ARIMA model.
Proceedings - UKSim-AMSS 16th International Conference on Computer Modelling and Simulation, UKSim 2014.
10.1109/UKSim.2014.67.
[8] Weng, F., Chen, Y., Wang, Z. et al. Gold price forecasting research based on an improved online extreme learning machine
algorithm. J Ambient Intell Human Comput 11, 4101–4111 (2020)
[9] Guha, Banhi & Bandyopadhyay, Gautam. (2016). Gold Price Forecasting Using ARIMA Model. Journal of advance
Management Journal. 10.12720/joams.4.2.117-121
[10] Hassani, Hossein & Silva, Emmanuel & Gupta, Rangan & Segnon, Mawuli. (2015). Forecasting the price of gold. Applied
Economics. 47. 10.1080/00036846.2015.1026580.
[11] World Bank Official Webiste - data.worldbank.org
2168
ISSN: 2233-7857IJFGCN
Copyright ⓒ2020SERSCYou can also read