Harness the power of technical analysis - nabtrade charting tools and research can give traders and long-term investors valuable insights on share ...
←
→
Page content transcription
If your browser does not render page correctly, please read the page content below
nabtrade.com.au

Harness the power
of technical analysis
nabtrade charting tools and research can give traders and long-term
investors valuable insights on share price movements.

Brought to you by Switzer Super Report
1                  Understanding
                       technical analysis

Consider how two people approach
buying a car. The first carefully
researches their favoured car and
compares it to similar models. They
read car reviews, talk to family and
friends, take a test drive and decide
if the car is a good investment.

The second stands outside the
car dealership and looks for the
best-selling cars. If demand for a
model is rising, chances are its price
will increase and the secondhand
market will be strong. If demand is
weak, the car dealer might have to
lower the price.

2   Harness the power of technical analysis
Understanding technical analysis
What is technical analysis? That is no longer the case. Today, more investors and
The above analogy is a bit like fundamental and technical traders are combining fundamental and technical
share analysis. Fundamental analysis involves researching a analysis to make better investment decisions. They use
company’s financial statements, industry, competitors and fundamental analysis to decide what to buy and sell, and
many other factors. The aim is to forecast the company’s technical analysis to decide when to buy and sell.
earnings and determine its intrinsic or true value.
Technical analysts use charts and other tools to identify
patterns and understand price direction. Using market data,
such as price and volume, they believe a security’s past The Tool tips throughout will help you use the
performance is a guide to its future performance and that nabtrade website.
price is the best signal. Similar to the car example, the technical
Quick tips provide helpful information about
analyst is not trying to value the security or make decisions
online investing.
based on published information. Instead, they rely on market
action to determine which securities to buy and sell.
For many years, fundamental and technical analysis were
seen as polar opposites. Fundamental analysis, used by the
majority of investors, said past price performance was no
guide to future performance. Technical analysts believed
the most reliable information was market price and their
style was seen as the fringe of mainstream investing.
Tool tip
nabtrade’s powerful Global Scanner tool lets
you filter securities based on criteria you’re
looking for including both fundamental and
technical options.
Access Global Scanner by logging into nabtrade
-> hover over Insight Centre -> under Tools &
Scanners, select Global Scanner
3 Harness the power of technical analysisUnderstanding technical analysis
What is charting?
Tool tip
The chart below, of Telstra Corporation over five years, If you have not used technical
is an example of charting. The blue line shows Telstra’s analysis before, consider using
nabtrade’s charting tools to gain
price and the black line is a trendline. The price chart was
a different perspective through the
created through nabtrade and one of its charting tools
analysis of a security’s price
was used to draw the trendline.
and volume. Interactive Charts are
Of course, many investors prefer fundamental analysis easy to access and can be done
over technical analysis, or vice versa. Or they believe by logging in -> selecting a
technical analysis is too complicated; that it requires company -> clicking on
expensive software and data subscriptions, and is only the Charts.
something for day-traders or sharemarket speculators.
Through nabtrade’s research- and tool-rich online broking
platform, investors can use technical analysis tools that
were once mostly the preserve of professional investors. portfolio investors, such as self-managed superannuation
These powerful tools are simple to use and a valuable fund (SMSF) trustees, can use it to identify key turning
resource for chartists or fundamental investors who want points in stocks or other securities, or as a tool to protect
to combine some basic charting techniques with their their capital before or during a market correction.
company research. Charting can be as complex as you
The point is, charting comes in all shapes and sizes and
want it to be: nabtrade’s charting tools range from basic
suits many types of investors and traders. If you have not
indicators, such as drawing trendlines on charts, to more
used technical analysis before, consider using nabtrade’s
complex charting techniques such as Bollinger Bands, a
charting tools to gain a different perspective through the
Relative Strength Index, or Candlestick charts.
analysis of a security’s price and volume.
Charting is not only a trading technique. Long-term
Chart 1: Telstra Corporation
5 year price performance (AUD)
Source: nabtrade. For illustrative purposes only.
4 Harness the power of technical analysis2 Basics of
technical analysis
Although it looks easy, charting, like most investment 1. Momentum trading
techniques, requires education and experience. Making Momentum trading involves buying or selling stocks that
investments based on a quick glance of a share price chart are moving strongly in one direction, usually on high
is dangerous, just as relying on “hot stock tips” is a poor volume. The investment adage, “the trend is your friend”,
form of fundamental analysis. neatly captures the essence of momentum trading: look
for stocks making higher price highs and higher lows.
Rather than attempting to identify complex share
price patterns, start with three basic charting-related In some ways, momentum trading goes against the instincts
techniques: of an investor who uses fundamental analysis. A momentum
trader will buy rising stocks and sell falling ones. A
• Momentum trading
fundamental analyst might sell stocks after they have risen
• Stop-loss orders (because they look expensive) and buy stocks after they
have fallen (because they look cheap). The momentum
• Price support and resistance
trader prefers to let the trend dictate their strategy.
points on charts.
Consider the chart below of Flight Centre over five years.
Chart 2: Flight Centre
5 year price performance (AUD)
Source: nabtrade. For illustrative purposes only.
5 Harness the power of technical analysisBasics of technical analysis
The first black trendline on the chart, from mid-2012,
shows Flight Centre in a strong price uptrend. A
momentum trader might have used the chart to identify
Tool tip
With nabtrade, you can
a price breakout, when Flight Centre stopped moving
access Trading Central’s latest
sideways and started to head higher, and held it all the
technical analysis reports
way through its uptrend to above $50.
on a particular company by
In early 2014 the uptrend lost steam and Flight Centre typing in the stock code and
formed what chartists refer to as a “double top reversal selecting Trading Central in
pattern” (a bearish sign made up of two consecutive price the Research tab.
peaks). A momentum trader might have identified that as
a turning point for Flight Centre and sold all or some of
their shares.
By late 2014 Flight Centre was trending higher again.
Momentum traders will watch whether Flight Centre can
break price resistance around the mid-$40 mark and make
Woolworths has been a great company for a long time.
new highs, or if the uptrend fails and the price downtrend
The first trendline, starting in early 2011 shows strong
returns.
price gains to 2014. But then Woolworths moved
Momentum trading techniques also help long-term sideways, broke price support (shown by the horizontal
portfolio investors. Although they are not “trading the black line) and started a downtrend.
trend”, they can use these techniques to buy stocks when
A SMSF trustee who bought Woolworths based on
they are rising and protect their capital by selling stocks
fundamental analysis could have used this charting
when they break long-term uptrends and head lower.
technique to take some profits around $35 a share,
The chart below of Woolworths over five years shows how reinvest in another stock in an uptrend or keep that money
long-term uptrends can become downtrends and destroy in cash, to buy Woolworths again at lower prices, when its
capital for those who have to sell. price turns higher.
Chart 3: Woolworths
5 year price performance (AUD)
Source: nabtrade. For illustrative purposes only.
6 Harness the power of technical analysisBasics of technical analysis
2. Using stop-loss orders There is no hard or fast rule for what level to set a stop-
The Woolworths chart on the previous page shows the loss at, and it depends on the share price volatility of
importance of setting stop-loss orders. A stop-loss order the particular stock. A 2% stop-loss wouldn’t work for a
is a predetermined price point at which a chartist sells a company that fluctuated by more than 10% in a week,
stock to limit their loss and protect capital. and a 10% stop-loss order wouldn’t work for a blue chip
company like Telstra.
There are many stop-loss techniques. A chartist who buys
a stock at $1 might set the stop-loss order at 90 cents. Stop-loss orders require discipline and a willingness to take
If it drops 10%, the chartist sells out and cuts their losses. a small loss. All too often, investors watch small losses
If the stock moves higher, the chartist lifts their trailing become large ones or they try to buy more shares on the
stop-loss order. When the stock rises to $2, the stop-loss way down, believing a stock is cheap and forgetting that
order is $1.80. In this way, the chartist locks in most of price downtrends sometimes take years to unfold. They fall
their capital gains. for that great bear trap of “trying to catch a falling knife”.
An ability to protect capital is arguably the key trait of
high-performing investors and traders. Effectively used,
a stop-loss order can help SMSF trustees better protect
their retirement savings and minimise the damage of a
big capital loss from a key stock in their fund.
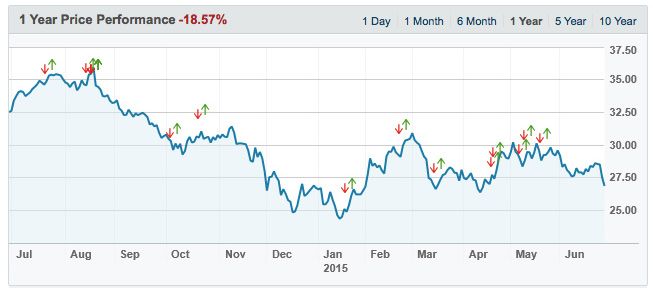
The chart below, of Telstra over the past 12 months shows
the benefits of setting stop-loss orders.
Tool tip
Stop-losses on nabtrade can be
Lets consider a chartist who bought Telstra in July 2014. performed through IRESS Trader
If they had set a trailing stop-loss level of 2% - ie they were or IRESS mobile. Visit nabtrade.
prepared to take a loss of 2% in the share price, they would com.au for more information.
have been sold out of the share when it dropped from
$6.46 to $6.31 on 26 February 2015. They would have still
reaped the benefits of Telstra’s rise up from around $5.20
in June 2014, but not suffered the subsequent fall.
Chart 4: Telstra
1 year price performance (AUD)
Source: nabtrade. For illustrative purposes only.
7 Harness the power of technical analysisBasics of technical analysis
3. Price support and resistance
The third benefit of technical analysis discussed here,
identifying price support and resistance levels, is related
$81
price resistance
to the earlier concepts around momentum trading and
stop-loss orders.
One way to think about price support and resistance
points on charts is as an intersection of where demand
and supply for a stock meet.
Support is the point on the chart where buyer demand
is thought to be strong enough to stop the price falling
further. Resistance is the point where selling is strong
$55
enough to prevent the price rising further.
Ever noticed how a stock will bounce higher every time
it hits a certain price support, or fall when it hits a price
resistance, as it seemingly bounces between a price floor
and ceiling? That is support and resistance in action, and
a share
a useful guide of market psychology or how buyers and
sellers view a stock.
The chart below, of Macquarie Group over one year, shows
the concept of price support and resistance.
around $81. When Macquarie hits that level, sellers move
The first horizontal black trendline shows price support for
in, presumably because they believe it is overvalued,
Macquarie around $55 a share. Each time it hits that levels,
and Macquarie struggles to break price resistance.
buyers move in, presumably because they think Macquarie
Technical analysts would watch this chart closely to see
is undervalued at that level.
if Macquarie’s uptrend is failing, or simply consolidating
The second horizontal trend line shows price resistance before the next move higher.
Chart 5: Macquarie Group
1 year price performance (AUD)
Source: nabtrade. For illustrative purposes only.
8 Harness the power of technical analysisBasics of technical analysis
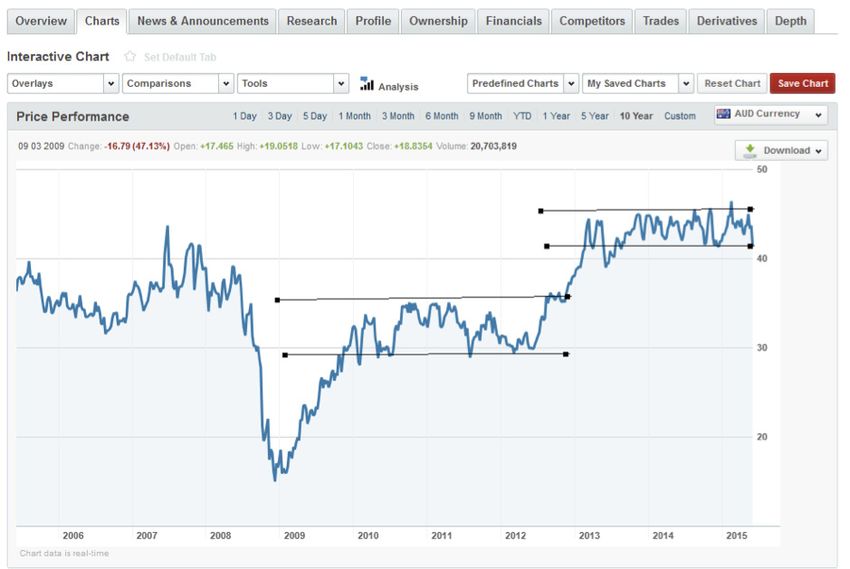
Price support and resistance levels can also be used on When Wesfarmers finally breaks that price resistance, it
long-term charts. The chart below of Wesfarmers over 10 moves above $40 in early 2013 and the next channel of
years illustrates this concept. price support and resistance emerges.
Note the price support for Wesfarmers just below $30
between 2010 and 2012 and price resistance around $35.
Chart 6: Wesfarmers
10 year price performance (AUD)
Source: nabtrade. For illustrative purposes only.
$30
price support
$35
price resistance
$40per share
2010 - 2012 2012 2013
9 Harness the power of technical analysisBasics of technical analysis
Tool tip
Take advantage of nabtrade charting tools Or go a step further: use nabtrade to source
The above charts use only one feature of nabtrade’s fundamental information, such as companies with a
charting tools: trendlines. More advanced chartists price-earnings (PE) multiple below 12 & a dividend yield
could use a range of other price indicators or different above 5%. Read nabtrade research reports, consider the
type of charts, such as Candlestick charts, which use recommendation and apply the charting tools.
rectangles to show the price high and for a period, and
You might find a stock that looks like a good
different colours to show up or down days in price.
investment based on fundamental analysis, and has
These charting tools are easy to access in nabtrade: a favourable chart pattern: for example, its price is
type in the company’s security code and click Charts. making higher highs and lower lows, and is in a clear
uptrend on reasonable volume.
From there, set the time period for the chart, choose
your preferred charting style, and price and volume
indicators that best suit your analysis. It’s that easy.
Source: nabtrade. For illustrative purposes only.
10 Harness the power of technical analysis3 Next steps for
technical analysis
Charting patterns can be hard to identify, look different Those seeking more formal education can consider
depending on the timeframe, and change quickly. There enrolling in Kaplan Professional’s technical analysis
is no guarantee that a price pattern will continue: the key subjects and obtaining a Diploma of Technical Analysis, for
is being able to respond to market action in a stock, not ATAA members. The International Federation of Technical
trying to predict it. Analysts (IFTA) recognises holders of that qualification as a
Certified Financial Technician (CFTe).
nabtrade has partnered with leading technical analysis
provider Trading Central, which provides short and Once you understand charting basics, consider registering
medium term recommendations on thousands of ASX- for the ASX public sharemarket game. As one of the
listed and international securities, and also indices, world’s great simulated sharemarket trading games,
currencies, commodities and bonds. the ASX Sharemarket Game lets you test your charting
strategies in real-time sharemaket conditions, without
Trading Central combines:
risking your capital. Treat the 15-week game as a key part
• a chartist approach to assess directional moves and
of your introduction to charting.
price targets
• mathematical indicators to confirm initial thoughts and Finally, use nabtrade charts to assess each stock in your
fine tune timings portfolio. There is no better way to learn about charting
• Japanese candlesticks to confirm trend reversal or – or the sharemarket generally – than through stocks
acceleration you own. Use nabtrade’s watchlist tool to build a list of
potential stocks to buy, and apply your favourite charting.
• To access Trading Central’s research reports, log-in to
nabtrade, select a stock, go to the Research tab and Link library
select Trading Central. http://www.ataa.com.au/
http://www.asx.com.au/prices/charting-library.htm
The Australian Technical Analysts Association (ATTA) is
http://www.kaplanprofessional.edu.au/fin231-
also a great place to learn more about charting. This not-
technical-analysis/
for-profit organisation provides useful charting articles
http://www.asx.com.au/education/sharemarket-
and links, and hosts events to help promote the correct
games.htm
use of technical analysis.
Important information
The Australian Securities Exchange’s online charting
The information in this document has been prepared without taking into
library can help new chartists navigate through a sea of account your objectives, financial circumstances, or needs. You should
consider the appropriateness of the information with regard to your
technical analysis jargon. This comprehensive library has objectives, financial circumstances or needs before acting on it. Where
free information on the main patterns, chart formations the information relates to a financial product, you should consider the
relevant Product Disclosure Statement or disclosure documents available at
and technical indicators. nabtrade.com.au.
This analysis is for educational purposes only. It does not imply stock
There are many good books on charting from well-known recommendations. All charts are sourced through nabtrade. All trendlines
were drawn using nabtrade charting software. All prices are to June 4, 2015.
Australian authors and traders, such as Colin Nicholson, nabtrade recommends investors do further research of their own or seek
professional advice before acting on themes or ideas in this article.
Daryl Guppy and Alan Hull. Nicholson’s book, Building
The nabtrade service (nabtrade) is the information, trading and settlement
Wealth Through Shares, shows how to combine technical service provided by WealthHub Securities Limited ABN 83 089 718 249 AFSL
No. 230704 (WealthHub Securities), a Market Participant under the ASIC
and fundamental analysis, and is popular with those new Market Integrity Rules and a wholly owned subsidiary of National Australia
to charting. Bank Limited ABN 12 004 044 937 AFSL 230686 (NAB).
11 Harness the power of technical analysis
© 2015 National Australia Bank Limited ABN 12 004 044 937 AFSL and Australian Credit Licence 230686 (NAB) A116656-0715You can also read