Estimating and adjusting for ancestry admixture in statistical methods for relatedness inference, heritability estimation, and association testing
←
→
Page content transcription
If your browser does not render page correctly, please read the page content below
Thornton et al. BMC Proceedings 2014, 8(Suppl 1):S5
http://www.biomedcentral.com/1753-6561/8/S1/S5

 PROCEEDINGS                                                                                                                                Open Access

Estimating and adjusting for ancestry admixture
in statistical methods for relatedness inference,
heritability estimation, and association testing
Timothy Thornton1*, Matthew P Conomos1, Serge Sverdlov2, Elizabeth M Blue3, Charles YK Cheung1,
Christopher G Glazner2, Steven M Lewis2, Ellen M Wijsman1,3
From Genetic Analysis Workshop 18
Stevenson, WA, USA. 13-17 October 2012

  Abstract
  It is well known that genetic association studies are not robust to population stratification. Two widely used
  approaches for the detection and correction of population structure are principal component analysis and model-
  based estimation of ancestry. These methods have been shown to give reliable inference on population structure
  in unrelated samples. We evaluated these two approaches in Mexican American pedigrees provided by the Genetic
  Analysis Workshop 18. We also estimated identity-by-descent sharing probabilities and kinship coefficients, with
  adjustment for ancestry admixture, to confirm documented pedigree relationships as well as to identify cryptic
  relatedness in the sample. We also estimated the heritability of the first simulated replicate of diastolic blood
  pressure (DBP). Finally, we performed an association analysis with simulated DBP, comparing the performance of an
  association method that corrects for population structure but does not account for relatedness to a method that
  adjusts for both population and pedigree structure. Analyses with simulated DBP were performed with knowledge
  of the underlying trait model.

Background                                                                          method ADMIXTURE in Mexican American pedigrees
Principal component analysis (PCA) and model-based esti-                            provided by the Genetic Analysis Workshop 18 (GAW18).
mation of ancestry are two widely used approaches for the                           We also estimate the heritability of the first simulated
detection and correction of population structure in                                 replicate of diastolic blood pressure based (DBP), and we
admixed populations. The top principal components (PCs)                             compare heritability estimates calculated using pedigree-
from PCA can be used as covariates in a generalized linear                          based kinship coefficients versus empirical kinship
model to protect against confounding resulting from                                 coefficients that are estimated from single-nucleotide
population stratification in genetic association studies [1].                       polymorphism (SNP) genotype data. We also perform an
Individual ancestry estimates from widely used software                             association analysis with SNP genotype data and the first
programs, such as STRUCTURE [2], FRAPPE [3], and                                    simulated replicate of DBP. Then we compare the
ADMIXTURE [4], can also be used for population                                      EMMAX association method [5], which is a linear mixed-
stratification inference and correction. PCA and individual                         model approach that accounts for pedigree and population
ancestry estimation methods have been shown to give                                 structure, with an association analysis using the PLINK
reliable inference for ancestry in admixed samples with                             software [6], where the top 10 PCs from a PCA are
unrelated individuals. We evaluate the performance of                               included as covariates in a linear regression analysis to
PCA and the model-based individual ancestry estimation                              account for population structure.

* Correspondence: tathornt@u.washington.edu
1
 Department of Biostatistics, University of Washington, Seattle, WA 98195,
USA
Full list of author information is available at the end of the article
                                        © 2014 Thornton et al.; licensee BioMed Central Ltd. This is an Open Access article distributed under the terms of the Creative
                                        Commons Attribution License (http://creativecommons.org/licenses/by/2.0), which permits unrestricted use, distribution, and
                                        reproduction in any medium, provided the original work is properly cited. The Creative Commons Public Domain Dedication waiver
                                        (http://creativecommons.org/publicdomain/zero/1.0/) applies to the data made available in this article, unless otherwise stated.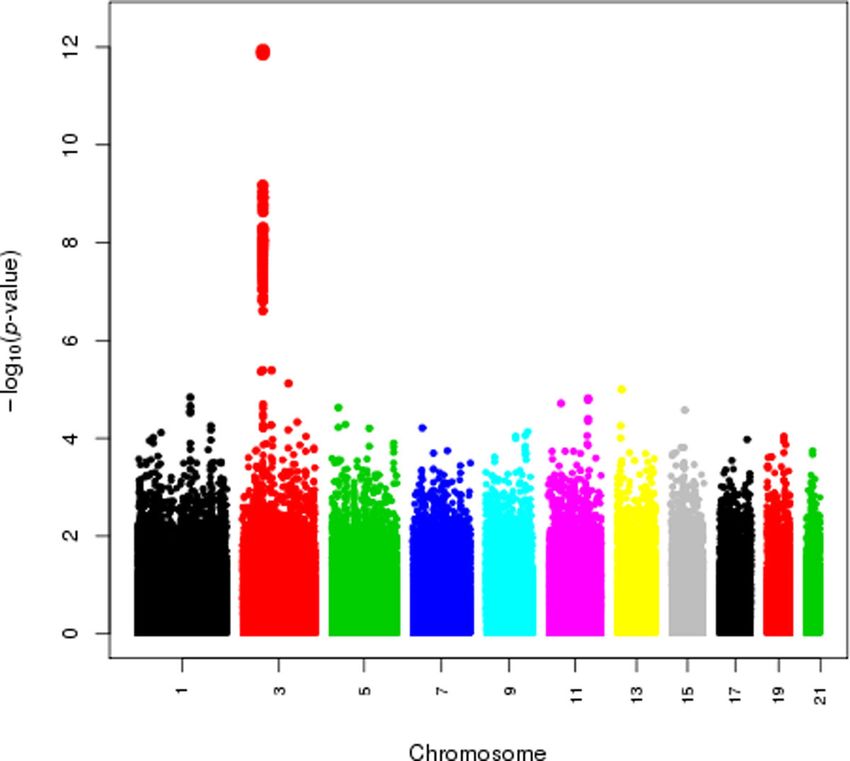
Thornton et al. BMC Proceedings 2014, 8(Suppl 1):S5                                                              Page 2 of 7
http://www.biomedcentral.com/1753-6561/8/S1/S5

Methods                                                        individuals in the GAW18 sample with the REAP (related-
Individual ancestry estimation                                 ness estimation in admixed populations) method [10].
We performed both supervised and unsupervised struc-           REAP gives robust IBD sharing probability and kinship
ture analyses for the GAW18 sample using the ADMIX-            coefficient estimates in admixed populations by using
TURE software. For the supervised structured analysis,         individual-specific allele frequencies that are calculated by
proportional European, African, Native American, and           conditioning on estimated genome-wide ancestry. The
East Asian ancestry was estimated using SNP genotype           REAP relatedness estimates were calculated using the
data for the odd-numbered chromosomes. There are               ADMIXTURE-estimated individual ancestry proportions
955 individuals in GAW18 who have available genotype           and ancestral population allele frequencies from the
data. We set the number of ancestral populations to 4 in       supervised ancestry analysis, and with the 242,566
the ADMIXTURE analysis, where the CEU and YRI                  overlapping SNPs in the HapMap, HGDP, and GAW18
samples of release 3 of phase III of the International         samples (discussed earlier).
Haplotype Map Project (HapMap) [7] were used as sur-
rogates for European and African ancestry, respectively,       Association testing with simulated diastolic blood
and the Human Genome Diversity Project (HGDP) [8]              pressure phenotype
samples from the Americas and East Asia were used for          We performed an association analysis with the first simu-
Native American and East Asian ancestry. The surrogate         lated replicate of DBP and SNPs that were genotyped on
HGDP sample for Native American ancestry includes 8            the odd-numbered chromosomes. We used the first time
Surui, 22 Maya, 13 Karitiana, 14 Pima, and 6 Colombian         point for DBP and adjusted the DBP phenotype for age,
individuals. We used 242,566 autosomal SNPs that were          sex, and current use of antihypertensive medications. The
genotyped in all three data sets (HapMap, HGDP, and            PLINK software was used to perform a linear regression
GAW18) for the supervised analysis. The unsupervised           association analysis, where the top 10 PCs, calculated from
analysis with ADMIXTURE was similar to the supervised          the EIGENSOFT software [1], were used as covariates in
analysis except that the reference HapMap and HGDP             the linear regression model to adjust for population
samples were not included in the ancestry analysis.            structure in the sample. Note that the association analysis
                                                               conducted with PLINK corrects for population structure
Principal component analysis with pedigrees                    but does not account for relatedness in the sample. We
PCA has been shown to account for population stratifica-       also performed an association analysis using the EMMAX
tion in samples with unrelated individuals. In samples         method. EMMAX is a linear mixed-model approach that
with related individuals, however, the top PCs from            uses an empirical covariance matrix, estimated using
standard PCA (sPCA) may not adequately account for             genome-screen data, to account for both pedigree and
population structure because of the complicated covar-         population structure.
iance structure of the genotypes among relatives. For
genetic studies that contain nuclear families, Zhu et al [9]   Heritability estimation of simulated diastolic blood
proposed a method for obtaining ancestry-informative           pressure phenotype
PCs by first performing sPCA on the genotyped parents in       There were 845 individuals in GAW18 for whom both
the pedigrees and then using SNP weights from the PCA          SNP genotype data and phenotype information were
on the parents to obtain PCs for offspring. We extended        available for simulated DBP, and we computed esti-
the Zhu et al approach to general pedigrees by (a)             mates of heritability using these sample individuals.
selecting a set of genetically unrelated individuals and       Heritability estimates were calculated using a pedigree-
performing PCA on this unrelated set and (b) using the         based kinship coefficient matrix, an empirical matrix
SNP weights from the unrelated set to obtain PCs for all       with REAP-estimated kinship coefficients, and a hybrid
remaining individuals in the sample. We name this              matrix of the two. The hybrid matrix uses REAP esti-
approach R-PCA, where R indicates that this PCA method         mated kinship coefficients only for pairs of individuals
accounts for relatedness in the sample. We apply both          who are related according to the available pedigree infor-
sPCA and R-PCA to the GAW18 sample using 100,000               mation. Individuals who are not related based on the
SNPs that were selected at random, without replacement,        pedigrees have a kinship coefficient value of 0 in the
from the set of genotyped SNPs on the odd-numbered             hybrid matrix, which corresponds to the same kinship
chromosomes.                                                   coefficient value for the unrelated pairs in the pedigree-
                                                               based kinship coefficient matrix. We implemented a
Relatedness estimation in GAW18                                restricted maximum likelihood estimation procedure to
Kinship coefficients and identity-by-descent (IBD) sharing     compute the variance components for heritability
probabilities were estimated for all pairs of genotyped        estimation.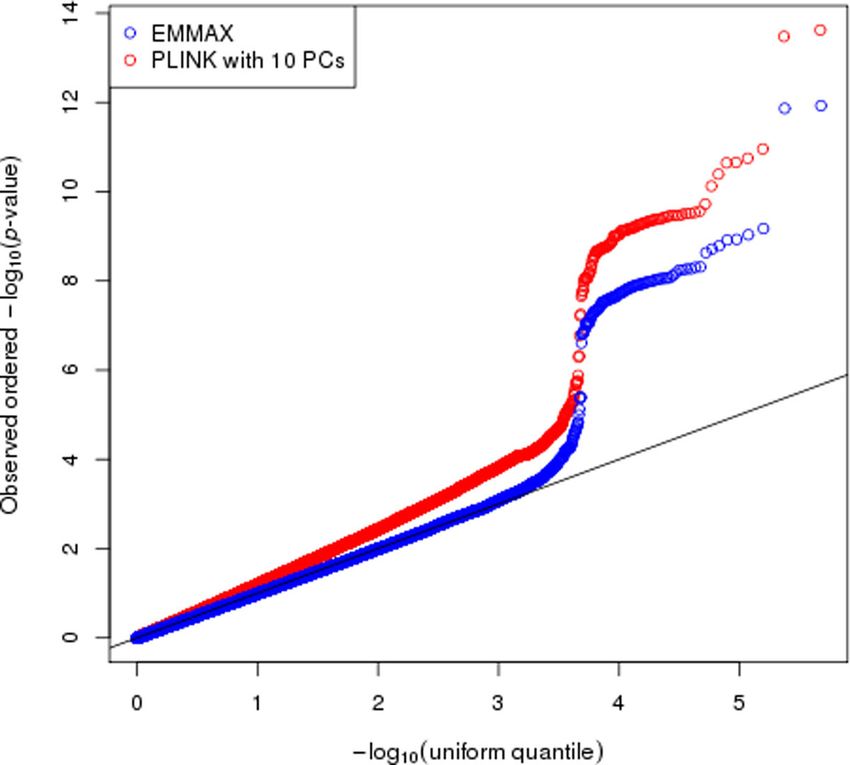
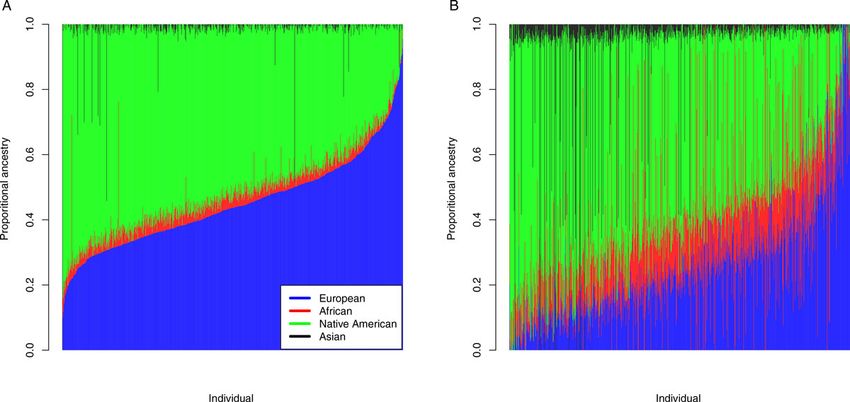
Thornton et al. BMC Proceedings 2014, 8(Suppl 1):S5                                                                                   Page 3 of 7
http://www.biomedcentral.com/1753-6561/8/S1/S5

Results                                                                    quite variable; proportional European ancestry ranges
Individual ancestry estimation                                             from 0% to 95.5%, with a mean and SD of 44.9% and
Figure 1 presents bar plots of individual ancestry                         14.0%, respectively, and proportional Native American
estimates for the supervised and unsupervised ancestry                     ancestry ranges from 0% to 83.9%, with a mean and SD
analysis from the ADMIXTURE software. Figure 1A                            of 50.3% and 13.9%, respectively.
shows the results for the supervised ADMIXTURE analy-                         Figure 1B presents a bar plot of the results from the
sis in which the HapMap CEU and YRI samples and the                        unsupervised ADMIXTURE analysis, where the order of
HGDP Native American and East Asian samples were                           the GAW18 individuals is the same as in Figure 1A.
included in the analysis as fixed groups; proportional                     Comparing Figures 1A and 1B, we see that the unsuper-
ancestry was estimated for the 955 GAW18 individuals                       vised individual ancestry proportions are much more
with available SNP genotype data. In the bar plot of the                   variable than the supervised analysis. One of the ancestry
supervised ADMIXTURE ancestry estimates (Figure 1A),                       components in the unsupervised analysis reflects pedigree
individuals are represented by vertical bars, and the                      membership in family 5. A number of individuals in this
GAW18 individuals in this figure are arranged in increas-                  family have estimated proportional ancestry that is greater
ing order (left to right) of genome-wide European                          than 99% for this component and 64 of the 68 genotyped
ancestry proportion. On average, there is modest African                   individuals in this family have the highest estimated
and East Asian ancestry in the GAW18 sample, where                         proportions for this component. Another ancestry
the average proportional African ancestry is 3.6% with an                  component is heavily influenced by families 4 and 6 in the
SD of 2.9%, and the average proportional East Asian                        unsupervised analysis, where the highest 114 proportions
ancestry is 1.2% with an SD of 4.8%. Three individuals                     for this component are from these two families.
have high proportional East Asian ancestry, where one                         The individual ancestry results with ADMIXTURE
individual is 100% East Asian and two admixed indivi-                      illustrate that (a) an unsupervised analysis may not give
duals have ADMIXTURE-estimated East Asian ancestry                         appropriate proportional ancestry estimates in samples
proportions of 48.5% and 54.3%. Two individuals have                       with related individuals and (b) a supervised ancestry
high African ancestry, with estimated proportional                         analysis can give reliable individual ancestry estimates in
ancestry of 44.5% and 50.4% from Africa. Most of the                       related samples with ancestry admixture, as was previously
GAW18 ancestry is European and Native American.                            demonstrated in an analysis of admixed population
Proportional European and Native American ancestry is                      samples with relatedness [10].

 Figure 1 Individual ancestry analysis. Bar plots of individual-ancestry estimates from a supervised and an unsupervised structure analysis,
 respectively, with the ADMIXTURE software program for 955 genotyped Genetic Analysis Workshop 18 (GAW18) individuals. A) GAW18-
 supervised individual ancestry analysis. B) GAW18-unsupervised individual ancestry analysis. Each individual is represented by a vertical bar in
 A and B. The 4 ancestral populations in B that are inferred by ADMIXTURE in the unsupervised analysis are represented by the colors blue, red,
 green, and black. The order of the individuals is the same for A and B.
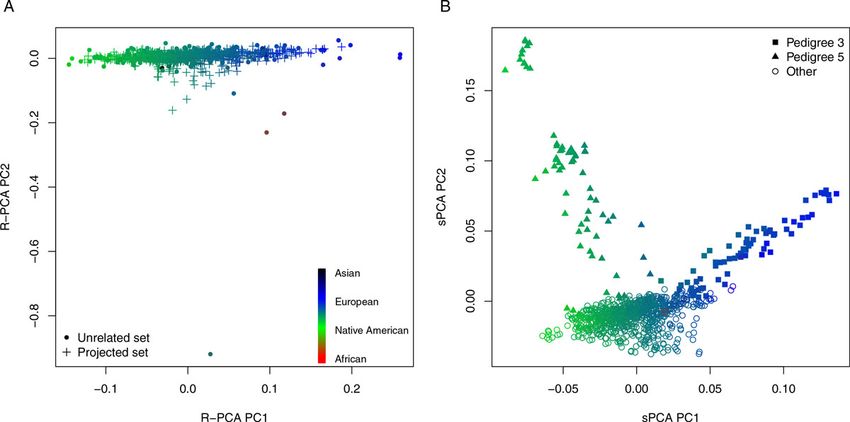
Thornton et al. BMC Proceedings 2014, 8(Suppl 1):S5                                                                            Page 4 of 7
http://www.biomedcentral.com/1753-6561/8/S1/S5

Principal components analysis with pedigrees                           5 drives PC 2. In contrast, Figure 2A illustrates that the
We find that the top PC from R-PCA is highly correlated                top two PCs from R-PCA reflect ancestry and not
with the Native American ancestry component from the                   pedigree structure.
supervised ADMIXTURE analysis discussed in the
previous subsection; the linear regression model for                   Relatedness estimation in GAW18
predicting Native American ancestry from the top PC has                The vast majority of the REAP estimated kinship coeffi-
an r 2 = 0.92 (i.e., 92% of the ADMIXTURE-estimated                    cients are consistent with the known pedigree relation-
proportional Native American ancestry is explained by the              ships. There are, however, some cryptically related
top PC from R-PCA). The top PC for sPCA, however,                      individuals from different families who were identified
does not capture Native American ancestry as well as                   with REAP. Table 1 gives 14 REAP-inferred relative pairs
R-PCA, with an r2 value of 0.82. Using the top 10 PCs                  linking families 5 and 6, families 7 and 10, and families 21
from sPCA as predictors in a linear regression model                   and 25.
with Native American ancestry as the response yields an
r 2 = 0.86. The top 32 PCs from sPCA are needed as                     Association testing with simulated diastolic blood
predictors in the regression model to match the propor-                pressure phenotype
tional variance explained for Native American ancestry                 Figure 3 displays quantile-quantile (Q-Q) plots for the
by the first PC from R-PCA. Proportional European                      PLINK and EMMAX association analyses of the first
ancestry explained by the top PC from R-PCA and PCs                    simulated replicate of DBP. From this figure, one can see
from sPCA are similar to the results for the Native                    that PLINK is not properly calibrated, and the p-values are
American ancestry component because these two                          systematically inflated for the expected null p-values that
ancestry components are almost perfectly negatively                    are less than 0.01. The genomic control inflation factor
correlated. The top 10 PCs from R-PCA have r2 values                   [11], l, for the PLINK association analysis is 1.3. In con-
of 0.74 and 0.69 for explaining proportional East Asian                trast, l = 0.97 with EMMAX, indicating that the method
and African ancestry, respectively. In contrast, the top               is slightly conservative for the association analysis of the
10 PCs from sPCA have r 2 values of 0.012 and 0.097,                   first simulated replicate of DBP. Most of the EMMAX
respectively, for East Asian and African proportional                  p-values fall directly on or very close to the 45-degree line
ancestry. Figure 2 displays scatter plots of the top 2 PCs             in the Q-Q plot until approximately p = 0.001. The large
from R-PCA and sPCA. Figure 2B illustrates that the                    increase in the -log(p-values) after this point corresponds
top 2 PCs from sPCA largely reflect family structure,                  to functional variants for the simulated DBP phenotype.
where PC 1 is heavily influenced by family 3, and family               Figure 4 is a Manhattan plot of the EMMAX p-values for

 Figure 2 Principal components analysis. The top two principal components from R-PCA (A) and sPCA (B) are plotted against each other. The
 color of each point in the figures corresponds to an individual’s ADMIXTURE-estimated ancestry.
Thornton et al. BMC Proceedings 2014, 8(Suppl 1):S5                                                                                            Page 5 of 7
http://www.biomedcentral.com/1753-6561/8/S1/S5

Table 1 REAP-inferred close relative pairs from different families
                Individual 1                                      Individual 2
Family number        Identification number        Family number        Identification number       REAP kinship coefficient   REAP IBD = 0 probability
        5                 T2DG0500371                     6                 T2DG0600393                        0.05                     0.76
        5                 T2DG0500380                     6                 T2DG0600393                        0.03                     0.85
        5                 T2DG0500389                     6                 T2DG0600393                        0.04                     0.82
        7                 T2DG0701151                    10                 T2DG1000614                        0.05                     0.82
        7                 T2DG0701151                    10                 T2DG1000615                        0.04                     0.87
        7                 T2DG0701151                    10                 T2DG1000616                        0.04                     0.82
         7                T2DG0701151                    10                 T2DG1000639                        0.03                     0.86
        21                2DG2100948                     25                 T2DG2501033                        0.05                     0.76
        21                T2DG2100951                    25                 T2DG2501033                        0.05                     0.78
        21                T2DG2100961                    25                 T2DG2501033                        0.04                     0.84
        21                T2DG2100962                    25                 T2DG2501033                        0.03                     0.86
        21                T2DG2100978                    25                 T2DG2501033                        0.03                     0.87
        21                T2DG2100972                    25                 T2DG2501033                        0.03                     0.85
        21                T2DG2100973                    25                 T2DG2501033                        0.03                     0.84
The following abbreviations are used: IBD, identity by descent; REAP, relatedness estimation in admixed populations.

                                                                                   Heritability estimation of simulated diastolic blood
                                                                                   pressure phenotype
                                                                                   Heritability estimates of the first simulated replicate of
                                                                                   DPB are remarkably close when using a pedigree-based
                                                                                   kinship coefficient matrix, a REAP-estimated kinship
                                                                                   coefficient matrix, and a hybrid of the two in the var-
                                                                                   iance components analysis, where the corresponding
                                                                                   heritability estimates (and 95% confidence interval) are
                                                                                   34.3% (21.7%-54.2%), 30.2% (18.3%-50.0%), and 33.1%
                                                                                   (20.5%-53.4%), respectively. Estimation of heritability
                                                                                   from variance components of pedigrees can lead to
                                                                                   inflated heritability estimates resulting from confounding
                                                                                   of shared environment of relatives. Recent work has
                                                                                   been proposed to address this issue in GWAS samples
                                                                                   by excluding relatives from a large-scale population
                                                                                   study with empirical kinship coefficients that are greater
                                                                                   than a specified threshold [12].

  Figure 3 Quantile-quantile (Q-Q) plot for EMMAX and PLINK                        Conclusions
  association analysis with simulated diastolic blood pressure
                                                                                   Supervised individual ancestry analyses can give reliable
  (DBP). Q-Q plots of p-values from EMMAX and PLINK with the top
  10 PCs included as covariates for the first simulated replicate of               proportional ancestry estimates in admixed population
  DBP, plotted on the -log10 scale. Red and blue circles in the figure             samples, provided that the surrogates for the ancestral
  correspond to the association results for PLINK and EMMAX,                       populations are well represented in the analysis, but
  respectively.                                                                    unsupervised individual ancestry methods perform
                                                                                   poorly in this setting. We demonstrated that the top
                                                                                   PCs in sPCA may not adequately reflect ancestry in
SNPs on the odd-numbered chromosomes. EMMAX                                        samples with pedigrees from admixed populations. In
identifies a number of highly significant associations with                        contrast, our proposed method, R-PCA, can be used to
simulated DBP and SNPs in the functional region of the                             obtain ancestry informative PCs in samples containing
MAP4 gene on chromosome 3, where rs11711953,                                       general pedigrees with known relatedness. Using the
rs11706549, and rs11716779 are the three most significant                          REAP relatedness estimation method, we obtained
SNPs with corresponding p-values of 1.2e-12, 1.4e-12, and                          empirical kinship coefficients and IBD sharing probabil-
6.7e-10, respectively.                                                             ities in the GAW18 sample; we confirmed pedigree
Thornton et al. BMC Proceedings 2014, 8(Suppl 1):S5 Page 6 of 7
http://www.biomedcentral.com/1753-6561/8/S1/S5
Figure 4 Association results for EMMAX with simulated diastolic blood pressure (DBP). The Manhattan plot of p-values from EMMAX
for the first simulated replicate of DBP is plotted on the -log10 scale. The x- and y-axes show chromosome number and -log10 (p-value),
respectively.
relationships and identified cryptic relationships that Competing interests
The authors declare that they have no competing interests.
have not been reported. We also performed association
testing with the first simulated replicate of DBP using Authors’ contributions
the EMMAX association method, and genome-wide sig- All authors participated in study design and analysis. TT drafted the
manuscript, and all authors edited and approved the final manuscript.
nificant associations were detected with functional var-
iants in the MAP4 gene on chromosome 3. Finally, we Acknowledgements and declarations
estimated the heritability of the first simulated replicate This research was supported by the National Institutes of Health, grants
AG040184, AG005136, AG039700, CA148958, GM046255, GM075091,
for DBP in the GAW18 pedigrees, and we found that
HD054562, MH092367, and MH094293. The Genetic Analysis Workshops are
the heritability estimates were remarkably similar when supported by National Institutes of Health (NIH) grant GM031575. The
computing variance components with an empirical kin- GAW18 whole genome sequence data were provided by the T2D-GENES
Consortium, which is supported by NIH grants U01 DK085524, U01
ship coefficient matrix calculated with the REAP
DK085584, U01 DK085501, U01 DK085526, and U01 DK085545. The other
method, a pedigree-based kinship coefficient matrix, and genetic and phenotypic data for GAW18 were provided by the San Antonio
a hybrid of the two kinship matrices. Family Heart Study and San Antonio Family Diabetes/Gallbladder Study,Thornton et al. BMC Proceedings 2014, 8(Suppl 1):S5 Page 7 of 7
http://www.biomedcentral.com/1753-6561/8/S1/S5
which are supported by NIH grants P01 HL045222, R01 DK047482, and R01
DK053889. The Genetic Analysis Workshop is supported by NIH grant R01
GM031575.
This article has been published as part of BMC Proceedings Volume 8
Supplement 1, 2014: Genetic Analysis Workshop 18. The full contents of the
supplement are available online at http://www.biomedcentral.com/bmcproc/
supplements/8/S1. Publication charges for this supplement were funded by
the Texas Biomedical Research Institute.
Authors’ details
1
Department of Biostatistics, University of Washington, Seattle, WA 98195,
USA. 2Department of Statistics, University of Washington, 313 Padelford Hall,
Seattle, WA 98195, USA. 3Department of Medicine, Division of Medical
Genetics, University of Washington, Health Sciences Building, K-253, Box
357720, Seattle, WA 98195, USA.
Published: 17 June 2014
References
1. Price AL, Patterson NJ, Plenge RM, Weinblatt ME, Shadick NA, Reich D:
Principal components analysis corrects for stratification in genome-wide
association studies. Nat Genet 2006, 38:904-909.
2. Pritchard JK, Stephens M, Donnelly P: Inference of population structure
using multilocus genotype data. Genetics 2000, 155:945-959.
3. Tang H, Peng J, Wang P, Risch NJ: Estimation of individual admixture:
analytical and study design considerations. Genet Epidemiol 2005,
28:289-301.
4. Alexander DH, Novembre J, Lange K: Fast model-based estimation of
ancestry in unrelated individuals. Genome Res 2009, 19:1655-1664.
5. Kang HM, Sul JH, Service SK, Zaitlen NA, Kong SY, Freimer NB, Sabatti C,
Eskin E: Variance component model to account for sample structure in
genome-wide association studies. Nat Genet 2010, 42:348-354.
6. Purcell S, Neale B, Todd-Brown K, Thomas L, Ferreira MA, Bender D, Maller J,
Sklar P, de Bakker PI, Daly MJ, et al: PLINK: a toolset for whole-genome
association and population-based linkage analysis. Am J Hum Genet 2007,
81:559-575.
7. International HapMap 3 Consortium: Integrating common and rare
genetic variation in diverse human populations. Nature 2010, 467:52-58.
8. Li JZ, Absher DM, Tang H, Southwick AM, Casto AM, Ramachandran S,
Cann HM, Barsh GS, Feldman M, Cavalli-Sforza LL, et al: Worldwide human
relationships inferred from genome-wide patterns of variation. Science
2008, 319:1100-1104.
9. Zhu X, Li S, Cooper RS, Elston RC: A unified association analysis approach
for family and unrelated samples correcting for stratification. Am J Hum
Genet 2008, 82:352-365.
10. Thornton T, Tang H, Hoffmann TJ, Ochs-Balcom HM, Caan BJ, Risch N:
Estimating kinship in admixed populations. Am J Hum Genet 2012,
91:122-138.
11. Devlin B, Roeder K: Genomic control for association studies. Biometrics
1999, 55:997-1004.
12. Yang J, Benyamin B, McEvoy BP, Gordon S, Henders AK, Nyholt DR,
Madden PA, Heath AC, Martin NG, Montgomery GW, et al: Common SNPs
explain a large proportion of the heritability for human height. Nat
Genet 2010, 42:565-569.
doi:10.1186/1753-6561-8-S1-S5
Cite this article as: Thornton et al.: Estimating and adjusting for ancestry
admixture in statistical methods for relatedness inference, heritability
estimation, and association testing. BMC Proceedings 2014 8(Suppl 1):S5. Submit your next manuscript to BioMed Central
and take full advantage of:
• Convenient online submission
• Thorough peer review
• No space constraints or color figure charges
• Immediate publication on acceptance
• Inclusion in PubMed, CAS, Scopus and Google Scholar
• Research which is freely available for redistribution
Submit your manuscript at
www.biomedcentral.com/submitYou can also read