Phenotypic diversity in three generations of domesticated Asian redtail catfish, Hemibagrus nemurus (Valenciennes, 1840) in Indonesia - Bioflux
←
→
Page content transcription
If your browser does not render page correctly, please read the page content below
Phenotypic diversity in three generations of
domesticated Asian redtail catfish,
Hemibagrus nemurus (Valenciennes, 1840) in
Indonesia
Irin I. Kusmini, Deni Radona, M. H. Fariduddin Ath-Thar, Fera P. Putri,
Anang H. Kristanto, Rudhy Gustiano

      Institute for Freshwater Aquaculture Research and Fisheries Extension, Jalan Sempur
          No. 1 Bogor, 16151 West Java, Indonesia. Corresponding author: D. Radona,
                                  deniradona_kkp@yahoo.com

       Abstract. It is necessary to characterize the phenotypes of each produced generation to evaluate the
       rate of changes to support the success of a domestication program. This study aimed to analyze the
       phenotype diversity of three domesticated Asian redtail catfish (Hemibagrus nemurus) generations (G-1,
       G-2 and G-3) based on parameters such as truss morphometry, growth performance, and survival rate.
       The truss morphometric analysis was performed using 30 individuals sampled from each generation.
       Growth performance and survival rate analysis were experimentally carried out using a completely
       randomized design (CDR) with three replications. Rearing of the three Asian redtail catfish generations
       begun with an acclimatization period for one week and continued through up to 90 days. Rearing was
       done in 9 concrete ponds (3 x 2 x 1 m) with a circulation system. The water level in each pond was
       maintained at 80 cm. The stocking density was 100 individuals m-3. Fish were fed on commercial pellet
       containing protein (28%) at a 5% feeding rate (of the total biomass of fish). The results of truss
       morphometric analysis canonical function on 21 characteristics showed differences in characters
       occurring in the midsection (B3) and rear body of the fish (C1, C3, and C5). The analysis of
       intrapopulation similarity index revealed the highest values in G-1 and G-2 (60.0 %), whereas the lowest
       was observed in G-3 (40.0%). The results of domesticating three generations of Asian redtail catfish for
       90 days showed the G-3 had the highest length growth performance, SGR, FCR and survival rate (p <
       0.05) which were 6.49±0.39 cm; 0.70±0.03% per day; 2.3 and 67.67%, respectively.
       Key Words: Asian redtail catfish, phenotype, morphometric truss, growth, generations.

Introduction. The Asian redtail catfish (Hemibagrus nemurus) is an important economic
freshwater fish. Indeed, it is considered as one of the 22 freshwater genetic resources in
Indonesia that can be used to diversify the business of aquaculture (Gustiano et al 2015).
So far, the demand of the Asian redtail catfish for both consumption and aquaculture
activities still depends on the wild catch. The redtail catfish farming has been going on in
Indonesia since 1991 (Gaffar & Muflikhah 1992). However, its production has not yet
reached its optimum, and there are still issues such as reproductive performance to be
managed. The productivity of redtail catfish is considered to be low. Subagja et al (2015)
reported that the survival rate of the redtail catfish at the size of 5 cm is only about 10-
30%. Meanwhile, Radona et al (2018) stated that the survival rate of the redtail catfish
reared indoor at room temperature (25-26oC) is around 50%.
        Consequently, the low productivity of the Asian redtail catfish can lead to a lack of
fish availability, resulting in the unfulfillment of the demands of both aquaculture
activities and consumption. Thus, efforts are required to improve the productivity of
Asian redtail catfish, one of which is through domestication programs. Domestication is a
process of changes in living organisms involving genetic changes that occur from
generation to generation and can control the reproductive cycle and growth (Mylonas et
al 2010; Lorenzen et al 2012; Teletchea & Fontaine 2014). Proper broodstock

AACL Bioflux, 2019, Volume 12, Issue 1.
http://www.bioflux.com.ro/aacl
                                                      42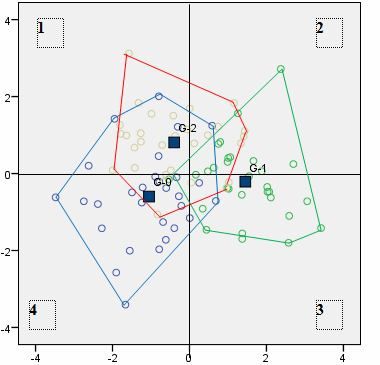
management and larvae rearing are crucial in domestication activities (Teletchean &
Fontaine 2011; Bijaksana 2012).
Mapping the genetic diversity of a population is required in supporting the success
of domestication programs. Genetic diversity is a key parameter for the fitness
population to ensure the sustainability of a community. According to Dunham (2004), the
genetic diversity was associated with the ability to adapt to environmental changes. It
can be identified based on the measurement of the morphological characteristic of the
phenotype following the morphometrics and growth (Sneath 1995). Phenotype
characterization can evaluate the rate of changes in each produced generation
(Bagherian & Rahmani 2009). The present study aimed to analyze the phenotype
diversities in three generations (G-1, G-2, and G-3) from the domestication of the Asian
redtail catfish based on truss morphometric, growth performance and survival rate.
Material and Method. This study was conducted at Germplasm Research Station which
is an installation unit of the Institute for Freshwater Aquaculture Research and Fisheries
Extension (BRPBATPP) Bogor, in July-October 2017.
Fish sample. Fish, used as the sample, came from the domesticated Asian redtail catfish
seeds of three generations. The predecessor of the Asian redtail catfish originated from
Cirata Lake, Cianjur district, West Java. The formed population of each generation was
obtained through mass spawning at a ratio of 1:2 (1 male to fertilize two females) from
the previous generations. The broodstock was selected based on rapid growth parameter.
Spawning of broodstock in the G-0, G-1, and G-3 was conducted through the induction of
gonadal maturity using HCG 500 IU kg-1 (spawning was carried out 24 hours post-
injection). LHRH analog was injected at doses 0.6 mL kg-1 for female and 0.2 mL kg-1 for
the male to stimulate ovulation. The first generation of Asian redtail catfish (G-1) had a
standard length (SL) of 7.78±0.41 cm and a total body weight (BW) of 7.39±0.96 g. The
second generation (G-2) had a SL of 8.28±0.21 cm and a BW of 8.06±1.10 g, while the
third generation (G-3) had a SL of 7.34±0.11 cm and a BW 6.47±0.39 g.
Morphometric observation. Morphometric was conducted on 30 individual samples
randomly taken from each generation (G-1, G-2, and G-3). Truss morphometric was
evaluated through measurement and determination methods of truss point based on
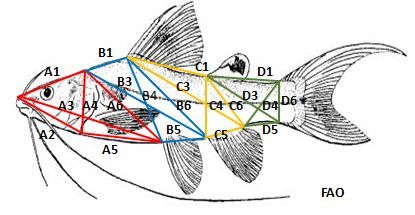
Radona et al (2017a, b). The 21 measurable characters were as follows: A1 (end of
mouth -latter part of skull), A2 (end of mouth - the lower end of operculum), A3 (end of
mouth -beginning of first ventral fin), A4 (latter part of skull - the lower end of
operculum), A5 (the lower end of operculum - beginning of first ventral fin), A6 (latter
part of skull -beginning of first ventral fin), B1 (latter part of skull - beginning of first
dorsal fin), B3 (latter part of skull - beginning of anal fin), B4 (beginning of first dorsal fin
- beginning of anal fin), B5 (beginning of first ventral fin - beginning of anal fin), B6
(beginning of first dorsal fin - beginning of anal fin), C1 (beginning of first dorsal fin -
beginning of second dorsal fin), C3 (beginning of first dorsal fin - end of second dorsal
fin), C4 (beginning of first dorsal fin - beginning of anal fin), C5 (beginning of anal fin -
end of anal fin), C6 (beginning of first dorsal fin - end of anal fin), D1 (beginning of first
dorsal fin - beginning of upper part of caudal fin), D3 (beginning of first dorsal fin -
beginning of lower part of caudal fin), D4 (beginning of upper part of caudal fin - end of
anal fin), D5 (end of anal fin - beginning of lower part of caudal fin) and D6 (beginning of
upper part of caudal fin -end of lower part of caudal fin). The truss points were made by
putting the fish on the paper sheet coated with clear plastic and placed within a
styrofoam. Each point was marked with a needle following the pattern in truss
morphometry (Figure 1). The results of the truss morphometry measurement of all the
characters were converted into a ratio by dividing the value of the character measured by
the value of the SL.
AACL Bioflux, 2019, Volume 12, Issue 1.
http://www.bioflux.com.ro/aacl
43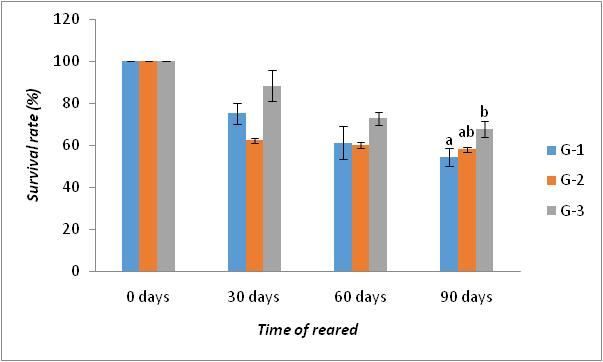
Figure 1. Measurement points in truss morphometry on Asian redtail catfish.

Growth performance. The observed growth parameters were total length gain (cm),
total weight (g), specific growth rate (SGR, %), survival rate and feed conversion ratio
(FCR). This study was experimentally conducted using a completely randomized design
(CDR) with three replications. The rearing of the three generations of Asian redtail catfish
begun with an acclimatization period (seeds) for one week in the pond and continued for
90 days. The rearing was done in 9 units of concrete ponds (3 x 2 x 1 m) with a
circulation system and a water height of 80 cm. The stocking density was 100 individual
m-3. During that period, a commercial pellet containing protein (28%) was provided at a
ratio of 5% of the total fish biomass. Feeding was carried out three times a day, at 07.00
am, 12.00 pm, and 17.00 pm. The observations of growth and survival rate were done
every 30 days. The growth parameters were based on both the length and weight of
individuals by taking 30% of the total population per ponds. Fish weight measurements
were done by using digital scales (model Notebook series 500 g, 0.01 g) with an accuracy
level of 0.01 g. Fish length measurements were conducted using a ruler with an accuracy
level of 0.5 mm while the survival rate was calculated based on the number of dead
fishes at the end of the experiment divided by the number of fishes at the beginning. FCR
measurements were performed at the end of the study following Fry et al (2018)
formula.

Analysis of data. Truss morphometric characters were quantitatively analyzed using the
ImageJ program. Calculation value of the distribution characters of truss morphometric
(intra- and interpopulation) and sharing component index was conducted with ANOVA
using SPSS version 18 and presented in the form of diagram canonical function. Data of
growth, survival rate and FCR were tabulated using Microsoft Excel 2010, then analyzed
by analysis of variance (ANOVA) using SPSS 22.0 followed by a Duncan test at 95% level
of confidence.

Results and Discussion

Truss morphometry of three Asian redtail catfish generations. The average values
of 21 truss morphometry characters of three Asian redtail catfish generations (G-1, G-2
and G-3) originated from domestication are presented in Table 1. The morphometric
diversity was expressed in the coefficient of variation (CV) presented in Table 2.
        Phenotype diversities, based on 21 morphometric characters and analyzed using
Wilks lambda, showed that only four characters had different values (p < 0.05).
Whereas, Lavene test analysis (ANOVA) revealed that all measured characters had
similarities (p > 0.05) (Table 2). The measured characteristics showed different
characters in the midsection and rear body of the fish. In the midsection, it occurred in
the latter part of the skull - beginning of anal fin (B3), while in the rear body, it occurred
at the beginning of the first dorsal fin - beginning of second dorsal fin (C1), beginning of

AACL Bioflux, 2019, Volume 12, Issue 1.
http://www.bioflux.com.ro/aacl
                                             44
first dorsal fin - end of second dorsal fin (C3), and beginning of anal fin - end of anal fin
(C5).
Table 1
The average value of phenotype diversity of the 21 characters in truss morphometric
analysis of three generations (G-1, G-2, and G-3) of domesticated Asian redtail catfish
Morphometric Average
Truss area
characters G-1 G-2 G-3
Head of fish A1 0.365±0.019 0.360±0.015 0.366±0.016
A2 0.210±0.019 0.208±0.016 0.203±0.015
A3 0.255±0.016 0.252±0.014 0.258±0.016
A4 0.358±0.014 0.352±0.016 0.353±0.012
A5 0.561±0.012 0.553±0.018 0.554±0.019
A6 0.176±0.016 0.178±0.014 0.179±0.016
Midsection of B1 0.191±0.015 0.192±0.009 0.193±0.015
fish B3 0.170±0.017 0.156±0.017 0.165±0.015
B4 0.384±0.013 0.391±0.012 0.390±0.013
B5 0.515±0.029 0.515±0.013 0.518±0.017
B6 0.261±0.016 0.264±0.014 0.261±0.090
Rear body of C1 0.130±0.009 0.142±0.008 0.131±0.011
fish C3 0.332±0.014 0.342±0.012 0.334±0.015
C4 0.184±0.009 0.187±0.008 0.184±0.006
C5 0.480±0.014 0.494±0.011 0.487±0.016
C6 0.173±0.011 0.173±0.008 0.176±0.009
Caudal peduncle D1 0.137±0.017 0.132±0.017 0.138±0.022
of fish D3 0.262±0.018 0.263±0.026 0.268±0.017
D4 0.131±0.006 0.136±0.013 0.132±0.008
D5 0.300±0.016 0.297±0.025 0.300±0.019
D6 0.180±0.015 0.177±0.010 0.185±0.016
Table 2
Wilks lambda analysis and Lavene test (ANOVA) coefficient of variation of the 21 truss
morphometric characters of three generations of domesticated Asian redtail catfish
Morphometric The coefficient of variation (%) Significant Significant
characters G-1 G-2 G-3 Wilks lambda ANOVA
A1 5.21 4.18 4.24 0.268 0.198
A2 8.92 7.70 7.43 0.242 0.338
A3 6.39 5.43 6.26 0.351 0.652
A4 3.83 4.48 3.48 0.213 0.574
A5 2.18 3.21 3.37 0.089 0.195
A6 9.38 7.93 8.88 0.731 0.742
B1 8.03 4.79 7.64 0.903 0.108
B3 10.07 10.67 8.99 0.003* 0.994
B4 3.33 3.03 3.30 0.077 0.939
B5 5.63 2.46 3.32 0.780 0.429
B6 5.99 5.48 3.44 0.629 0.052
C1 7.28 5.77 8.47 0.000* 0.400
C3 4.25 3.46 4.39 0.011* 0.348
C4 4.98 4.14 3.41 0.181 0.367
C5 2.90 2.15 3.36 0.001* 0.087
C6 6.43 4.48 4.84 0.413 0.210
D1 12.36 13.15 15.64 0.483 0.158
D3 6.94 9.99 6.28 0.487 0.897
D4 4.72 9.65 5.74 0.184 0.159
D5 5.26 8.45 6.47 0.840 0.532
D6 8.11 5.87 8.67 0.100 0.053
notes: * significantly different (p < 0.05).
AACL Bioflux, 2019, Volume 12, Issue 1.
http://www.bioflux.com.ro/aacl
45The coefficient value of character diversity indicated the level of variability of the
corresponding character in a population. The level of a character phenotypic variability
reflects the population genotypic variability (Falconer & Mackay 1996; Gjedrem et al
2012). The coefficients of variation (CV) of the Asian redtail catfish population originating
from domestication (G-1, G-2, and G-3) ranged from 2.15 to 15.64%. The low value of
the CV in the Asian redtail catfish from domestication was similar to those of other native
species such as tinfoil barb (Kusmini et al 2016) and giant gourami (Radona et al 2017b).
A significant test of Wilks lambda and ANOVA were conducted to determine the character
that can be used as a characteristic of a fish. The result of canonical function analysis
(Figure 2) showed that individual morphological characters of the Asian redtail catfish
population (G-1, G-2, and G-3) interconnected with one another and spread evenly
across all quadrants (1, 2, 3 and 4).
Figure 2. Individual morphological character distribution in a population consisting of
three generations of Asian redtail catfish from domestication.
Based on the analysis, the sharing component index intrapopulation phenotypes indicated
that the Asian redtail catfish in G-1 and the G-2 population had the highest sharing
component index, which was 60.0%, compared to the G-3 population with 40.0% (Table
3). The lowest sharing component index of interpopulation was observed in G-1 and G-2
(10.0-13.3%) and G-1 and G3 (26.7-30.0%); G-2 and G-3 (30.0%).
Table 3
The percentages of sharing component of the three Asian Redtail catfish generation
originating from domestication
Population G-1 G-2 G-3 Total
G-1 60.0 13.3 26.7 100.0
G-2 10.0 60.0 30.0 100.0
G-3 30.0 30.0 40.0 100.0
In the domestication process, intrapopulation sharing component index value obtained in
the Asian redtail catfish was lower than that of the tinfoil barb. Radona et al (2017a)
reported that the value of intrapopulation sharing component index in the domestication
of the tinfoil barb from West Kalimantan was 76.7%. The low value of the intrapopulation
sharing component index in the Asian redtail catfish was a consequence of the high
genetic diversity that occurred as a result of the domestication process. Mahardika et al
(2011) stated that the higher the value of the intra-interpopulation sharing component,
AACL Bioflux, 2019, Volume 12, Issue 1.
http://www.bioflux.com.ro/aacl
46the lower the genetic diversity would be. Meanwhile, lower value of intrapopulation
sharing component resulted in higher genetic variability. The phenotype diversity is a key
parameter of the population fitness that ensures its sustainability and passive response
to natural or artificial selection (Lorenzen et al 2012). Phenotype diversity can give an
idea of the fitness status of the population. The higher the diversity of the phenotype, the
higher the ability of fish to adapt to environmental changes will be.
Meanwhile, low diversity of the phenotype can decrease both adaptability and
productivity. The low diversity of the phenotype is due to the availability of the effective
number of breeding broodstock in the aquaculture process which is very little, thus,
increasing the potential of inbreeding (Gjedrem et al 2012). According to Ujjania & Kohli
(2011), the phenotype of a fish is generally indicated by a different potential for growth.
In relation with the domestication effort, one aspect that has to be considered and play
an important role in the domestication program is the provision of broodstock for
breeding to increase the productivity of the Asian redtail catfish.
Growth performance of the three generations of Asian redtail catfish originating
from domestication. The results of rearing three generations of Asian redtail catfish
from domestication during 90 days showed that the G-3 had optimal growth performance
with a standard length of 6.49±0.39 cm and a specific growth rate of 0.70±0.03% per
day. Statistically, those values of the length growth were significantly different (p < 0.05)
compared to those of the G-2. Also, the FCR (2.3) of G-3 revealed significant differences
when compared to that (p < 0.05) of G-1 with 2.5.
The FCR shows the utilization of nutrients in the feed by the fish. Thus, a low FCR
value indicates that the use of the feed is efficient. Feed efficiency is the proportion of
fish biomass that increases along with the amount of feed consumed (Luo et al 2015; Xia
et al 2017). High feed efficiency obtained in the G-3 demonstrated a better feed
utilization compared to G-2 and G-1. The growth parameters such as length, weight,
specific growth rate and FCR of the three generations of Asian redtail catfish from
domestication are presented in Table 4.
Table 4
Length gain, weight gain, specific growth rate, and FCR of Asian redtail catfish from domestication
Population
Growth parameters
G-1 G-2 G-3
Initial length (cm) 7.78±0.41 8.28±0.21 7.34±0.11
Initial body weight (g) 7.39±0.96 8.06±1.10 6.47±0.39
Final length (cm) 14.21±0.16 13.33±0.23 13.83±0.23
Final body weight (g) 52.93±1.13 55.48±0.47 55.32±0.42
Absolute length (cm) 6.42±0.54b 5.04±0.32a 6.49±0.31b
Absolute weight (g) 45.54±1.99a 47.43±1.21a 48.85±0.37a
Specific growth rate of length (% day-1) 0.67±0.07b 0.53±0.03a 0.70±0.03b
Specific growth rate of weight (% day-1) 2.20±0.17a 2.15±0.16a 2.39±0.06a
FCR 2.5b 2.1a 2.3a
Note: Numbers followed by different superscript letters in the same row indicate significant differences
according to Duncan test (p < 0.05).
Based on the results of observations during the study, the G-3 Asian redtail catfish had
optimal growth performances. Indeed, the G-3 group had a weight increase of 7%
compared to G-1, while the length increased about 29% compared to the G-2 group. In
general, the domesticated fish had better growth performance compared to wild fish.
Growth is a genotype expression in a phenotype that is quantitatively observed and
influenced by environmental factors. The increase in growth in each generation is in the
form of change/improvement of the genetic quality which is a positive response to
environmental conditions (Millot et al 2011; Kusmini et al 2013). Millot et al (2010)
stated that domesticated fish tend to have a high appetite that can accelerate the growth
AACL Bioflux, 2019, Volume 12, Issue 1.
http://www.bioflux.com.ro/aacl
47process. The SGR of weight and length were directly obtained and proportional to weight
gain and length. The higher the growth increment, the greater the SGR value will be.
The survival rate of the three generations of domesticated Asian redtail catfish.
The survival rate of the three generations of domesticated Asian redtail catfish reared in
concrete ponds for 90 days is presented in Figure 3.
Figure 3. The survival rate of domesticated Asian redtail catfish.
At the end of the rearing period, the highest survival rate was observed in the G-3 about
67.67%. Statistically, the survival rate of the G-3 population was significantly different (p
< 0.05) compared to that of the G-1 population, i.e., 54.33%. The high survival rate is
presumably due to the G-3 undergoing a suitable process of adaptation in a controlled
environment. The success of the domestication program will impact on improving the
genetic diversity of fish which is closely related to economic characteristics such as
survival and efficiency of feed utilization (Lorenzen et al 2012; Gjedrem et al 2012).
Studies have reported that the population of fish in the last generation had a better
adaptive performance with the highest survival rate compared to the population of
previous generations in fish species such as lalawak fish (Prakoso et al 2017), common
carp of rajadanu strain (Radona & Asih 2012).
Conclusions. The morphological characters of the three generations (G-1, G-2, and G-3)
of domesticated Asian redtail catfish revealed differences that occurred in the midsection
(B3) and rear body of fish (C1, C3 and C5) with an intrapopulation phenotype sharing
component index of 60%. The G-3 had an optimum performance with increased weight
(7%), length (29%), survival rate (67.67%) and FCR (2.3).
Acknowledgements. We would like to thank the Institute for Freshwater Aquaculture
Research and Fisheries Extension for funding the present research through the APBN
2017. We would also like to thank Mr. Otong Zenal Arifin for the research facilities and
thanks to Mr. Sudarmaji, Heppy Aprilistianto, and Miss. Fera Permata Putri for their
assistance provided during this research.
References
Bagherian A., Rahmani H., 2009 Morphological discrimination between two populations of
shemaya, Chalcalburnus chalcoides (Actinopterygii, Cyprinidae) using a truss
network. Animal Biodiversity and Conservation 32(1):1-8.
Bijaksana U., 2012 [Snakehead domestication, Channa striata Blkr, swamp water
optimization efforts in South Kalimantan Province]. Jurnal Lahan Suboptimal
1(1):92-101. [in Indonesian]
AACL Bioflux, 2019, Volume 12, Issue 1.
http://www.bioflux.com.ro/aacl
48Dunham R. A., 2004 Aquaculture and fisheries biotechnology: genetic approach. CABI
Publishing, Cambridge, USA, pp. 85-99.
Falconer D. S., Mackay T. F. C., 1996 Introduction to quantitative genetics. Pearson
Education, 464 pp.
Fry J. P., Mailloux N. A., Love D. C., Milli M. C., Cao L., 2018 Feed conversion efficiency in
aquaculture: do we measure it correctly? Environmental Research Letters
13:024017.
Gaffar A. K., Muflikhah N., 1992 [Artificial spawning and larval rearing of Asian redtail
catfish]. Prosiding Seminar Hasil Penelitian Perikanan Air Tawar, pp. 254-257. [in
Indonesian]
Gjedrem T., Robinson N., Rye M., 2012 The importance of selective breeding in
aquaculture to meet future demands for animal protein: a review. Aquaculture 350-
353:117-129.
Gustiano R., Kusmini I., Ath-thar M. F. H., 2015 [Understanding of genetic resources on
Indonesian native freshwater fish species for aquaculture development]. IPB Press,
Bogor, 51 pp. [in Indonesian]
Kusmini I. I., Arifin O. Z., Putri F. P., Kusdiarti, 2013 [The growth rate of tilapia strain
BEST (F-4 and F-5) from individual selection]. Prosiding Forum Inovasi Teknologi
Akuakultur 2013, pp. 563-569. [in Indonesian]
Kusmini I. I., Gustiano R., Radona D., Prakoso V. A., Putri F. P., Prihadi T. H., 2016
[Phenotype and genetic characterization of three population of tinfoil barb,
Barbonymus schwanenfeldii]. Jurnal Riset Akuakultur 11(3):207-216. [in
Indonesian]
Lorenzen K., Beveridge M. C. M., Mangel M., 2012 Cultured fish: integrative biology and
management of domestication and interactions with wild fish. Biology Review
87:639-660.
Luo L., Li T. J., Xing W., Xue M., Ma Z. H., Jiang N., Li W. T., 2015 Effects of feeding
rates and feeding frequency on the growth performances of juvenile hybrid
sturgeon, Acipenser schrenckii Brandt ♀ × A. baeri Brandt ♂. Aquaculture 448:229-
233.
Mahardika P., Soelistiowati D., Gustiano R., Ath-thar M. H. F., 2011 [Perfomance of four
intraspecific hybridization of Nile tilapia Oreochromis niloticus in experimental
floating net cages in lake Lido]. Berita Biologi 10(1):533˗540. [in Indonesian]
Millot S., Pean S., Leguay D., Vergnet A., Chatain B., Begout M. L., 2010 Evaluation of
behavioral changes induced by a first step of domestication or selection for growth
in the European sea bass (Dicentrarchus labrax): a self-feeding approach under
repeated acute stress. Aquaculture 306:211-217.
Millot S., Pean S., Chatain B., Begout M. L., 2011 Self-feeding behavior changes induced
by a first and a second generation of domestication or selection for growth in the
European sea bass, Dicentrarchus labrax. Aquatic Living Resources 24:53-61.
Mylonas C. C., Fostier A., Zanuy S., 2010 Broodstock management and hormonal
manipulations of fish reproduction. General and Comparative Endocrinology 165:
516-534.
Prakoso V. A., Putri F. P., Kusmini I. I., 2017 [Growth on first generation of domesticated
barb Barbonymus balleroides]. Jurnal Riset Akuakultur 12(3):213-219. [in
Indonesian]
Radona D., Asih S., 2012 [Growth performance of common carp strain Rajadanu (F-3)].
Prosiding Seminar Nasional Perikanan Indonesia, STP. Jakarta 13-14 November, pp.
312-317. [in Indonesian]
Radona D., Kusmini I. I., Ath-thar M. H. F., 2017a [Meristic and morphometric
characterization of three generations of tinfoil barb from West Kalimantan,
Indonesia]. Jurnal Riset Akuakultur 12(1):1-8. [in Indonesian]
Radona D., Nafiqoh N., Arifin O. Z., 2017b [Biometrical study based on meristic and
morphometric of giant gouramy strain bastar and bluesafir]. Berita Biologi 16(2):
121-127. [in Indonesian]
AACL Bioflux, 2019, Volume 12, Issue 1.
http://www.bioflux.com.ro/aacl
49Radona D., Subagja J., Prakoso V. A., Kusmini I. I., Kristanto A. H., 2018 [Reproductive
biology and level of spawning of Asian redtail catfish Hemibagrus nemurus
(Valenciennes, 1840) from Cirata population incubated at different temperature
setting]. Jurnal Riset Akuakultur 13(2):131-136. [in Indonesian]
Sneath P. H. A., 1995 Thirty years of numerical taxonomy. Systematic Biology 44:281-
298.
Subagja J., Cahyanti W., Nafiqoh N., Arifin O. Z., 2015 [Bioreproduction and growth
performance from three different population of Hemibagrus nemurus]. Jurnal Riset
Akuakultur 10(1):25-32. [in Indonesian]
Teletchea F., Fontaine P., 2011 Particularities of early life stages in temperate freshwater
fish species: comparisons with marine species and implications for aquaculture
practices. Aquaculture Research 42(5):630-654.
Teletchea F., Fontaine P., 2014 Levels of domestication in fish: implications for the
sustainable future of aquaculture. Fish and Fisheries 15:181-195.
Ujjania N. C., Kohli M. P. S., 2011 Landmark based morphometric analysis for selected
species of Indian major carp Catla catla (Ham. 1822). International Journal of Food,
Agriculture and Veterinary Sciences 1(1):64-74.
Xia B., Ren Y., Wang J., Sun Y., Zhang Z., 2017 Effect of feeding frequency and density
on growth, energy budget and physiological performance of sea cucumber
Apostichopus japonicus (Selenka). Aquaculture 466:26-32.
Received: 13 August 2018. Accepted: 20 November 2018. Published online: 24 January 2019.
Authors:
Irin Iriana Kusmini, Institute for Freshwater Aquaculture Research and Fisheries Extension, Jalan Sempur No. 1
Bogor, 16151 West Java, Indonesia, e-mail: iriniriana@gmail.com
Deni Radona, Institute for Freshwater Aquaculture Research and Fisheries Extension, Jalan Sempur No. 1
Bogor, 16151 West Java, Indonesia, e-mail: deniradona_kkp@yahoo.com
Muhammad Hunaina Fariduddin Ath-Thar, Institute for Freshwater Aquaculture Research and Fisheries
Extension, Jalan Sempur No. 1 Bogor, 16151 West Java, Indonesia, e-mail: faridkkp@yahoo.com
Fera P. Putri, Institute for Freshwater Aquaculture Research and Fisheries Extension, Jalan Sempur No. 1 Bogor,
16151 West Java, Indonesia, e-mail: putriferapermata@yahoo.co.id
Anang H. Kristanto, Institute for Freshwater Aquaculture Research and Fisheries Extension, Jalan Sempur No. 1
Bogor, 16151 West Java, Indonesia, e-mail: ananghari25@gmail.com
Rudhy Gustiano, Institute for Freshwater Aquaculture Research and Fisheries Extension, Jalan Sempur No. 1
Bogor, 16151 West Java, Indonesia, e-mail: rgustiano@yahoo.com
This is an open-access article distributed under the terms of the Creative Commons Attribution License, which
permits unrestricted use, distribution and reproduction in any medium, provided the original author and source
are credited.
How to cite this article:
Kusmini I. I., Radona D., Ath-Thar M. H. F., Putri F. P., Kristanto A. H., Gustiano R., 2019 Phenotypic diversity
in three generations of domesticated Asian redtail catfish, Hemibagrus nemurus (Valenciennes, 1840) in
Indonesia. AACL Bioflux 12(1):42-50.
AACL Bioflux, 2019, Volume 12, Issue 1.
http://www.bioflux.com.ro/aacl
50You can also read