European offices - Future Rental Growth Hotspots 2018 - Capital Markets | JLL
←
→
Page content transcription
If your browser does not render page correctly, please read the page content below
European offices - Future Rental Growth Hotspots 2018

2                                                                           European Office Rental Growth Hotspots 2018

    Identifying rental growth hotspots

    Against a background of record pricing, identifying income driven
    returns and rental growth has become paramount. With a modest
    development cycle across many European office markets, office
    supply levels are playing an important role in current rental growth.
    We can see this demonstrated in markets such as Dublin, Stockholm,
    Berlin and Amsterdam where a sudden pinch in availability has
    triggered exceptional rental growth in recent years.

    Supply - or lack of it - is therefore likely to play an increasingly
    important role in driving rental growth over the next 2-3 years. To
    help investors factor this in, JLL has developed a Supply Sensitivity
    Index that explores the relationship between vacancy rates and net
    effective rents to help provide new insights into market performance.
    This is a forward-looking indicator, complementing traditional
    forecasts to help investors identify possible office (supply-led)
    hotspots of the future - cities where we see potential rental growth
    upside in the next couple of years.

    This report showcases some of the insights resulting from the
    development of our Supply Sensitivity Index. Please contact us for
    further information or to request a presentation by our team of the
    full Rental Growth Hotspots results and what they might mean for
    your future investment strategies.

                         Peter Hensby
                         Head of Pan-EMEA Office Capital Markets
                         +44 207 399 5422
                         peter.hensby@eu.jll.com

                         Alex Colpaert
                         Head of EMEA Offices Research
                         +31 650 671 152
                         alex.colpaert@eu.jll.com
3 European Office Rental Growth Hotspots 2018
2018 Growth Hotspots
Identifying supply-led growth
New development expected to remain cautious
2017 marked the start of a new development cycle and at 5 million sq m, 2018 will see the highest office completions
since 2010. However, more than 60% of this is already pre-let and most of the cities that have had, or will see, a rise in
development, are currently severely supply squeezed and will therefore often not be able to accommodate all future demand.
The current view of the development pipeline for 2019-20 looks stronger but not exceptional. In the past two years,
development estimates have tended to the upside as forecasts have included not yet commenced plans, which means in reality
completions could well be lower than anticipated. Historic patterns suggest that actual completions may even remain below
6 - 7 million sq m per annum. Compared with previous development cycles (1999-2003 and 2007-2010) most cities are currently
showing much lower development levels than in the past, highlighting the relatively modest supply reaction this time around.
Limited late cycle development exuberance
8 12
Vacancy Rate (%)
European office completions (million sq m)
7
10
6
8
5
4 6
3
4
2
2
1
0 0
1996
1997
1998
1999
2000
2001
2002
2003
2004
2005
2006
2007
2008
2009
2010
2011
2012
2013
2014
2015
2016
2017
2018 F
2019 F
2020 F
Source: JLL Initial Expectations Completions Future Completions Vacancy Rate
Shortages in Grade A space are even more acute. At this point in the cycle, when Grade A vacancy rates have reached record
lows, a pinch in availability often strongly influences rental growth across Europe. Stockholm is a prime example of where a
significant and sudden supply-demand imbalance significantly pushed up rents (+17% in 2017), comfortably outperforming
the European average and the city’s historic performance (as we predicted in JLL’s 2017 Rental Growth Hotspots report).
Grade A space shortage continues
16 Q1 2018 Grade A Vacancy Rate: 2005 - 2018 Peak to Trough
14
12
10
8
6
4
2
0
Paris CBD*
Paris LDF*
Berlin
Luxembourg*
Munich
Amsterdam
Hamburg
Milan
Stockholm**
Dublin
Madrid**
Frankfurt
Budapest
Prague
London City
Source: JLL *Paris CBD, Paris LDF & Luxembourg based on New Stock
**Stockholm & Madrid – Estimated from the Grade A vacant stock %4 European Office Rental Growth Hotspots 2018
Supply -led growth
ol
ist
Br
0.0
Vacancy Rate (%)
2.0
4.0
6.0
8.0
10.0
12.0
14.0
16.0
18.0
Vacancy rate at which net effective rents are stable
Note: Please contact us for the percentages data for each city
Source: JLL
Intuitively, the lower the supply or vacancy rate, the more rents will tend to rise as occupiers are increasingly willing to pay
extra for scarce space. In thinking about how supply may affect rents in the future, we analysed the available data for 35
European cities, calculating an average vacancy rate below which we have seen rents begin to rise in each city.
This stable rate varies widely across markets. Office vacancy in Dublin, for instance, has historically been relatively high
and volatile. On the other side of the spectrum, London West End records one of the lowest and most stable rates over a
period of many years.5 European Office Rental Growth Hotspots 2018
Supply Sensitivity Index
On its own, the stable rate offers limited predictive value. Our Supply Sensitivity Index however, provides a broader
measure to explore the relationship between supply and net effective rental growth. It offers a complement to our
traditional macro-econometric forecasts that can add valuable insight to the decision making process. Linked to net
effective rents rather than headline rents, it offers a broader perspective on market performance, pinpointing potential
hotspots for availability-driven growth across Europe.
From its stable rate, the index looks at future movements and assesses what this means for rental prospects in key
European markets.
The Index is based on a 20-year time series across data from 35 European cities - where available - and incorporates seven
metrics ranging from current and future supply, to sensitivity of rents and supply absorption. The final Sensitivity Supply
Index provides a combined score which indicates the potential for supply driven rental growth for each city.
In this report, we offer a top line look at three of our seven metrics, ranking the top 10 cities for each, as well as providing
a summary of our overall final ranking. For a deeper look at the results and to get the fuller picture by city, please contact
the team for a presentation.
1. Future supply
Where will vacancy be in 5 years?
1. Amsterdam Top 10 cities 2021 vacancy v stable rate
2. Munich Looking ahead, limited development and strong absorption
will push vacancy across Europe below previous lows. In many
3. Dublin
cities, this implies supply is well below the stable rate.
4. Bucharest
In Amsterdam, this effect is most severe. Historically defined by
5. Utrecht high rates (double digits rates since 2002), vacancy is forecast
to move 1100bp below the stable rate. Germany is also well
6. Stuttgart
represented with five of the big seven markets expected to see
7. Stockholm vacancy rates well below the stable rate by 2021.
8. Manchester Frankfurt doesn’t quite make the top 10 but also stands out.
The development pipeline has picked up significantly in the
9. Dusseldorf
last 18 months. Nevertheless, vacancy is predicted to remain
10. Hamburg around 250 – 300bp below the market stable rate.6 European Office Rental Growth Hotspots 2018
2. Rental sensitivity
How sensitive are office rents to vacancy changes?
1. Leeds Top 10 cities - Rental response to vacancy changes
2. Budapest As each market is balanced differently, rents will react in a different
3. Prague way to changes in vacancy. The rental sensitivity to vacancy changes is
therefore important when highlighting potential hotpots.
4. Stockholm
5. Stuttgart Budapest for instance has historically recorded substantial rental
6. Moscow changes on the back of relatively modest vacancy rate fluctuations.
Prime rents jumped by 10% when vacancy dropped 230 bp to 11.3%
7. Warsaw between Q3 2016 to Q1 2017.
8. Berlin
In Warsaw, high levels of supply in recent years (2013-2016) have
9. The Hague
muted rental growth. However, supply constraints in 2006-2008 and
10. Dublin again in 2012 were followed by a sudden and significant rental surge.
3. Sense check
Are we missing any other major barriers for rental growth?
Top 10 cities - 2018-2021 Annual rental growth forecast
1. Madrid
2. Barcelona Overlaying the supply side analysis with the traditional macro-
econometric forecasts provides a sense check. It also highlights if
3. Utrecht there are any significant barriers for rental growth that the supply
analysis does not account for.
4. Amsterdam
5. Lyon Unsurprisingly, the majority of markets that we expect to provide
supply driven rental growth upside are also listed high up the
6. Moscow macro-economic forecast. These are accompanied by markets still
in recovery mode, where rents are expected to move up from their
7. Stuttgart
cyclical low (e.g. Madrid, Barcelona and Moscow).
8. Edinburgh
Three regional UK cities are listed in the top-10 European rental
9. Birmingham growth stories, with Glasgow just outside at number 11. These are
underwritten by strong demand for high quality space despite the
10. Manchester
potential geo-political headwinds.7 European Office Rental Growth Hotspots 2018
Final top 10 ranking (total weighted score)
1 Amsterdam Amsterdam, Stuttgart and Stockholm look to outperform
2 Stuttgart Amsterdam, Stuttgart and Stockholm are the clear top 3 in our overall ranking, with
limited supply in these cities likely to play an important role in driving further growth.
3 Stockholm
4 Munich Amsterdam heads the ranking. While headline rents have seen little movement in the
last 20 years, net effectives show a different story as incentives play a significant role
5 Prague in lease negotiations. Net effective rents have historically stabilised at a relatively high
vacancy rate of around 15%. While rental sensitivity to vacancy changes falls in the
6 Barcelona
mid-range, supply is forecast to drop dramatically (more than 1000bp below the stable
7 Edinburgh rate) to 4.7% by 2021 as development has all but dried up. Prime space will become
increasingly valuable across Amsterdam.
8 Dublin
In Germany, Stuttgart’s relatively small market (comparable to the London West End
9 Utrecht
submarket), also offers upside rental growth potential. Riding on the coat-tails of
10 Warsaw strong growth in the manufacturing sector, availability has dropped to a record low.
A strong sensitivity to availability and a vacancy rate which is likely to drop to around
1.5% should provide plenty of opportunity in different submarkets across Stuttgart.
Following a 17% per annum prime net effective rental growth in 2015-17, Stockholm
still offers opportunity for further rental growth. Stockholm prime rents record one of
the strongest reactions in Europe to decreases in vacancy. Although vacancy is not
expected to decrease much further by 2021, a vacancy rate of around 7.5% - 8% should
continue to push up net effective rents.
Munich and Prague round out the top 5, with tight supply in these markets expected
to drive strong rental growth. In Munich, vacancy is below 4% and is forecast to tighten
further beyond the stable rate (-750bp). In Prague, vacancy declined by 320 bps in 2017
alone and is now at its lowest level since 2008 (-400 bps below the stable rate).
Beyond the Top 5
There are a number of other cities outside the top five that offer significant supply driven rental upside. These include markets
such as Warsaw. Only recently bottoming out after a prolonged period of oversupply, Warsaw represents one of the strongest
leasing markets in Europe. While supply is significant, large pre-lettings quickly absorb the remaining quality space on offer.
Vacancy is likely to fall sharply in the short term and rental growth should accelerate on the back of this.
Against the backdrop of tight supply and low speculative development, UK regional office markets also offer substantial
potential for further supply-led rental growth. Edinburgh, Manchester, Leeds and Birmingham are all ranked in the top 15 of our
final growth potential ranking.
Across the Big 6 markets, high-quality space is in increasingly short supply, with total Grade A vacancy at just 1.7%. The
pressure is most pronounced in Bristol (0.5%) and Edinburgh (1.4%), which last year saw annual rental growth of 14% and
3.2% respectively. Despite potential geo-political headwinds, the outlook remains positive for the UK regions, with tight supply,
modest development and active pre-letting expected to drive rental growth in cities such as Bristol, Edinburgh and Manchester.8 European Office Rental Growth Hotspots 2018
Submarket outperformance to continue
The Supply Sensitivity Index highlights the potential upside net effective rental growth in some of Europe’s prime office
districts. This does not mean rental growth is constrained to just the prime office districts. Indeed, the lack of modern,
efficient, office supply in traditional CBD will drive occupiers to second-best submarkets offering high quality space. In some
markets this supply-constrained environment is creating ‘a tide that raises all boats’. It will be crucial to clearly identify which
markets will be a short-lived bounce and which are supported by structural improvements, differentiators, solid property
fundamentals, and strong occupier demand.
Below we look at the top 5 markets from the Sensitivity Index which benefit from these drivers of growth and where investors
can expect above average rental growth in 2018-2019.
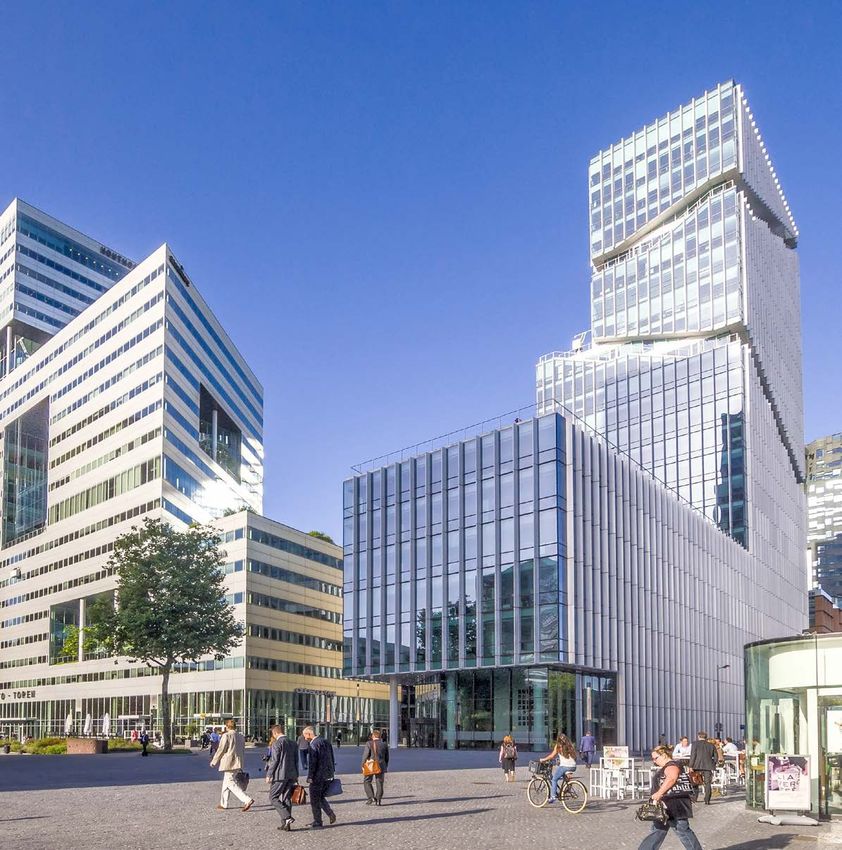
Amsterdam Extremely low vacancy in the Zuidas (3.5%) and City Centre (2.0%), as well as a
modest pipeline, will push demand into more peripheral areas, with occupiers
increasingly targeting South East and Sloterdijk/Teleport. These submarkets
Netherlands offer large floorplates at a discount to prime locations, plus good transport
South East and Sloterdijk/Teleport connections to Schiphol Airport and other cities across the Randstad (i.e.
Utrecht, Rotterdam & The Hague). These factors, plus ongoing retail/residential
development in these areas, combine to attract a diverse occupier base,
ranging from tech and media companies to more established tenants in the
financial services sector (e.g. ABN Amro and Deutsche Bank). As the supply-
demand imbalance intensifies, rental growth is expected to accelerate in
South-East and Sloterdijk/Teleport in 2018.
Annual Rental 2017 Take-Up Vacancy Rate
Growth 2017 (000 sq m) Q4 2017 (%)
Key reasons for rental growth 2017 v 2017 v 2017 v
2017 5Y Avg 2017 5Y Avg 2017 5Y Avg
Demand spillover from
core submarkets Amsterdam 8.1% +6.1pp 389 +42% 7.1% -640 bp
Large, cost-effective Zuidas 8.1% +6.1pp 97 +128% 3.5% -400 bp
floorplates
South-East 0.0% +0.0pp 81 +52% 5.5% -1380 bp
Good transport
connections Sloterdijk/Teleport 2.8% +1.6pp 56 +11.2% 11.2% -870 bp9 European Office Rental Growth Hotspots 2018
Stuttgart Robust demand and modest development has pushed vacancy down to
long-term lows in the City Centre (1.8%) and Vaihingen-Möhringen (2.5%)
submarkets. This intense supply shortage is unlikely to be addressed in the
Germany near term as development remains muted. In the City Centre, floorplates
City Centre & Vaihingen-Möhringen greater than 1,000 sq m remain scarce and will continue to demand a premium.
This will force occupiers to more peripheral locations such as Vaihingen-
Möhringen. Here, Daimler AG is building a 90,000 sq m office campus, which
has in turn attracted a cluster of other tech-related businesses. Already, a
local developer is achieving rents well-above the current prime rent. This
submarket’s accessibility via the S-Bahn and proximity to Stuttgart Airport will
also support rental growth.
Annual Rental 2017 Take-Up Vacancy Rate
Growth 2017 (000 sq m) Q4 2017 (%)
Key reasons for rental growth 2017 v 2017 v 2017 v
2017 5Y Avg 2017 5Y Avg 2017 5Y Avg
Vacancy amongst lowest
in Europe Stuttgart 4.7% +1.0pp 255 -10% 2.7% -200 bp
Subdued development City Centre 4.7% +1.0pp 61 -19% 1.8% -20 bp
pipeline
Vaihingen-Möhringen 7.1% +5.6pp 53 -21% 2.5% -80 bp
Demand from diverse
occupier base
Stockholm Over a 1-2 year horizon, the Solna/Sundbyberg submarket is expected to
outperform in terms of rental growth. This submarket is popular due to its
relative affordability and the lack of available space in the Stockholm CBD. A
Sweden number of schemes have also recently been completed in Solna/Sundbyberg,
Solna/Sundbyberg (Arenastaden) boosting the submarket’s offering of modern space across large, efficient
floorplates. The area’s ongoing transformation, with new infrastructure
improvements (e.g. subway extension) and mixed-use schemes (e.g. Mall of
Scandinavia) will also play an increasingly important role in boosting the
area’s attractiveness, particularly around Arenastaden. Elsewhere, the Kista
submarket is more opportunistic and a longer-term play. While currently
oversupplied with older stock, conversions/refurbs and the expansion of the
tech cluster centred around Microsoft, Lenovo and other firms, could provide
some longer-term upside.
Key reasons for rental growth Annual Rental 2017 Take-Up Vacancy Rate
Growth 2017 (000 sq m) Q4 2017 (%)
Relative affordability 2017 v 2017 v 2017 v
vs CBD 2017 5Y Avg 2017 5Y Avg 2017 5Y Avg
Infrastructure Stockholm 12.9% +4.5pp 355 -18% 7.7% -110 bp
improvements
CBD 12.9% +4.5pp 41 -40% 2.6% -90 bp
Tech cluster
in Kista Solna/Sundbyberg 14.3% +6.3pp 81 -15% 7.4% -40 bp
Kista 0.0% -1.9pp 20 -44% 19.6% +430 bp10 European Office Rental Growth Hotspots 2018
Munich The Munich East submarket continues to see high levels of development
(refurbs and new builds) on the back of ongoing urban renewal. Despite this,
vacancy remains well below the long-term trend (-430 bps). Werksviertel,
Germany adjacent to the München Ost train station, has beneffited from a tight CBD
East (Wierksviertel) (1.1%) and become particularly popular with occupiers. Indeed, 7 of the
top 10 largest deals recorded in the East submarket in 2017 were in this
microlocation. While rents in East have increased by circa 40% over the last 5
years, affordability remains a key driver of demand, with prime space currently
transacting at a 43% discount to the CBD. 2017 annual rental growth in East
outperformed the 5-year average by 9.1% and we expect this trend to continue
over the next 12 months.
Annual Rental 2017 Take-Up Vacancy Rate
Growth 2017 (000 sq m) Q4 2017 (%)
Key reasons for rental growth 2017 v 2017 v 2017 v
2017 5Y Avg 2017 5Y Avg 2017 5Y Avg
Strong demand for
Werksviertel area Munich 4.2% +0.8pp 995 +40% 3.6% -280 bp
Affordability - 43% City Centre 4.2% +0.8pp 177 +13% 1.1% -150 bp
discount to CBD
East 13.5% +9.1pp 64 +10% 5.1% -430 bp
Vibrant mixed-use
precinct
Prague 2017 was an exceptional year for the Prague office market, with vacancy falling
to its lowest level since 2008 and annual take-up the strongest on record. In
the Prague 1 submarket, completions were relatively modest last year, with
Czech Republic only two buildings delivered totalling circa 14,300 sq m. This subdued supply
Prague 1 response is in part due to a lack of sites, and is expected to persist over the
next year. As a result of the limited available prime office product in the city
centre, robust demand and strong economic growth, we expect prime rents to
continue to increase in Prague 1 over the next 12 months.
Annual Rental 2017 Take-Up Vacancy Rate
Growth 2017 (000 sq m) Q4 2017 (%)
2017 v 2017 v 2017 v
2017 5Y Avg 2017 5Y Avg 2017 5Y Avg
Key reasons for rental growth Prague 5.0% +5.0pp 418 +98% 7.4% -560 bp
Vacancy below 5Y avg Prague 1 (CBD) 5.0% +5.0pp 44 +19% 8.0% -700 bp
(-700 bp)
Lack of sites restricting
development
Strongest demand on
record in 2017Want to know more?
Our research clearly underlines the increasing importance of office space availability in driving future rental growth in the
next three to four years. Understanding the relationship between vacancy rates and net effective rents therefore provides a
valuable tool in the armoury of investors looking to identify rental growth prospects
For more information or to request a presentation of our full ranking and analysis please contact one of the team.
EMEA
Peter Hensby Gemma Kendall
Head of Pan-EMEA Office Capital Markets Director
+44 207 399 5422 +44 207 087 5226
peter.hensby@eu.jll.com gemma.kendall@eu.jll.com
Czech Republic Dublin
Mike Atwell John Moran
Head of Capital Markets CEE International Director - Capital Markets
+420 227 04 3191 +353 86 260 8783
mike.atwell@eu.jll.com john.moran@eu.jll.com
Germany Netherlands
Marcus Lütgering Dré van Leeuwen
Head of Office Investment Germany Head of Capital Markets
+49 89 290088 158 +31 20 5407912
marcus.luetgering@eu.jll.com dre.van-leeuwen@eu.jll.com
Poland Sweden
Tomasz Puch Joacim Sjöberg
Head of Office and Industrial Investment Poland Head of Capital Markets Nordics
+48 22 167 0025 +46 0 702 40 72 05
tomasz.puch@eu.jll.com joacim.sjoberg@eu.jll.com
UK Research
Alistair Meadows Alexander Colpaert
Head of UK Capital Markets Head of EMEA Offices Research
+44 207 852 4092 +31 650 671 152
alistair.meadows@ eu.jll.com alex.colpaert@eu.jll.com
Andrew Burrell Benjamin Russell
Head of Economics & Forecasting Senior Analyst - EMEA Research
+44 203 147 1180 +44 207 852 4402
andrew.burrell@eu.jll.com benjamin.russell@eu.jll.com
capitalmarkets.jll.com | jll.eu/research
© 2018 Jones Lang LaSalle IP, Inc. All rights reserved. The information contained in this document is proprietary to JLL and shall be used solely for the purposes of evaluating this
proposal. All such documentation and information remains the property of JLL and shall be kept confidential. Reproduction of any part of this document is authorized only to the
extent necessary for its evaluation. It is not to be shown to any third party without the prior written authorization of JLL. All information contained herein is from sources deemed
reliable; however, no representation or warranty is made as to the accuracy thereof.You can also read


