NORTH AMERICAN GAS OUTLOOK TO 2030 - H1 2019 - MCKINSEY
←
→
Page content transcription
If your browser does not render page correctly, please read the page content below
North American Gas Outlook to 2030
H1 2019

Executive summary   Demand outlook to 2030          Supply outlook to 2030               Price outlook to 2030        Historical recap: 2005 to 2017     2

Executive summary

                                             Demand                                                 Gas flows and price volatility
                                             • US and Canadian LNG exports account for              • Appalachia expected to displace WCSB & Rockies
                                               ~60% of demand growth and will reach ~20 bcfd          in the Midwest and serve the southern Mid-
                                               by 2030                                                Atlantic

                                             • Coal retirements will provide upside to gas          • Permian expected to limit Appalachian flows
                                               demand in the near term but renewables will            south and will help meet USGC demand
                                               start to displace gas post-2025, although total
                                               demand continues to grow                             • Pipe build, especially from Appalachia, expected
                                                                                                      to continue to decrease volatility

                                             Supply                                                 Price
                                             • Appalachia will increase production to ~55 bcfd      • Shale has unlocked enough supply to keep prices
                                               and supply ~40% of the North American market           ~$2.75/mmbtu over the longer term, with likely
                                               by 2030                                                bias to the downside

                                             • Associated gas, primarily from the Permian, is
                                               expected to increase production by ~12 bcfd and
                                               supply 25% of the N. American market by 2030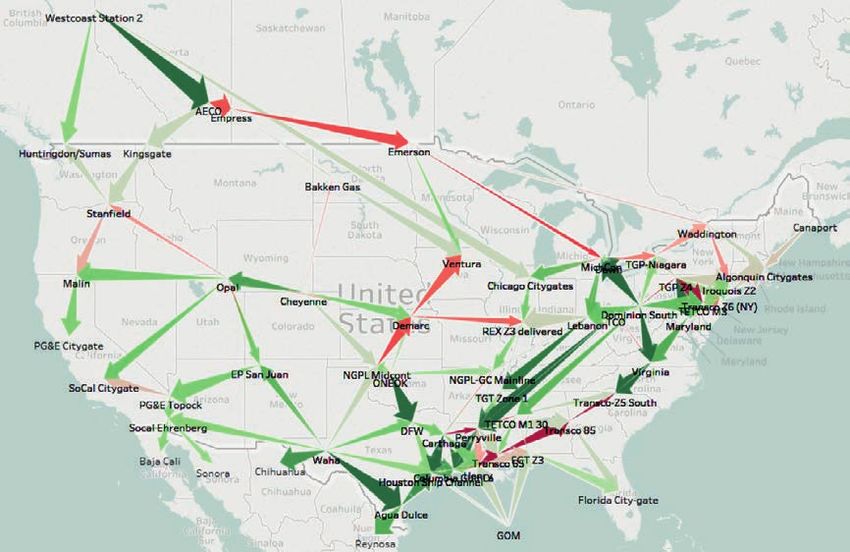
Executive summary                Demand outlook to 2030             Supply outlook to 2030                        Price outlook to 2030                       Historical recap: 2005 to 2017      3

North America gas demand expected to grow at a modest ~2% p.a.,
driven by strong exports, despite peak demand for power in sight
Outlook
                                                                      North American gas demand1                               LNG and Mexico export      Power                 CAGR      CAGR
                                                                      bcfd                                        Residential, commercial, industrial and others2             2018-25   2025-30
Mexico export 2.7 bcfd of demand growth, new takeaway
pipelines, less LNG imports, and flat local production results in
                                                                                                                                                      +1.7%
higher US exports to Mexico                                                                                                                            p.a.
                                                                                                                       +2.7%                    126
                                                                                                                           p.a.         122 124
LNG export US and Canadian LNG projects are competitive,                                                                    115
                                                                                                                                119 120
                                                                                                                                        22   24  27
                                                                                                                    113 114     20   20                                        13.8%      8.8%
even in a long global LNG market, leading to utilization rate                                               107 109 17   17 18
                                                                                                        103     15
being maintained above 70%                                                                     96
                                                                                                    100
                                                                                                         12
                                                                                                            14
                                                                                         91         10                      35  37   37 37   36  35
                                                                             88    90           7               34   35  35
                                                                       85                 6              32 33                                                                  2.4%     -0.1%
                                                                                                    31
Power Expected to grow another 5 bcfd as additional ~70 GW of          2
                                                                             3     4
                                                                                   29    27
                                                                                               30
                                                                             28
gas capacity comes online by 2025, but will flatten from 2026 as       23

it faces strong competition from renewables
                                                                                                                61    61          61   62   62   62   63      63   63   63
                                                                       60                58    59    59   60
                                                                             57    57                                                                                           0.8%      0.3%
Residential and commercial Expected to stay flat as floor space
growth is mostly offset by continued efficiency improvements

Industrial Growth will be driven by increasing use of gas as a
feedstock in producing methanol and ammonia

Pipe, plant and lease fuel Use of gas at fueling compressor            14 15 16 17 18 19 20 21 22 23 24 25 26 27 28 29 30
stations and lease sites is expected to grow slightly as              1 Dry gas consumption in US and Canada 2 Includes pipe, plant, lease, and natural gas vehicles (NGVs)
production grows                                                      Source: McKinsey Energy Insights Global Energy Perspective Model; EIA; NEB
Executive summary                           Demand outlook to 2030                       Supply outlook to 2030                  Price outlook to 2030        Historical recap: 2005 to 2017       4

~70% of North American gas demand growth is linked to global
drivers, mostly through LNG exports
US and Canadian gas demand growth by sector (2018-2030)
bcfd                                                                                                                           Comparison to H1 2018 view   % of overall demand growth 2018-2030

                            LNG Canada taking FID                        Additional coal and nuclear retirements led to
                           led to higher LNG exports                             higher gas demand for power

                                        12.2                          2.9                       3.3                  3.6                   0.3                 0.7                 115.8

                                                                                                                     3.5                                       1.2                 125.8
                                                                                                5.3
                                        17.4                          2.7
                                                                                                                                          -0.2                                     29.9
           95.9
                                                                                                                                                                                   95.9

                                                                            Deep dives follow

           2018                         LNG1                       Mexico1                  Power                 Industrial      Residential/commercial      Other2               2030

                                        58%                           9%                        18%                  12%                  -1%                  4%

1 Direct export driven 2 Includes pipe, plant, lease, and natural gas vehicles (NGVs)
Source: McKinsey Energy Insights GEP Model; EIA; NEB
Executive summary Demand outlook to 2030 Supply outlook to 2030 Price outlook to 2030 Historical recap: 2005 to 2017 5
LNG and exports to Mexico
North American LNG exports will grow quickly until 2023 then
plateau until a second wave of capacity comes online from 2025
Short term (to 2021)
North American LNG capacity and demand outlook
• Global LNG supply overcapacity puts pressure on US liquefaction
bcfd Operating Under construction
capacity utilization, which has among the highest marginal costs. Pre-FID 90% capacity Demand
Post-FID
Balancing out global LNG overcapacity is equivalent to an average US 22
LNG capacity utilization rate of 70% from 2019-21 20
• Construction delays primarily at Cameron and Freeport prevent new 18
capacity from coming online until the global LNG market has 16 • Calcasieu Pass
recovered in ~2021
14 • Golden Pass 2
Mid term (2021-24) 12 • LNG Canada T1-2
• Corpus Christi, T3
• Slowdown in North American projects is expected from 2021-24 as 10 • Sabine Pass, T5
new international LNG supply comes online, primarily from Qatar
8
• Cameron
• US LNG exports are sensitive to global gas demand, as the marginal • Freeport
supplier to the Europe and Asia
6
• Elba Island
4 • Corpus Christi, T1-2
Long term (2025-30) 2
• Cove Point
• Post FID plants (LNG Canada, Golden Pass and Calcasieu Pass) come • Sabine Pass, T1-4
0
online in 20251 2018 19 20 21 22 23 24 25 26 27 28 29 2030
1 Assumes delays to start in mid-2025
• From 2028-29, there will likely be room for 2-3 most cost- 2 Assumes delays to start in mid-2025
advantaged LNG projects from North America to fill the global LNG Source: McKinsey Energy Insights; team analysis; press release
supply gapExecutive summary Demand outlook to 2030 Supply outlook to 2030 Price outlook to 2030 Historical recap: 2005 to 2017 6
LNG and exports to Mexico
Mexico’s dependence on US gas imports increases as gas demand
grows and domestic production declines
Gas demand
Gas demand Total Supply Total
• Gas demand will increase due to growth bcfd Other1 Industry Power growth bcfd LNG US piped imports Production growth
contribution contribution
in the industrial and power sectors 12 12
2018-30 2018-30
2020-30 2020-30
• Nearly 18 GW of new gas fired
+3% +3%
CCGTs expected to be added by 2020 10 p.a. 3% 10 p.a. -10%
2018-20 2018-20
effectively removing fuel oil from the
+6% +6%
power mix 8 p.a. 8 p.a.
51%
• Industrial demand growth is driven
by export oriented manufacturing as 6 6 80%
well as methanol/fertilizer projects
4 4
Gas supply
• In the long term, growth of US exports 46%
2 2
to Mexico will slow due to an increase 30%
in Mexico’s domestic production
0 0
18 19 20 21 22 23 24 25 26 27 28 29 30 18 19 20 21 22 23 24 25 26 27 28 29 30
• LNG is being displaced by US imports,
except for a small volume to prepare for
1 For example: residential, services and NGVs
an emergency Source: McKinsey Energy Insights; CRE; CFE; SENERExecutive summary Demand outlook to 2030 Supply outlook to 2030 Price outlook to 2030 Historical recap: 2005 to 2017 7
Generation, renewables and storage
Gas continues to gain market share from coal, despite facing more
competition from renewables post-2020
Key implications
US net generation mix CAGR
• As coal retires, gas generation increases to meet TWh Solar Wind Other Gas Coal 2016-30
1
evening and night time loads 5,000
+0.5%
• Gas demand for power generation continues to 4,500
p.a. 4,339
4,415 4,241
4,092 368 14%
grow until ~2025, but as high-efficiency CCGTs 4,000 61 126 155
217 330 424 592
replace existing low-efficiency OCGTs/CCGTs, gas 1,166
3,500 1,129 1,079 7%
consumption decreases despite growing generation 983
3,000
• Falling power storage costs are enabling 2,500 1,409 -1%
1,401 1,634 1,714
deployment of renewables at scale over a 10-20 year
2,000
timeframe, enabling solar and storage to replace gas
1%
for peaker plants 1,500
1,000 1,240 1,159
948
500 743
-4%
0
2018 2020 2025 2030
Gas demand
29 32 35 35 1.4%
bcfd
1 Other includes hydro, nuclear, oil, and coal co-fired with biomass, as well as biomass, waste, and geothermal
Source: McKinsey Energy Insights Global Power Model; EIAExecutive summary Demand outlook to 2030 Supply outlook to 2030 Price outlook to 2030 Historical recap: 2005 to 2017 8
Industry outlook
Industrial gas demand growth is limited except for chemicals
Key drivers
Industrial demand by sub-sector CAGR
• Industrial consumption will grow slowly over the bcfd Iron and steel Refining Mining/O&G extraction1 Chemicals/petrochemicals Other2 2018-30
next 10 years, with chemicals driving 60% of the
35 +1.0%
growth, as the use of gas as a feedstock in chemicals p.a.
increases, particularly in ammonia and methanol 30 30 30 31
29 29 29 30
30 28 28 29 2 2 2 2.4%
27 27 1 1 1 1
1 1 1 3 3 3
• Demand for gas in steel and iron will grow relatively 1 1 1 3 3 3 3 3 3
3 3 4 4
quickly due to increasing capacity of direct reduced 25 3 3 4 4 4 4
4 4 4 4 -0.3%
3 3 3
iron (DRI) facilities and increasing local steel 11 11 11 11 11
20 10 10 10 11
utilization driven by tariffs on imported steel 9 10 10
9 0.8%
15
1.8%
10 11 11 11 11 11 11 11 11 11 11 11 11 11
5 0.5%
0
2018 2019 2020 2021 2022 2023 2024 2025 2026 2027 2028 2029 2030
1 Includes oil sands 2 Agriculture, construction, metal, food processing, textile and leather, plastics, wood/wood products, non-specified
energy/ commercial/transformation, and paper
Source: McKinsey Energy Insights Global Energy Perspective; McKinsey Energy Insights Global Liquids Supply Model; EIA; CERI natural gas
market review 2016Executive summary Demand outlook to 2030 Supply outlook to 2030 Price outlook to 2030 Historical recap: 2005 to 2017 9
The Appalachian and Permian basins will supply ~53% of the
North American market by 2030, and represent 83% of the growth
A Appalachia
Total projected natural gas production
Production grows at 6% p.a. as the bcfd Other production
basin is debottlenecked in 2018-19 Tight and CBM
135 Conventional2
B Western Canadian
Sedimentary Basin (WCSB) 120 Associated gas1
Steady growth in Montney Other associated gas
105
production with possible upside Permian
D Eagle Ford
with Western Canadian LNG 90
SCOOP/STACK
C Haynesville 75 Niobrara
Renewed interest due to close C
60 Shale gas production
proximity to LNG export B
Other US Shale
terminals and attractive well Haynesville
45
economics Canada Shale
30 A Appalachia
D Associated gas/Permian
Permian production will increase 15
by ~7.2 bcfd from 2018 to 2030
0
2014 15 16 17 18 19 20 21 22 23 24 25 26 27 28 29 2030
1 Includes conventional and unconventional 2 Includes conventional gas basins, Alaska, and offshore
Source: EIA; McKinsey Energy Insights North American Supply ModelExecutive summary Demand outlook to 2030 Supply outlook to 2030 Price outlook to 2030 Historical recap: 2005 to 2017 10
In 2025, growing Appalachia and Permian production will push
Canadian and Rockies gas out of Midwest and Eastern markets1
Two dynamics are fundamentally changing how gas
Gas flow in 20251
moves in North America in 2025: Flow change compared to 2018, mmcfd -2,000 +2,000
Growing production from Appalachia, SCOOP/
STACK and the Permian
• An increase of 14 bcfd production from Appalachia
will back out Canadian and midcontinent gas
• Growing associated gas production in the Permian
and SCOOP/STACK areas will require additional
midstream build-out
Rising demand in US Gulf Coast market due to
LNG and Mexico exports
• Increases of ~17 bcfd demand by 2030 will require
new pipes to connect Northeast and west Texas
basins to the Gulf Coast 1 Average winter flow
in 2025 with arrows
• Increasing competition between WCSB and size proportional to
2025 flow volume
Rockies in the western market will keep western
Canadian prices low Source: EIA,
McKinsey analysisExecutive summary Demand outlook to 2030 Supply outlook to 2030 Price outlook to 2030 Historical recap: 2005 to 2017 11
Supply and demand drivers sustain current North America gas
prices in mid term but eventually lower gas prices in long term
Key factors Potential impact on gas price and gas price setting mechanism Lowers price Boosts price
Mid term (to 2025) Long term (post 2025)
Demand Power Coal retirements limit competition allowing regional gas prices Renewables displacing gas in the power sector, especially as
to rise higher before gas generation becomes regionally power storage becomes increasingly economic
uneconomic
Continued decline of renewable costs leads to additional
renewable generation
LNG LNG exports can increase by ~2 bcfd due to underutilized Global LNG supply/demand expected to tighten, increasing US
liquefaction capacity LNG plant utilization
Mexico Pipe capacity additions, CCGT and industrial investments in Falling solar costs and a rebound in indigenous production slow
Mexico will further boost Mexican consumption of US gas Mexican demand growth for US gas imports
Supply Appalachian supply As more pipeline infrastructure comes online post 2019, The second wave of new pipeline capacity addition in the
inexpensive Appalachian supplies will continue to grow and Appalachia, if realized, would lower gas prices nationally
limit price fly-up potential
Associated gas supply At $60/bbl, “zero cost” associated gas production could increase Associated gas production continue to increase, making up ~27%
by ~8 bcfd by 2025, most of which is expected from the Permian of US gas production by 2030
Drilling costs Drilling efficiency increases and new completion technology Drilling efficiency increases and new completion technology will
will lower well and service costs lower well and service costs
Net price impact $2.50 to $2.75 $2.25 to $2.75
mmbtu mmbtu Source: EIA, McKinsey analysisExecutive summary Demand outlook to 2030 Supply outlook to 2030 Price outlook to 2030 Historical recap: 2005 to 2017 12
Gas demand in North America was flat until 2009; since then, it
has grown at ~3% p.a. following a 70% drop in gas price
• Seasonal heating
North American gas demand by sector1 and Henry Hub price CAGR CAGR
and power continue bcfd Residential, commercial, industrial and others2 Power L&G and Mexico export Henry Hub price ($/MMBtu) 2005-10 2011-17
to drive the market,
with power driving
the most growth in 100 2.9% 9
p.a.
gas demand since 90 91
90 +0.6% 88 8
p.a. 83 85 4 6 N/A 47%
2005, an increase 78
81
2
3
80 75 1 2 29 27 7
of 10 bcfd 73 73 72 28
71 70 1 24 23
70 20 19 20 21 26 4.6% 3.3%
17 18 22 6
• North America 60
has transitioned 58 60 57 57 58 5
50 54 52 53 54 53 54 55 54
from being a LNG 4
importer to an 40
3
exporter 30 0.1% 1.0%
20 2
• Rapid growth rates
10 1
in gas exports to
Mexico have added 0 0
2005 2006 2007 2008 2009 2010 2011 2012 2013 2014 2015 2016 2017
6 bcfd in gas demand -10
Note: individual numbers may not equal total due to rounding 1 Net of balancing items 2 Includes natural gas vehicles; and pipe, plant, and lease fuel, which is gas used for pipeline fuel,
consumption at gas plants, lost during transportation, and for usage for compressors and equipment at lease sites
Source: EIA; NEB; NYMEX; McKinsey Energy InsightsExecutive summary Demand outlook to 2030 Supply outlook to 2030 Price outlook to 2030 Historical recap: 2005 to 2017 13
Gas supply shifted from conventional to unconventional; shale gas
grew at 25% p.a., reshaping the North American gas supply outlook
• Shale exploded from virtually nothing to become
US dry gas production1 % of total production
the driving force of gas supply. bcfd Shale Onshore2 Gulf of Mexico 2005 2017
• Gas production has remained resilient despite low 90
prices:
80
• High grading of drilling programs
70
• Increasing well design intensity in Marcellus
60
• Improved rig productivity (e.g., pad drilling, 5% 58%
drilling days) 50
• Infrastructure de-bottlenecking, releasing 40
choked wells
30
• Strong contribution from associated gas of light 20 75% 37%
tight oil plays
10
20% 4%
0
2005 2006 2007 2008 2009 2010 2011 2012 2013 2014 2015 2016 2017
1 Total dry gas production taken from EIA natural gas dry gas production file 2 Includes Alaska
Source: SOURCE: Drilling Info; EIA; Energy Insights North American Supply Model; Baker HughesExecutive summary Demand outlook to 2030 Supply outlook to 2030 Price outlook to 2030 Historical recap: 2005 to 2017 14
Shale gas boom has weakened gas prices into competition with
coal in the power sector, with prices declining by ~65% post 2008
US historical fuel prices
$/mmbtu1 Distillate – Gulf Coast #2 (LS diesel) Residual fuel oil (gulf 3% sulfur #6) Natural gas (Henry Hub) Central Appalachian coal
45
Competition with Competition with Transition Competition with coal,
heavy fuel oil heavy fuel oil distillate period gas-on-gas competition
40
Ample conventional gas supply competes Tightening gas supply competes Gas oversupply leads to
35 with heavy fuel oil in power generation with distillate and heavy fuel oil in prices declining by 65%,
power generation now competing with coal
30 in power generation
25
20
15
10
5
0
1990 1995 2000 2005 2010 2015 2018
1 Converted at heat content of 6.02 for Gulf Coast RFO, 5.72 for Gulf Coast No.2, 25 MMBtu/ton for Central Appalachian Coal, and 24 MMBtu/ton for Illinois Basin Coal; SOx, NOx or CO2 costs not included
Source: NYMEX; BloombergExecutive summary Demand outlook to 2030 Supply outlook to 2030 Price outlook to 2030 Historical recap: 2005 to 2017 15
Growing shale production in the Northeast has changed how
gas flows in the United States over the last decade
Growing shale production has changed the main
Major movements of piped gas across North America
supply areas
Exporting region Importing region Gas flow
• In 2008, gas in NA was mainly supplied by three 2008 2017
areas: the Gulf Coast (including Mid-Continent),
Western Canada, and the Rockies
• In 2017, significant growth in unconventionals has
made the Marcellus/Utica the largest gas producing
area
Growing demand in the Gulf Coast states has
since reversed the south to north flows of 2008
• TX and LA enjoyed the largest demand growth
of a combined 1.9 bcfd due to growing power and
industrial demand
• >2 bcfd of growth in export demand to Mexico over
the past three years has reversed flow directions
in South Texas, as gas now moves south through
Agua Dulce
SOURCE: McKinsey Energy Insights North America Gas Flow Basis Model; McKinsey Energy Insights North American Supply Model; EIAAbout us
We are a global market intelligence and analytics © Copyright 2019 McKinsey Solutions Sprl
This document contains proprietary information of McKinsey &
group focused on the energy sector. We enable Company and is intended for internal use by you and your company.
organizations to make well-informed strategic, Please do not reproduce, disclose, or distribute the information
contained herein without McKinsey & Company’s express prior
tactical, and operational decisions, using an written consent. Nothing herein is intended to serve as investment
advice or a recommendation of any particular transaction or
integrated suite of market models, proprietary investment, the merits of purchasing or selling securities, or an
invitation or inducement to engage in investment activity. While this
industry data, and a global network of industry document is based on sources believed to be reliable, McKinsey &
experts. We work with leading companies across Company does not warrant its completeness or accuracy.
the entire energy value chain to help them
manage risk, optimize their organizations, and
improve performance.
For more information about our North American Gas
Perspectives, please contact:
info_energyinsights@mckinsey.com
www.mckinsey.com/north-american-gas-outlookYou can also read