Natural Gas Price in Asia: What to Expect
←
→
Page content transcription
If your browser does not render page correctly, please read the page content below
Natural Gas Price in Asia: What to Expect

                             Kenneth B Medlock III, PhD
     James A Baker III and Susan G Baker Fellow in Energy and Resource Economics, and
    Senior Director, Center for Energy Studies, James A Baker III Institute for Public Policy
                         Adjunct Professor, Department of Economics

                                  Presentation at IMF

                                      March 27, 2014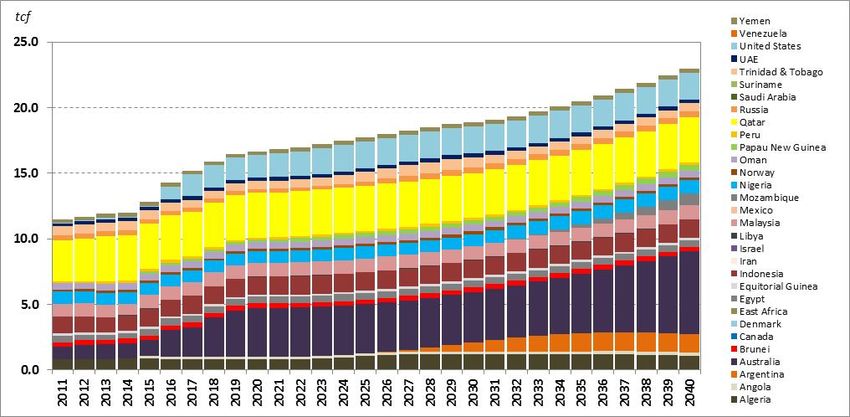
Rewind to 2003 – LNG is coming to North America
Then, shale happened in the US and Canada…

… and we realized shale resources are everywhere*

Major North American
     Shale Plays
     (~1,930 tcf)

                                                         European, Latin American, African
                                                              and Pacific Shale Plays
                                                                    (~4,670 tcf)

*Over 6,600 tcf of shale according to ARI report, 2011
Broad Implications of US Shale Gas
•   Expansion of production from US shale plays has left LNG
    import capacity in the US virtually empty.
•   It has had an impact on the relative price of oil and gas in the
    US, and it has raised the possibility of US LNG exports.
•   Of course, when evaluating overall market impacts, all supply
    and demand responses should be in focus, not just exports.
•   Shale gas makes the supply curve more elastic. This mitigates
    the potential for sustained long term increases in price and has
    implications for fungibility and price volatility.
•   Lower relative gas prices encourages gas demand in power
    generation over coal, lowers costs in refining and pet-chems,
    and encourages new uses in transportation.
                                                                       5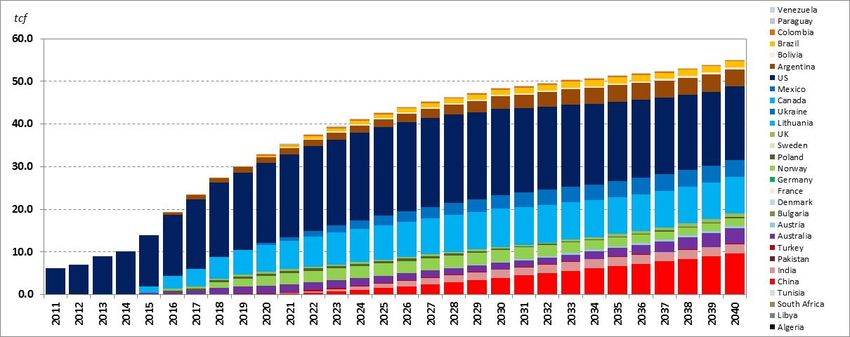
Let’s focus on the export question, in
particular with regard to Asian gas prices…

 What does economic theory suggest will
    happen to the Asian LNG price?

                                              6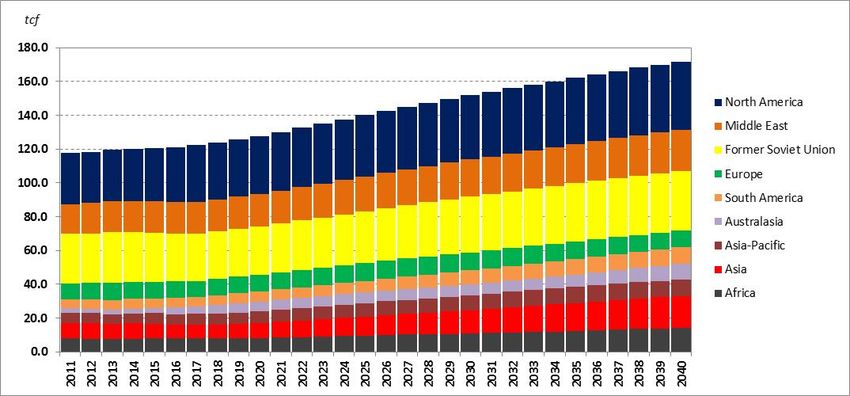
An international trade paradigm…
• With trade between two markets, price in each adjusts. The
  adjustment depends on the elasticities of supply and demand.
  P                                                   P

                                                                            S’     S’+ m

                                      S
                                                  Tf
                                                  P
                                                                           Imports, m
   Td
                                              τ
  P
                         Exports, x

                                                                      D’

                  D     D+x

                                          Q                                             Q
            Domestic Market                               Foreign Market                    7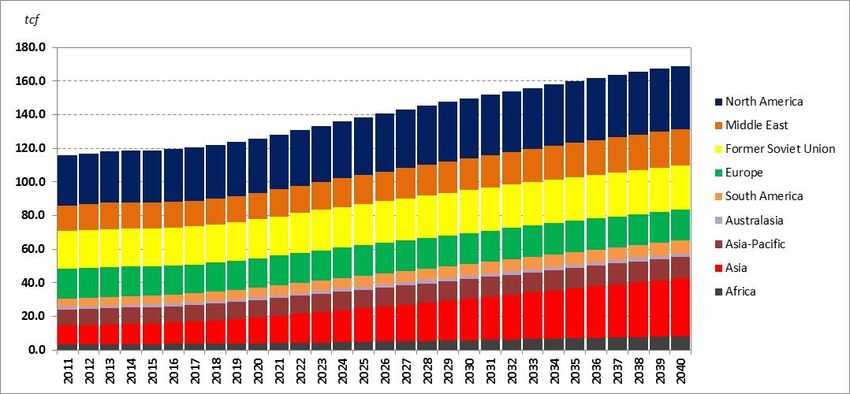
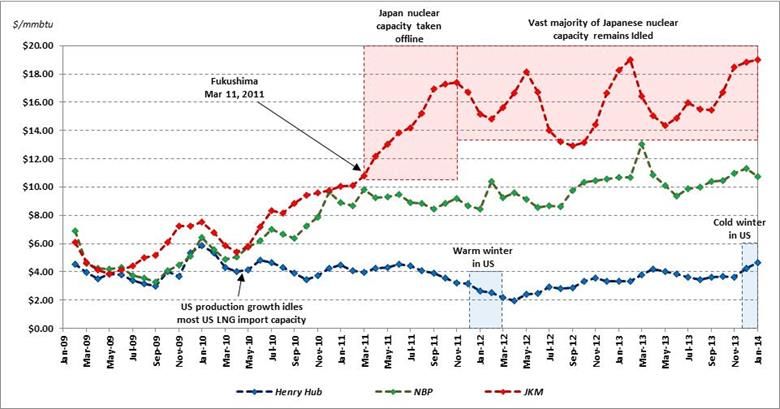
International natural gas spot prices
• Will the change in regional gas price relationships since March 2011 persist?
    -   Unexpected demand shocks in Asia and the US have exacerbated spreads

                                         Price data from Platts; LNG Oil-Index author’s calculation   8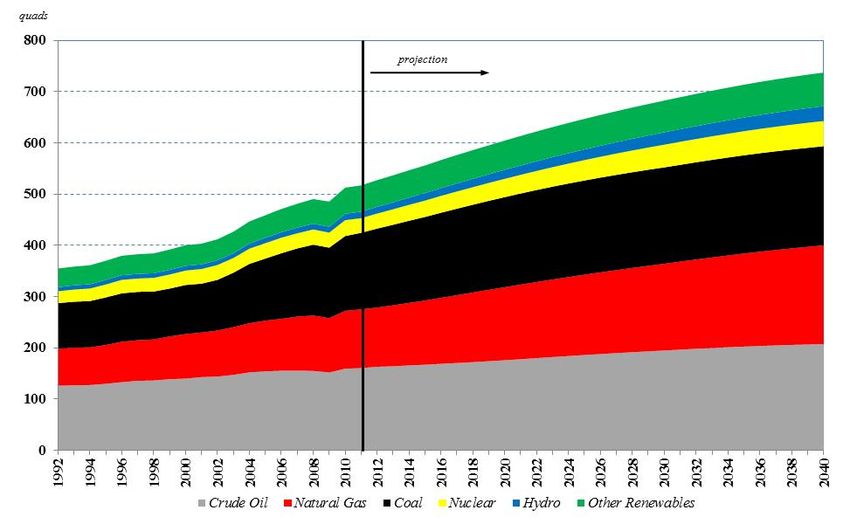
The Short Term
• A wide divergence in price is exactly what we should expect
  to see if the ability to deliver is constrained…
   - Increased Japanese demand in the wake of Fukushima is an
     unexpected demand shock, which stresses delivery capability.

                                                                    9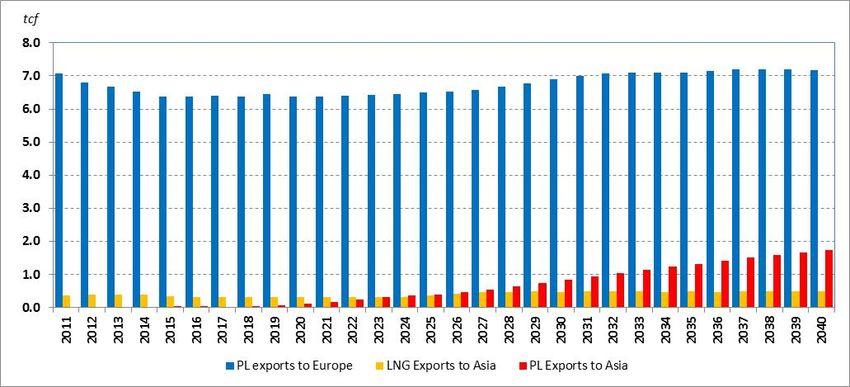
Moving past the short term
• US exports and other supplies to Asia will apply downward price pressure.
• This will be exacerbated by demand reductions and supplies from China
  shale, East Africa, Australia, Russia.

    P                                                 P
                                                                             S’   S’+ m

                             Price spread
                             prior to trade

                                                          Tf
                                       S              P
                                                  τ
       Td
   P
                          Exports, x
                                                               Imports, m
                                                                                  D’   D’+∆

                     D     D+x

                                              Q                                               Q
               Domestic Market                                              Foreign Market        10
Implications
• Lots of weight given to current international spot price, but
several factors are often ignored, such as
- short term capacity constraints and domestic market interactions
with markets abroad, and
- a weak US dollar.
• US LNG could put a lot of pressure on international price.
- Current filings exceed current global liquefaction capacity.
• In fact, it is questionable that the well-publicized Dow
position advocating limiting exports is optimal given the
company’s asset positions in Asia and Australia, particularly
since most of the price impact will occur at the point of the
constraint, which is in Asia.
• Prices will adjust, and greater liquidity will alter the market
paradigm in a substantial way. 11The Rice World Gas Trade Model
A tool for market analysis
12The Rice World Gas Trade Model (RWGTM):
A Forecasting Tool for Policy Analysis
• The RWGTM has been developed to examine potential futures for global
natural gas, and to quantify the impacts of geopolitical influences on the
development of a global natural gas market.
• The model predicts regional prices, regional supplies and demands and
inter-regional flows.
• Regions are defined at the country and sub-country level, with extensive
representation of transportation infrastructure
• The model is non-stochastic, but it allows analysis of many different
scenarios. Geopolitical influences can alter otherwise economic outcomes
• The model is constructed using the MarketBuilder software from Deloitte
MarketPoint, Inc.
– Dynamic spatial equilibrium linked through time by intertemporal optimization
– Capacity expansions are determined by current and future prices along with
capital costs of expansion, operating and maintenance costs of new and existing
capacity, and revenues resulting from future outputs and prices. 13The RWGTM: Demand
• There are over 290 regions
– Regional detail is dependent on data availability and existing
infrastructure.
– In US, sub-state detail is substantial and is based on data from the
Economic Census and the location of power plants.
• For example, 10 regions in Texas, 4 regions in Louisiana, 3 regions in
Massachusetts, 4 regions in California, etc.
– In Rest of World, sub-national detail varies based on infrastructure and
data availability.
• For example, 5 regions in India, 7 regions in China, 6 regions in Germany, 4
regions in the UK, 6 regions in France, 10 regions in Australia, 1 region in
Bangladesh, 1 region in Thailand, etc.
• Demand model links TPER to GDP and population with fuel
shares determined by relative prices and policy (RPS, nuclear,
etc.). Demand is projected for every country. 14TPER: World
• Summary of global TPER by energy source. Reported as a sum across all sectors, all
countries and all fuel sources.
15The RWGTM: Supply
• There are over 140 supply regions represented
• Natural gas resources are represented as…
– Conventional, CBM and Shale in North America, China, Europe and Australia,
and conventional gas deposits in the rest of the world. We incorporate the
analysis of the recent ARI assessment of shale around the world.
• … in three categories
– proved reserves (Oil & Gas Journal estimates)
– growth in known reserves (P-50 USGS and NPC 2003 estimates)
– undiscovered resource (P-50 USGS and NPC 2003 estimates)
– Note: resource assessments are supplemented by regional offices if available.
• North American cost-of-supply estimates are econometrically related to
play-level geological characteristics and applied globally to generate costs
for all regions of the world.
– Long run costs increase with depletion.
– Short run adjustment costs limit the “rush to drill” phenomenon.
– We allow technological change to reduce mining costs longer term 16Cost to Drill and Complete, 1960-2013
• Cost moves with oil price. A critical assumption in making projections is
the long term outlook for the cost environment.
17Global Shale Plays
• EURs estimated using geophysical data for known shale plays in North America
and econometrically fit for RoW shales.
• Drilling and Completion costs estimated using known North American plays and
econometrically fit to drilling depth. Adjustments are made regionally based on
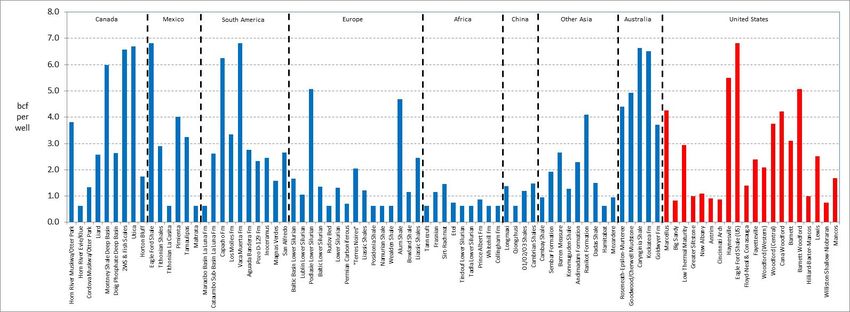
published information. 18Research on shale gas well performance…
• Well-specific EURs can vary within a shale play substantially
- Some wells are profitable at $2.65/mcf, others need $8.10… median is $4.85.
- This information is used to construct “tiers” within the resource plays.
EUR
2.83 bcf
1.51 bcf
0.93 bcf
19The RWGTM: LNG Shipping
• Changed the manner in which LNG shipping is modeled.
– Old approach: LNG is represented as a hub-and-spoke network, reflecting the
assumption that capacity swaps will occur when profitable.
– New approach: LNG is modeled as a point-to-point network where initial LNG
route capacities are calibrated to 2010 flows. As before, shipping rates are based
on lease rates and voyage time.
• Swaps are allowed to
occur, but shipping
capacity must be added
in order to implement.
• All possible shipping
routes and costs are
implemented. For
unknown routes, costs
were econometrically fit
to known data.
20RWGTM “Status Quo” Results
21Status Quo Case:
Demand by Super-Region, 2011-2040
• Asian demand sets the trend for global natural gas demand growth,
averaging over 4.1% growth per year through 2040.
Source: Baker Institute RWGTM February 2014 22Status Quo Case:
Supply by Super-Region, 2011-2040
• Sources of supply are more diverse than demand, with strong growth seen
where shale resources are developed – North America and Asia.
Source: Baker Institute RWGTM February 2014
23Status Quo Case :
Global Shale Production, 2011-2040
• North America accounts for the majority of shale gas, but long term growth
occurs in China and other markets aimed at serving China after 2020.
Source: Baker Institute RWGTM February 2014 24Status Quo Case:
LNG Imports by Country, 2011-2040
• Diversity in the LNG import picture, with China surpassing Japan in the
mid 2020s, and India emerging in the 2030s.
Source: Baker Institute RWGTM February 2014
25Status Quo Case:
LNG Exports by Country, 2011-2040
• Qatar and Australia account for over 40% of global LNG exports, and the US
enters in 2016 which drives price decline in Asia (later slide).
26
Source: Baker Institute RWGTM February 2014Status Quo Case:
Global Marker
Prices,
2011-2040
• The prices indicated
are spot prices
rather than contract
prices.
• Global prices
remain above the
US price, but trade
closes the spread.
27
Source: Baker Institute RWGTM February 2014Status Quo Case:
Price Spreads
and LNG Costs,
2011-2040
• Planned LNG
capacity yields a
reduction in price
differentials that
overshoots the mark
for profitable trade,
inclusive of fixed
costs. But, …
• … in Asia, further
demand growth
eventually makes
trade profitable.
28
Source: Baker Institute RWGTM February 2014Status Quo Case:
Russia eventually moves into Asia
• Russian market share in Europe declines initially, but strong demand pull
from Asia works to grow Russian volumes in both directions.
Source: Baker Institute RWGTM February 2014
29Questions/Comments
30Bonus Material
More on the impacts of LNG Exports:
Exchange Rates and Contracts – LNG price in
Asia will fall, and when it happens, it will
happen fast!
31The Effect of the Exchange Rate
• Another factor that is important to the export issue is the
exchange rate. In fact, this matters for US industrial sector
competitiveness as well.
- Exchange rate impacts: PUS − PUK ⋅ XR ⋅ HR =
arb value
Trade-Weighted Value of US $, Major Currencies (Daily, Jan 1973 – Jan 2013)
Source: US Federal Reserve Bank 32Contracts and Liquidity
• Absent storage and physical The Supply Curve Effect of Shale and Implications for Price
liquidity, oil indexation
provides an element of price P
certainty.
• Oil indexation is a form of price Implied additional rents
associated with existing
discrimination contracts
- (1) Firm must be able to S
distinguish consumers and POIL INDEX
prevent resale. S
- (2) Different consumers have P@ P=MC
different elasticity of demand.
• Increased ability to trade Effect of shale on the
between suppliers and supply curve
consumers (physical liquidity)
violates condition (1). Oil Indexed “Spot” D
Contract Volume
- This will happen in a liberalized
market, or as LNG trade grows, Total Volume
Q
or as hubs emerge in end-use
markets. 33Contracts and Flows
• Atlantic Basin LNG diverted…
- short term volumes expand
• … Pacific Basin LNG expands.
- short term volumes expand
Data Sourced from the International Group of Liquefied
Natural Gas Importers (GIIGNL)
34More on US LNG Exports
• Export capacity will be built on the expectation that rents from arbitrage
will “pay” for the fixed cost.
- But, some terminals will not earn the ex-ante required rate of return,
contingent on the off-take agreement and who bears risk.
• Expect seasonal flows. If seasonal price differences among the regional
markets are sufficient, US exports will be profitable during those periods.
This serves to dampen volatility everywhere.
• US LNG exports will link global markets to storage in the US.
Thus, liquidity will spill over and contribute to very different
market paradigm. This will be felt most heavily in Asia.
• The Asian gas market is about to be become substantially deeper
over the next 5-10 years.
35A comment on long term prices
While we should recognize that there will be demand-driven
volatility, the extremes and durations are likely to be mitigated
relative to history. The nature of production and becoming
connected to the international market will each enhance
fungibility. Anything that lowers the incentives to invest in the
upstream will work against this. Indeed, we are where are
today due to the unique regulatory frameworks that exist in the
US gas market with regard to accessing resource development
opportunities and transporting natural gas to end-users.
36Effects on Price Volatility?
• Gas has traditionally been more volatile than oil and coal.
• Economic theory predicts this. The more fungible (or tradable) a
commodity is, the lower its price volatility, all else equal.
• We see this in microcosms historically at traded hubs after pipeline
expansions in North America.
• The demand for storage? Counterintuitively, it should go up. 37So what about the foreign opportunities for
shale? Not as Fast. The US is Unique.
• Stable and conducive regulatory and institutional frameworks.
- Resource Access – mineral rights ownership; acreage acquisition; resource
assessments; environmental opposition; etc.
- Market Structure – transportation regulation (unbundled access vs.
incumbent monopolies) and bilateral take-or-pay obligations vs. marketable
rights; existence of infrastructure; pricing paradigms; etc.
• Many other issues face shale development.
- Water – use in production; water rights and management; flowback options
(recycle and/or treatment and disposal) and native infrastructure; concerns
about watershed protection (casing failures and fracture migration); etc.
- Other issues – earthquakes related to injection of produced and treated
water; long term effects of methane escape; concerns about contamination
from produced water; ecological concerns over land use and reclamation; etc.
• BUT, other supplies do not face the same impediments
38
- East Africa, Australia, Russia…You can also read