RESULTS Q3 2019 ANALYST CONFERENCE CALL CEWE STIFTUNG & CO. KGAA OLDENBURG NOVEMBER 13, 2019 - CEWE IR
←
→
Page content transcription
If your browser does not render page correctly, please read the page content below
Results Q3 2019
Analyst Conference Call

CEWE Stiftung & Co. KGaA

Oldenburg
November 13, 2019
This presentation contains forward-looking statements that are based on
    current assumptions and forecasts of the management of CEWE.
    Known and unknown risks, uncertainties and other factors could lead to
    material differences between the forward-looking statements given here
    and the actual development, in particular the results, financial situation
    and performance of our Company. The Company assumes no liability to
    update these forward-looking statements or to conform them to future
    events or developments.
    All numbers are calculated as exactly as possible and rounded for the
    presentation. Figures may not sum to 100, because of rounding.

2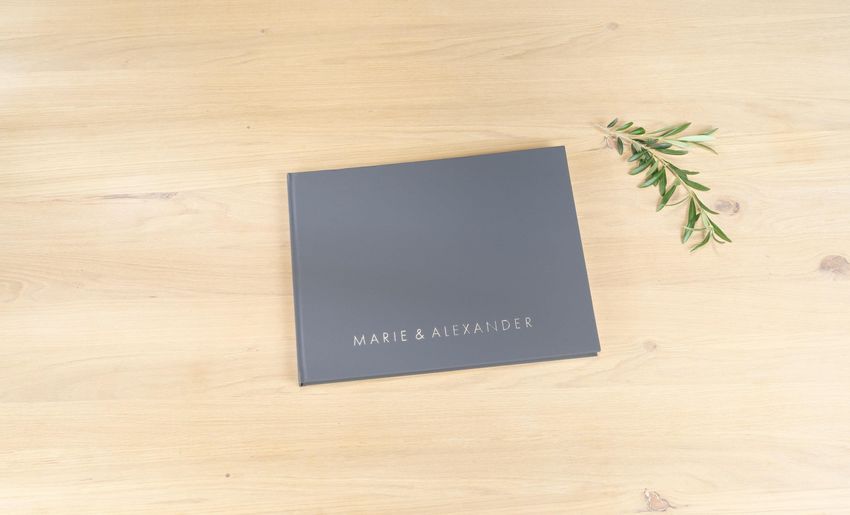
Dr. Olaf Holzkämper   Dr. Christian Friege
    CFO                   CEO

3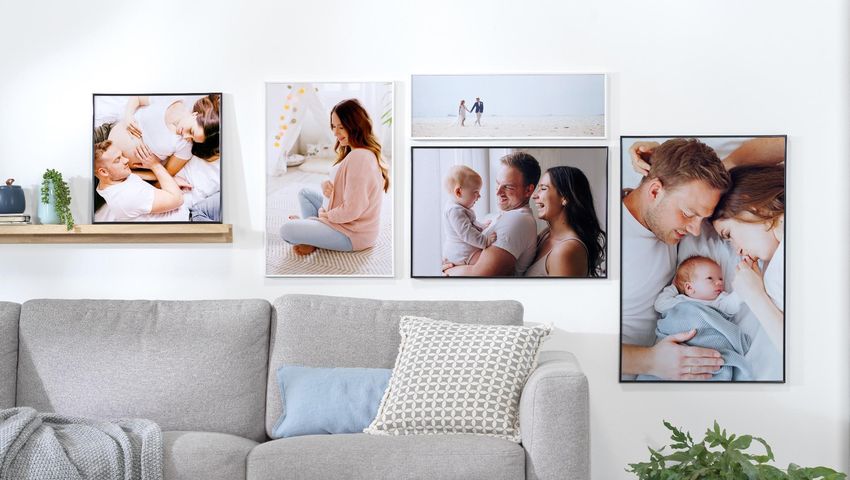
At a glance: Q3 2019
      ▪       Turnover in the Photofinishing business segment grew by an outstanding 15.7% to 116.2
              million euros. Photofinishing contributed with an EBIT of 1.4 million euros despite a negative
              contribution of the acquisitions in total (EBIT Q3 2018: 2.6 million euros **). The CEWE
              PHOTOBOOK sales volume increased by a strong 6.4% with 1.4 million copies. A good third
              quarter.

      ▪       Commercial Online-Print grows by 3.9%, to turnover of 24.8 million euros. More than
              anything else, weak LASERLINE sales as a result of price pressure slows down the growth.
              EBIT improved by 0.9 million euros to -0.8 million euros (Q3 2018: -1.7 million euros **).

      ▪       Including futalis Group EBIT is exactly on previous year’s level. CEWE Group EBIT * (without
              futalis) in the third quarter at 0.2 million euros (Q3 2018: 0.6 million euros **).

            Q3 confirms the targets for 2019: EBIT is to rise to up to 58 million euros

          Rounding differences may occur.
          * EBIT without futalis as “discontinued operation” acc. to IFRS 5
          ** adjusted prior-year figures based on the finalisation of purchase price allocations for Cheerz and Laserline

4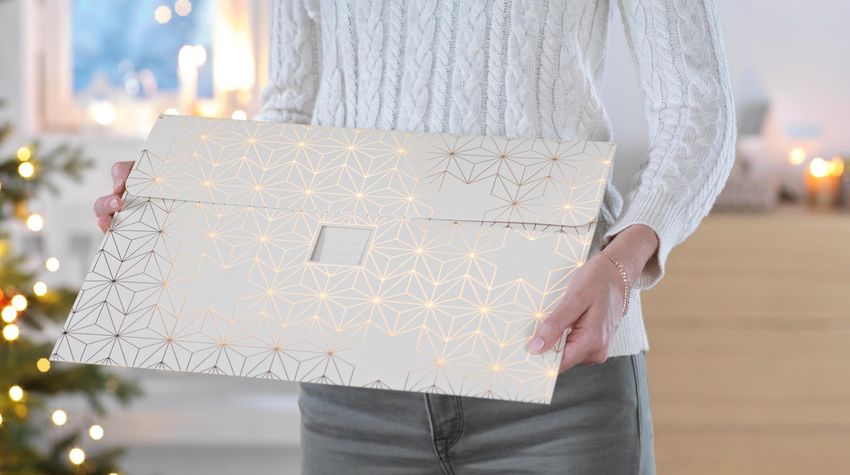
Highlights Q3                               Q3 2018   Q3 2019   Comment
Photofinishing
Sales Volume                  in photo m.    513.7     549.6    ▪   Also third quarter increases and confirms volume target for 2019
Turnover                      in EUR m.      100.5     116.2    ▪   Turnover increases organically and also through the WhiteWall acquisition
EBIT                                          2.6       1.4     ▪   EBIT fully in line with ongoing shift in seasonality

Commercial Online-Print
Turnover                      in EUR m.      23.9      24.8     ▪   Saxoprint more than compensates weak Laserline sales as a result of price pressure
EBIT                                         -1.8      -0.8     ▪   Clear EBIT improvement in spite of Laserline development
Retail
Turnover                      in EUR m.      11.8      10.2     ▪   Focus on profitability and photofinishing reduces hardware sales
EBIT                                         -0.1      -0.1     ▪   EBIT on previous year’s level and traditionally negative in third quarter
Other (incl. futalis acc. to IFRS 5)
Turnover                      in EUR m.       1.0        1.4    ▪   Contains structure and company costs and the result from real estate holdings and
EBIT                                          -0.7      -0.3        investments
                                                                ▪   futalis improves revenue and profit situation
Group (without futalis acc. to IFRS 5)
Turnover                      in EUR m.      136.2     151.2    ▪   Turnover up by strong 11.1%, EBIT with special income in PY
EBIT                                          0.6       0.2     ▪   “futalis” classified acc. to IFRS 5 (“discontinued operation”) in current year and PY
                                                                ▪   Previous year's figure updated due to finalization of purchase price allocations
Free Cash Flow                in EUR m.       2.8       5.4     ▪   Cash flow from operating activities increased due to positive business development

ROCE                          %              14.5      15.8     ▪   ROCE increased and remains strong (ROCE before IFRS 16 amendment at 18.2%)
Equity ratio                  %              52.6      46.2     ▪   Solid equity ratio, decline due to IFRS 16 first-time adoption (before IFRS 16: 52.8%)
                                                                                                                       Rounding differences might occur.

         Also Q3 confirms the annual targets for 2019
5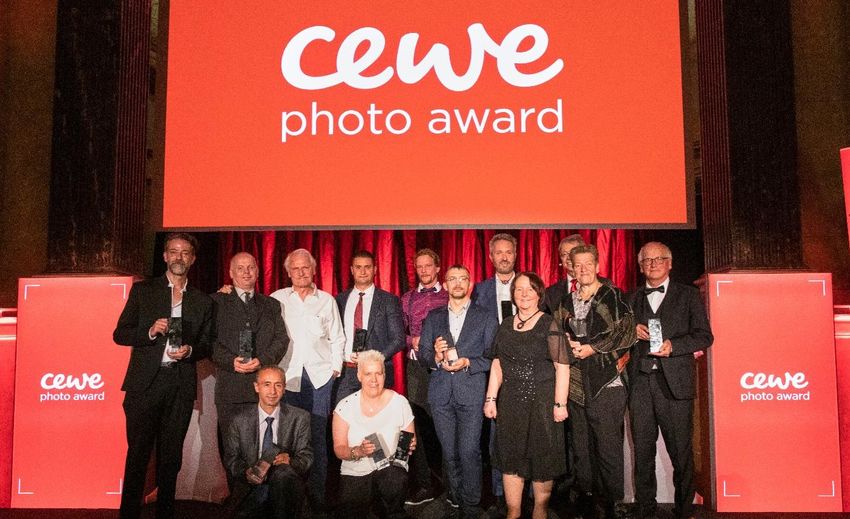
Agenda

       1. Results

          - Photofinishing

          - Commercial Online-Print

          - Retail

          - Other

          - Group

       2. Financial Report

       3. Outlook

6
CEWE Photo Award 2019: The Winners

7
CEWE Photo Award 2019: The Winners

8
PR-Clippings: CEWE Photo Award 2019

           […] Goodwin ist Jurorin des diesjährigen CEWE
           Photoawards: In den über 400.000 Teilnehmern sieht
           sie 400.000 Unterstützer ihrer Revolution: „Ich will,
           dass mich die Fotos umwerfen.“ […]

 9
CEWE’s omni-channel solution: Customer centric
                   THE CUSTOMER
                   CAN ORDER:                    PICKUP:

                       AT HOME

                                                   MAILORDER

                       IN STORE

                                                    IN STORE

                      ANYWHERE

10
Order at CEWE: Anytime & anyplace
The customer can choose from 4 order channels:
DESKTOP
IN-STORE ONLINE APP
SOFTWARE
• True self service for • Easy, convenient • Fully functional software • Intuitive, quick and easy
customers, simple for store in-browser option with extensive editing features • In-app Photo editing
staff to manage • Includes 6 months • Ideal for larger photo books • Automatic layout function
free project storage • Save projects offline selecting multiple photos
• Integrated iOS- and Android
• Photo editing options • Include QR codes for Videos • Options for personalisation
card reader
• Automatic layout function in photo books with text and clip-art
• Easy, fast and intuitive
selecting multiple photos • Full range of products available
• New, attractive creative
• Personalisation available • Pre-made templates
output products
with text and clip-art
• Cover highlights
• Assistant available
11In-store @ CEWE PHOTOSTATION 12
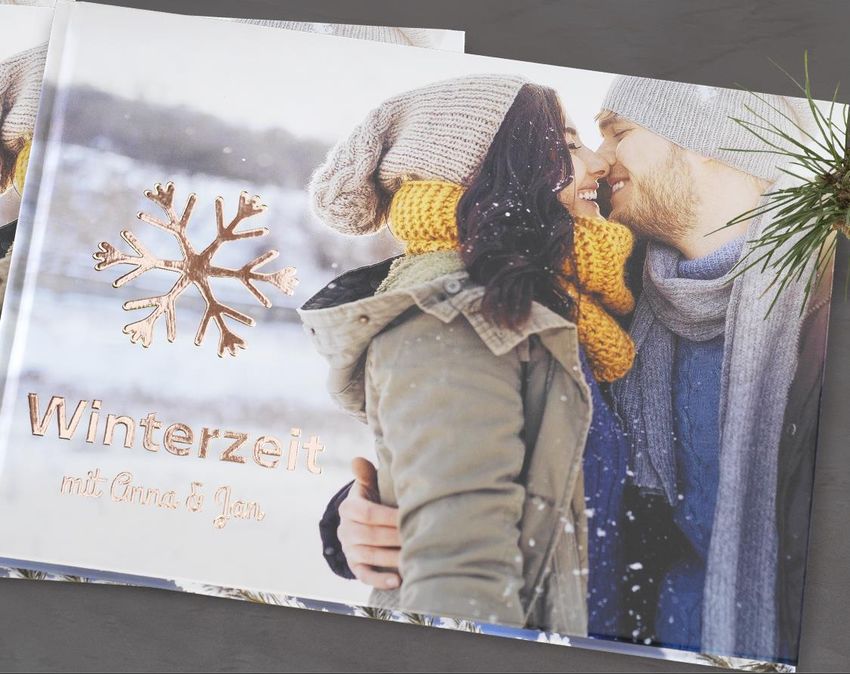
CEWE PHOTOBOOK
                                                  with leather and linen cover

The new leather and linen covers provide for an outstanding visual and haptic
experience. They are also an elegant way to protect your most cherished
memories. You can customize your CEWE PHOTOBOOK by adding text and clip
arts as special highlights on the front and back cover.
CEWE PHOTOBOOK
Hardcover with highlights in rosé-gold
Highlights in rosé-gold are now available as new design elements.
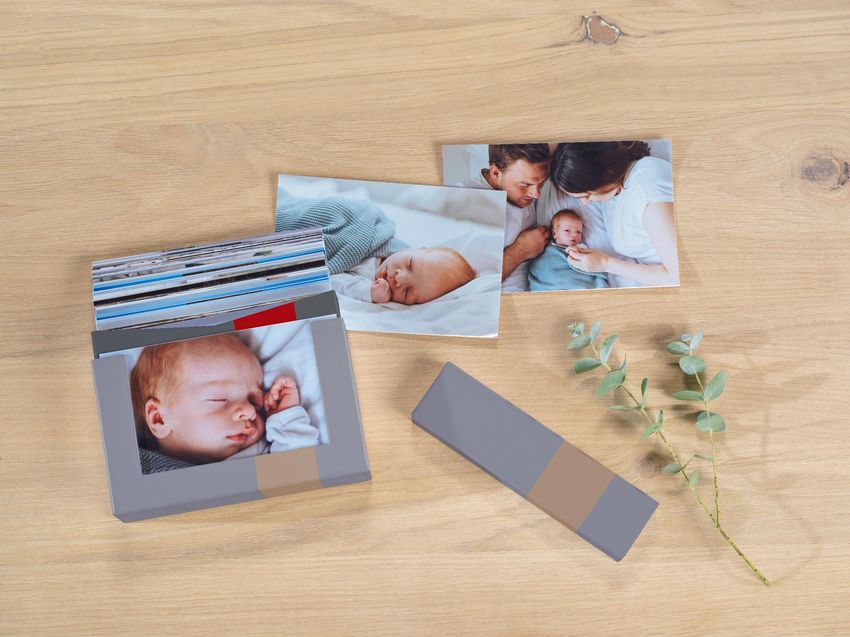
This allows for new markets and target groups to be opened up.Memory Boxes
Boxes containing photos
Design
The photo box is perfect as a gift, for storage, or decoration and its
Front Back introduction helps to improve competitiveness. Customers can
choose which photo they would like to insert at the front as a title,
making it a customizable product.CEWE CALENDAR
Gift packaging A3
New additional item
We have added a new additional item to our CEWE CALENDAR range: stylishly
sophisticated gift packaging. The ideal option for our customers to wrap their
Christmas presents in attractive high-quality packaging.Poster in plastic frame
New material
Available for 10 different Poster formats: plastic frames in slightly
glossy black or white! With convenient acrylic glass and mounting
bracket.Photo magnet – square Enjoy your best pictures every time you open the fridge or put up your shopping list.
Photo magnet – heart

Colourful variety made easy: your most cherished
memories in a cute heart shape.
Advent calendar with
                                      kinder® Surprise Eggs

Intended for further development of the successful cooperation with
Ferrero and for optimising the advent calendar product range.
Photo gifts Sporting your personal image, the enamel cup is likely to become your new favourite cup!
Photo gifts
                                   Premium textiles

Your personal shopping assistant: customize the
premium tote with your photo!
Photo gifts Premium textiles
Number of prints and turnover Photofinishing Q3

                                 +7.0%         Value per photo                            Turnover photofinishing Q3
     Total prints               Target 2019:                                     +8.1%                                                    +15.7%
     in millions                +0% to +2%     Turnover/photo                             in euro millions
                                               (Euro cent / photo)

     557.4                                                                        21.14                                        116.2
             528.5   531.7           549.6                               19.55
                             513.7                               18.11
                                                         18.05
                                                 16.42                                           95.4    96.3       100.4
                                                                                          91.5

     2015    2016    2017    2018    2019                                                 2015   2016   2017        2018       2019
                                                                                                        Rounding differences may occur.

        Rising share of value-added-products increases turnover per photo once again

25
Number of prints and turnover Photofinishing Q1-Q3
Total prints Value per photo Turnover photofinishing
in millions +6.9% Turnover /photo +5.6% Q1-Q3
Target 2018: +12.9%
+0% to +2% (Euro cent / photo) in euro millions
1,459 1,453 1,509 21.00
1,394 1,412 19.88
18.04 18.94 316.9
16.42 262.0 264.0 280.8
239.6
2015 2016 2017 2018 2019 2015 2016 2017 2018 2019 2015 2016 2017 2018 2019
Rounding differences may occur.
Volume development exceeds expected range
Rising share of value-added-products increases turnover per photo
26CEWE PHOTOBOOK
Number of CEWE PHOTOBOOKS Q3 Number of CEWE PHOTOBOOKS Q1-Q3
in thousands in thousands
+6.4% +7.6%
Target 2019: Target 2019:
+1% to +2% 3,973 +1% to +2%
3,832
3,663 3,640 3,692
1,383 1,357 1,361 1,407
1,322
2015 2016 2017 2018 2019 2015 2016 2017 2018 2019
Rounding differences may occur.
CEWE PHOTOBOOK with decent growth – more than expected
2760 millionth CEWE PHOTOBOOK
▪ Bestselling photo book in
Europe
▪ CEWE customer Lydia Reich
ordered the 60 millionth
CEWE PHOTOBOOK at
trading partner BIPA in Austria
▪ Since 2005, the CEWE
PHOTOBOOK has been a
bestseller
Thomas Lichtblau (BIPA), Lydia Reich and Ewald Hahn (CEWE)
28Turnover by Quarter – Photofinishing
Seasonal distribution: CEWE 2015 to 2019 – Share in turnover by quarter as a million
218.3
190.0 195.4
175.3
116.2
94.5 103.5 97.2 91.5 95.4 96.3 100.4
75.5 85.5 85.6 81.1 82.1 85.9
72.6
2015 2016 2017 2018 e2019 2015 2016 2017 2018 e2019 2015 2016 2017 2018 e2019
2019 2015 2016 2017 2018 e2019
2019
Turnover
target 2019 Q1 Target Q2 Target Q3 Target Q4
approx. 97.1 to 104.0 Euro mill. 88.4 to 94.3 Euro mill. 101.4 to 108.2 Euro mill.
520 to 555 m€*
✓ ✓ ✓
Q1 Actual Q2 Actual Q3 Actual
103.5 Euro mill. 97.2 Euro mill. 116.2 Euro mill.
* Planned group turnover w/o target turnover of segments retail, commercial online-print and other.
Rounding differences may occur.
29Business segment Photofinishing Q3
in Euro millions
● Q3 photofinishing grows by a strong 15.7%. Former core CEWE
Turnover business grows significantly, even without Cheerz and WhiteWall
+15.7% (initial consolidation in June 2019).
91.5 95.4 96.3 100.4 116.2
● As expected, current Q3 EBIT continues the series of seasonal
(shift)-related declines in Q3 photofinishing earnings
● Additional marketing expenditure not noticeable in overall income
2015 2016 2017 2018 2019
● Q3 2019 special effects: -0.65 million euros
EBIT – PPA effects from DeinDesign purchase price allocation: -0.1 million euros
– PPA effects from Cheerz purchase price allocation: -0.5 million euros
3.8 5.6 4.1 2.6 1.4
● Previous year Q3 2018 special effects: -0.66 million euros
– PPA effects from DeinDesign purchase price allocation: -0.1 million euros
2015 2016 2017 2018 2019 – PPA effects from Cheerz purchase price allocation: -0.4 million euros
– Sales revenue from the operation in Nuremberg: 1.2 million euros
+4.1% +5.9% +4.3% +2.6% +1.2% of turnover – Non-recurring costs for the photokina trade-show presentation -1.3 million
euros
Photofinishing grows in core business, with acquisitions also
Rounding differences may occur
driving increase in sales
As expected, Q3 contribution to EBIT falls short of previous year
30Business segment Photofinishing Q1-Q3
in Euro millions ● Q1-3 photofinishing grows by a strong 12.9%. Without Cheerz
and WhiteWall, former core CEWE business also grows
significantly.
Turnover +12.9%
● The first nine months started with another stronger first quarter,
316.9 followed by a second quarter with the weather "more order-
239.6 262.0 264.0 280.8 friendly" resulting in renewed growth, contrary to the trend of
seasonal shifting in previous years. The third quarter also sees
this development continuing, with growth in core business and
2015 2016 2017 2018 2019 through acquisitions.
● Photofinishing grows positively despite transaction costs for the
EBIT WhiteWall acquisition and (also as a result of these costs) still
negative WhiteWall and also Cheerz earnings contributions.
6.1 5.7
3.2 ● Q1-3 2019 special effects: -1.8 million euros
2.2
0.8 – PPA effects from DeinDesign purchase price allocation: -0.3 million euros
– PPA effects from Cheerz purchase price allocation: -1.5 million euros
2015 2016 2017 2018 2019
0.4% +2.3% +2.1% +0.8% +1.0% of turnover ● Previous year Q1-3 2018 special effects: -1.7 million euros
– PPA effects from DeinDesign purchase price allocation: -0.3 million euros
– PPA effects from Cheerz purchase price allocation: -1.3 million euros
Photofinishing grows strongly – Sales revenue from the operation in Nuremberg: 1.2 million euros
– Non-recurring photokina trade-show presentation costs -1.3 million euros
EBIT improved in spite of contributions to earnings
Rounding differences may occur
from acquisitions that are still negative
31EBIT by Quarter – Photofinishing
Seasonal distribution: CEWE 2015 to 2019 – EBIT share by quarter as a percentage
2015 2016 2017 2018 e2019 2015 2016 2017 2018 e2019
96.8% 96.1%
87.9% 89.5%
2.3% 2.5% 2.4% 4.5% 9.3% 10.7% 7.6%
0.4% 4.5%
2.0%
-0.9% 2015 2016 2017 2018 e2019
-5.1% -0.9% -3.1% -3.5% 2015 2016 2017 2018 e2019
EBIT target 2019
Photofinishing Q1 target Q2 target Q3 target Q4
50.5 to 57.5 +2.3 to +2.6 Euro mill. -1.8 to -2.0 Euro mill. +1.0 to +1.2 Euro mill.
Euro mill.
✓ ✓ ✓
Q1 actual Q2 actual Q3 actual
+3.0 Euro mill. -1.3 Euro mill. +1.4 Euro mill.
51.0-58.0 Euro million targeted Group EBIT before segments retail, online printing and other .
Rounding differences may occur
32Agenda
1. Results
- Photofinishing
- Commercial Online-Print
- Retail
- Other
- Group
2. Financial Report
3. Outlook
33The CEWE online print brands
Brand awareness Industrial Printer Small editions Metropolregion
CEWE Berlin
Business and advertising prints: flyers, business cards, stationery, packaging, promotional items, etc.
34Business segment Commercial Online-Print Q3
in Euro millions ● Commercial online printing (COP) increases by 3.9% in the third
quarter. Weak LASERLINE sales, mainly as a result of price
pressure, continue to put a damper on growth. Without
Turnover LASERLINE, COP grows more than reported in Q3, in spite of the
+3.9% fact that price pressure in Germany in general continues to restrain
stronger growth.
23.9 24.8
18.7 19.7 20.2
● Reported EBIT improves by 0.9 million euros to -0.8 million euros
(Q3 2018: -1.8 million euros). At the same time, almost half of this
2015 2016 2017 2018 2019 improvement results from operative progress; in addition,
integration costs have occurred at LASERLINE in the previous year.
EBIT ● More than anything else, weak sales-related LASERLINE earnings
prevent an even greater EBIT improvement for COP
0.4 ● Q3 2019 special effects: -0.1 million euros
– PPA effects from Saxoprint purchase price allocation: -0.1 million euros
-0.4 -0.3 -1.7 -0.8 (rounded off)
2015 2016 2017 2018 2019 – PPA effects from Laserline purchase price allocation: -0.1 million euros
(rounded off)
-1.9% -1.6% +2.0% -7.3% -3.4% of turnover
● Previous year Q3 2018 special effects: -0.6 million euros
– PPA effects from Saxoprint purchase price allocation: -0.2 million euros
COP turnover continues to increase in Q3 as well – PPA effects from Laserline purchase price allocation: -0.1 million euros
–
Negative LASERLINE contribution prevents EBIT Laserline integration costs: -0.3 million euros
Rounding differences may occur.
from improving even more
35Business segment Commercial Online-Print Q1-Q3
in Euro millions ● Commercial online printing increases by 2.4% in Q1-3. At the same
time, weak LASERLINE sales, mainly as a result of price pressure,
put a damper on growth, Without LASERLINE, COP continues to
Turnover grow more than reported in the first nine months, in spite of the fact
+2.8% that price pressure in Germany continues to restrain stronger growth
in general.
55.0 60.8 60.7 73.0 75.1
● Reported EBIT improves by 1.3 million euros to -2.3 million euros
2015 2016 2017 2018 2019 (Q1-3 2018: -3.6 million euros). Besides the operative progress
made, the improvement in this case mainly results from lower PPA
effects than in the previous year and from LASERLINE integration
EBIT costs that have occurred in the previous year.
● More than anything else, weak sales-related LASERLINE income
0.5 0.2
prevents COP EBIT improvement from being even greater
● Q1-3 2019 special effects: -0.4 million euros
-2.5 -3.6 -2.3
– PPA effects from Saxoprint purchase price allocation: -0.2 million euros
2015 2016 2017 2018 2019 – PPA effects from Laserline purchase price allocation: -0.2 million euros
-4.6% +0.8% +0.4% -4.9% -3.0% of turnover ● Previous year Q1-3 2018 special effects: -1.5 million euros
– PPA effects from Saxoprint purchase price allocation: -0.5 million euros
– PPA effects from Laserline purchase price allocation: -0.3 million euros
COP turnover increases by 2.8% in first nine months – Laserline integration costs: -0.8 million euros
Rounding differences may occur.
Negative LASERLINE contribution prevents EBIT from improving more
36Agenda
1. Results
- Photofinishing
- Commercial Online-Print
- Retail
- Other
- Group
2. Financial Report
3. Outlook
37CEWE´s retail business
▪ 147 retail stores
▪ EUR 48.7 million revenue (2018) with
photo-hardware (cameras, lenses, …)
▪ Sales of photofinishing products in
photofinishing segment
Retail segment contains hardware revenue only, photofinishing revenue is shown in photofinishing segment
Own retail business provides an excellent window to the market
38Business segment Retail* Q3
in Euro millions
Turnover*
-13.2% ● Retail hardware sales further reduced strategically (through
15.1 focussing on photofinishing business and abandoning low-
12.9 13.0 11.8 10.2
margin hardware business)
2015 2016 2017 2018 2019
EBIT*
0.0 ● Focus on margins sees earnings at exactly the same level as
in the previous year in spite of a significant drop in turnover
-0.1 -0.1 -0.1 -0.1
● Q3 EBIT traditionally at zero or just below zero for seasonal
2015 2016 2017 2018 2019 reasons
* Only hardware, no photofinishing .
-0.3% +0.2% -0.5% -0.9% -1.1% of turnover Rounding differences may occur
Hardware turnover in Q3 reduced in line with strategy
Q3 EBIT negative as expected for seasonal reasons and stable
in spite of a decline in turnover
39Business segment Retail* Q1-Q3
in Euro millions
Turnover*
-10.9%
43.5 ● Retail hardware sales further reduced strategically (through
40.2 38.0 35.1 31.2 focussing on photofinishing business and abandoning low-
margin hardware business)
2015 2016 2017 2018 2019
EBIT*
● Focus on margins sees earnings at exactly the same level as
in the previous year in spite of a significant drop in turnover
-0.4 -0.4 ● For seasonal reasons, EBIT traditionally negative in the first
-0.8 -0.8
-1.4 nine months of the year
2015 2016 2017 2018 2019
* Only hardware, no photofinishing.
-3.2% -0.9% -1.2% -2.3% -2.5% of turnover
Rounding differences may occur.
Q1-3 hardware turnover reduced in line with strategy
EBIT at the same level as in the previous year and
negative as expected for seasonal reasons
40Agenda
1. Results
- Photofinishing
- Commercial Online-Print
- Retail
- Other
- Group
2. Financial Report
3. Outlook
41Business segment Other Q3 Structural and corporate costs and profits arising from real
estate property and the acquisition of stocks are shown in the
business segment Other.
in Euro millions futalis is reported in this business segment since the business
activities cannot be allocated to the other business segments.
+42.9%
Turnover
1.4
1.0
0.8
0.6
0.2 ● The 1.4 million euros in reported turnover is to be solely
allocated to futalis (Q3 2018: 1.0 million euros, +42.9%)
2015 2016 2017 2018 2019
EBIT
● EBIT improvement mainly results from operative progress at
-0.6 -0.8 -0.9 -0.7 -0.3 futalis
Rounding differences may occur
2015 2016 2017 2018 2019
Segment for other business increases turnover and earnings
mainly as a result of the positive futalis development
42Business segment Other Q1-Q3 Structural and corporate costs and profits arising from real
estate property and the acquisition of stocks are shown in the
business segment Other.
in Euro millions futalis is reported in this business segment since the business
activities cannot be allocated to the other business segments.
Turnover
+41.2%
4.0
2.2 2.8
1.5 ● The 4.0 million euros in reported turnover is to be solely
0.2
allocated to futalis (Q1-3 2018: 2.8 million euros, +41.2%)
2015 2016 2017 2018 2019
EBIT
● EBIT improvement mainly results from operative progress at
futalis
-1.3 -2.2 -2.3 -1.7 -1.5
Rounding differences may occur
2015 2016 2017 2018 2019
Segment for other business increases turnover and earnings
mainly as a result of the positive futalis development
43Agenda
1. Results
- Photofinishing
- Commercial Online-Print
- Retail
- Other
- Group
2. Financial Report
3. Outlook
44Turnover
Q3 +11.3% Q1-Q3 +9.1%
Real: +11.2% Real: +9.3%
in euro millions in euro millions
388.8* 423.2*
4.0
364.6 364.9 2.8
338.4 1.5 2.2 31.2 Retail:
0,2 35.1 -10.%
40.2 38.0 75.1 (real: -9.2%)
Retail: 43.5 72.9
-13.2% 60.8 60.7
151.2* (real: -11.5%) 55.0
128.6 130.3 136.2* Commercial
125.5 1.4 Online-Print :
0.2 0.6 0.8 1.0 10.2 Commercial +2.8%
12.9 13.0 11.8 24.8 Online-Print: (real:+2.7%)
15.1 23.9 316.9
18.7 19.7 20.2 +3.9% 280.8
239.6 261.9 263.9
(real: +3.9%)
96.3 100.4 116.2 Photofinishing :
91.5 95.4
+12.9%
Photofinishing:
(real: +13.0%)
+15.7%
(real: +15.4%)
2015 2016 2017 2018 2019 2015 2016 2017 2018 2019
Photofinishing Commercial Online-Print Retail Other
* Acc. to IFRS 5 the CEWE Group EBIT is reported without
discontinued operations futalis which is still reported within
segement Others.
Especially segment Photofinishing accounts for growth Rounding differences may occur
in group turnover
45EBIT
Q3 Q1-Q3
in euro millions in euro millions
0.5
0.2
-2.2
-2.3
-0.8 -0.4
-0.4
-0.3 6.1 4.1 5.7
4.5
0.4
-0.9 3.2 -2.3
3.2
-0.1 2.2 -3.6
-0.6 -0.8
-0.1
-0.4 3.6 -1.5
5.6
-0.7 -2.5
2.7 4.1 -0.8 -0.6*
3.8 -0.1
2.6 -1.7
-0.3 -1.4
-1.7 -0.1 -4.4
1.4
-0.8 -1.3
0.8
-2.4*
0.6* 0.2*
2015 2016 2017 2018 2019 2015 2016 2017 2018 2019
* Acc. to IFRS 5 the CEWE Group EBIT is reported without
discontinued operations futalis which is still reported within
EBIT exceeds previous year by improvements in segement Others.
Rounding differences may occur
segements Photofinishing and Commercial Online-Print
46EBIT CEWE Group
Q1-3 distribution of earnings in comparison to Q4 EBIT increase in Q4
in euro millions in euro millions
2013 2014 2015 2016 2017 2018* e2019*
target
51-58 area
51.6
58.1 to
42.9 46.1
58.6 Non-recurring effect
40.8 of PPA asset
37.3 depreciation 7.8**
33.6 6.7 would lead to
4.7 58 m. euros
3.7 3.4 2.2 3.1
3.6
0.5 Development in
Q4 EBIT required
4.1 3.2 to reach the
-4.6 -4.8 -4.4 -0.6 annual target
-2.4
EBIT Q1-3 EBIT Q4 -6.5 would lead to
51 m. euros
Q4 EBIT must increase by only 0.5 m. euros to reach the upper end of the EBIT target range
Even a significant decrease of Q4-EBIT would lead into the targeted EBIT range for 2019
* EBIT 2018 and 2019 acc. to IFRS 5 without the discontinued operation „futalis“
** EBIT increase Q4 2018 calculated without futalis-EBIT in Q4 2017 (-4.2 euro millions)
47Agenda
1. Results
- Photofinishing
- Commercial Online-Print
- Retail
- Other
- Group
2. Financial Report
3. Outlook
48Consolidated profit and loss account Q3
Figures in millions of euros Q3 2018 Q3 2019 ∆% ∆ m€ Sales growth in photofinishing (organic and through M&A)
Revenues 136.2 151.2 11.1% 15.1 and commercial online printing exceeds strategic
Increase / decrease in finished and unfinished goods 0.3 0.1 -74.7% -0.2 strategic reduction in retail
Other own work capitalised 0.2 0.2 41.0% 0.1
Other operating income 6.1 5.4 -11.2% -0.7 In 2018 profit from sale of the operation in Nuremberg
Cost of materials -40.3 -43.6 8.2% -3.3
Gross profit 102.4 113.3 10.7% 10.9 Increase in expenses driven by business increase
Personnel expenses -41.0 -45.8 11.6% -4.7
Other operating expenses -50.7 -54.1 6.8% -3.5 Increase in personnel expenses driven by acquisition
EBITDA 10.7 13.4 25.7% 2.8 of WhiteWall akquisitioin effect. Last year photokina,
Amortisation/Depreciation -10.1 -13.2 31.3% -3.2 last year leases before IFRS 16
Earnings before interest, taxes (EBIT) 0.6 0.2 -65.6% -0.4
Financial income 0.0 -0.1 -643% -0.1 Warm up effect for christmas season and WhiteWall
Financial expenses -0.2 -0.3 42.7% -0.1 WhiteWall aquisition effect
Financial result -0.2 -0.5 115% -0.3
Earnings before taxes (EBT) 0.4 -0.3 -165% -0.7 Increase of depreciation caused by first time adoption
of IFRS 16 (Leasing)
Rounding differences may occur.
49Balance sheet as of 30 September
Assets Liabilities Bücker Equity ratio before
in euro millions 514.6 in euro millions 514.6 IFRS 16 = 52,8%
IFRS 16 first time application
+64.5 m€ in Fix assets,
acquisition of WhiteWall
407.0 +27.6m€ in goodwill 407.0
+8.2 m€ tecnical equipment = 46.2%
237.5
342.9 342.9 Equity ratio
308.5 308.6 308.5 308.6
376.3 = 52.6%
214.1 = xx,x%
Equity ratio
279.2 EK-Quot
218.8 194.0 IFRS 16 first time
160.7 175.4 94.2 application +54.3 m€
189.9 189.1 Equity non-current lease
Non-current assets 35.8 liab.,
+10.0 m€ current
38.3 lease liab.
Non-current liabilities 30.8
33.5
182.9
138.3 157.1 Liabilities WhiteWall
118.6 119.5 124.1 127.8 Current liabilities 109.5 118.1 +4.2m€,
Current assets 99.7 purchase price
liabilities
WhiteWall +7.4 m€ WhiteWall +2.7m€,
liabilities from
2015 2016 2017 2018 2019 2015 2016 2017 2018 2019 VAT and income tax
+3.4 m€
Rounding differences may occur
Balance sheet total increases due to first-time IFRS 16 application and WhiteWall acquisition
Equity ratio at 46.2% after balance sheet extension (as much as 52.8% before IFRS 16)
50From Accounting Balance Sheet to Management Balance Sheet
Balance Sheet Management Balance Sheet
Equity
Equity Non-current
Non-curent
assets
assets Non-current Gross financial
liabilities liabilities
Non-operating
Working Capital
liabilities
Current
Current assets Liabilities
Balance Sheet total: 399.7 m. euros
Balance Sheet total : 514.6 m. euros The Balance Sheet total is reduced to capital
elements „to be paid for“ (by way of dividends or
Non-interest-bearing liabilities reduce
current operative debts and transform interest) in the management Balance Sheet
currentassets to working capital :
Rounding differences might occur.
114.9 m. euros
51Management balance sheet as of 30 September
Capital Employed Capital Invested
in euro millions 399.7 in euro millions 399.7
304,3
255,0 IFRS 16 first time application
304.3 +64.5 m€ in Fix assets, 304.3
219,8 acquisition of WhiteWall
+27.6m€ in goodwill 237.5
255.0 +8.2 m€ tecnical equipment
255.0
222.1 219.8 222.1 219.8
IFRS 16 first time
376.3 214.0 application +54.3 m€
279.2 Equity non-current lease
194.0 liab.,
Non-current assets 218.8 160.7 +10.0 m€ current
189.9 189.1 175.4
lease liab.
123.6
56.2
Cash equivalents 13.0
Gross financial liabilities 33.2 30.6
15.3 13.7 12.5 10.9
10.2 38.6
15.4 Non operating liabilities 28.2
12,3% 33.5
12,7% 30.4
15,2% 34.1
11,9% 10,1%
Nett working capital 22.0 22.5 12.1 10.9 Pension accruals
+4,6 m€
2015 2016 2017 2018 2019 2015 2016 2017 2018 2019
Rounding differences might occur.
Balance sheet total increases due to first-time IFRS 16 application and WhiteWall acquisition
Without IFRS 16: Gross financial debt increases only by 3.1 million Euros
52Capital Employed I – T-3
Figures in millions of euros 30.06.2019 30.09.2019 ∆ % ∆ Mio. € Investments smaller than sum of operating
Property, plant and equipment 222.8 222.4 -0.1% -0.3 depreciation and depreciation of right of
Investment properties 17.4 17.3 -0.7% -0.1 use assets (IFRS 16)
Goodwill 87.3 87.3 0.0% 0.0
Intangible assets 28.9 27.9 -3.4% -1.0 Less investments in software
Financial assets 6.9 6.6 -3.9% -0.3
Non-current financial assets 1.3 1.3 4.4% 0.1 Fair value accounting of financial investments
Non-current other receivables and assets 0.2 0.2 -20.2% 0.0
Deferred tax assets 13.3 13.3 -0.1% 0.0 Strong business leads to stable inventories
Non-current assets 378.0 376.3 -0.5% -1.7 in spite of stocking up for Christmas season
Inventories 45.6 45.3 -0.6% -0.3 Slight increase by business volume and
Current trade receivables 43.5 44.1 1.3% 0.6 decreased days of sales outstanding
Operating gross working capital 89.1 89.4 0.4% 0.3
Current trade payables 54.2 60.1 11.0% 6.0 Business driven increase by sales growth
Operating net working capital 34.9 29.3 -16.2% -5.7 as well as by stocking up for Christmas
season
Rounding differences might occur.
53Capital Employed II – T-3 Figures in millions of euros 30.06.2019 30.09.2019 ∆ % ∆ Mio. € Investments smaller than sum of operating Assets held for sale 2.9 3.1 4.7% 0.1 Current receivables from income tax refunds 12.1 15.1 25.2% 3.0 Accounting of tax prepayments at balance Current financial assets 3.6 4.4 24.2% 0.9 sheet date Other Current receivables and assets 11.3 13.8 22.4% 2.5 Other gross working capital 29.8 36.4 22.0% 6.6 Mainly increase of VAT receivables Current tax liabilities 8.1 7.3 -10.0% -0.8 Current other accruals 3.9 4.3 10.5% 0.4 Reduction by tax payments Current financial liabilities 11.8 12.2 3.0% 0.4 Current other liabilities 29.4 30.5 3.8% 1.1 Liabilities held for sale 0.7 0.5 -24.1% -0.2 Increase of payroll liabilities for Christmas Other net working capital -24.0 -18.4 -23.5% 5.6 bonuses and performance-related bonuses Operating net working capital 34.9 29.3 -16.2% -5.7 Other net working capital -24.0 -18.4 -23.5% 5.6 Net working capital 10.9 10.9 -0.1% 0.0 Non-current assets 378.0 376.3 -0.5% -1.7 Net working capital 10.9 10.9 -0.1% 0.0 Free Cash flow increases cash and cash Cash and cash equivalents 12.0 12.5 3.9% 0.5 equivalents Capital employed 400.9 399.7 -0.3% -1.2 Rounding differences might occur. 54
Capital Invested – T-3
Figures in millions of euros                         30.06.2019 30.09.2019     ∆ in %∆ in Mio. €
Equity                                                    235.9      237.5      0.7%         1.6
Non-current accruals for pensions                           33.0       33.1     0.5%         0.2
Non-current deferred tax liabilities                         2.6        2.4    -6.7%        -0.2
Non-current other accruals                                   0.6        0.6    -1.3%         0.0
Non-current financial liabilities                            2.0        1.9    -7.9%        -0.2
Non-current other liabilities                                0.6        0.6    -1.9%         0.0
Non-operating liabilities                                   38.8       38.6    -0.5%        -0.2
Non-current interest-bearing financial liabilities           1.5        1.2   -14.4%        -0.2   Reclassification to current leasing liabilities
Non-current leasing liabilities                             55.7       54.3    -2.4%        -1.4
Current interest-bearing financial liabilities              59.1       58.0    -1.8%        -1.1   Repayment of short term financing liabilities
Current leasing liabilities                                 10.0       10.0    -0.1%         0.0
Gross financial liabilities                               126.2      123.6     -2.1%        -2.6
Capital invested                                          400.9      399.7     -0.3%        -1.2
Rounding differences might occur.

 55
Free cash flow Q3
       Cash flow from                                     Cash flow from                                               Free cash flow
       operating activities                               investing activities                                         in euro millions
       in euro millions                                   in euro millions
                                                                  2015       2016        2017       2018       2019
                                                                                                                           2015    2016     2017      2018      2019
       2015   2016     2017       2018      2019                                   Less inflows from financial
                                                                                   investments (-1,1 m€) and less
                                                                                   from sales of tangible assets
                                                                                    (-1,5 m€)

        6.8   9.5
                         5.4
                                   10.9
                                            14.8   +                                                                   =                               2.8       5.4

                                                                                                     -8.1       -9.4               -1.9
                                                                              -11.4
                                                                  -21.2                                                    -14.4
              Improved earnings situation
              (+2,8 m€).
                                                   Without the Saxopark
                                                   acquisition (27.9 m€) and the         -42.2                                              -36.8
                                                   new building in OL (2.2 m€),
                                                   the outflow of funds was
                                                   11.1 m€

                                                                                                                                          Rounding differences might occur.

        Cash flow from operative business mainly increased as a result of a positive development in business
        Reduced inflows from asset sales accompanied by stable investments in fixed assets

56
Consolidated free cash flow Q3 Figures in millions of euros Q3 2018 Q3 2019 ∆ % ∆ Mio. € (+) Improved earnings situation EBITDA 10.7 13.4 25.7% 2.8 Non-cash factors -2.1 -1.0 54.3% 1.1 (+) Decrease of trade debtors Decrease (+) / increase (-) in operating net working capital 1.5 5.7 287.9% 4.2 (+) Increase of trade payables due to stocking-up for Decrease (+) in other net working capital (excluding income tax items) 4.7 -0.5 109.7% -5.1 Christmas season Taxes paid -3.8 -2.9 24.2% 0.9 Interest received 0.0 0.0 157.1% 0.0 (-) Increase of VAT refunds Cash flow from operating activities 10.9 14.8 35.8% 3.9 Outflows from investments in fixed assets -11.3 -10.2 -9.6% 1.1 (+) Less investments in fixed assets Outflows (-) / inflows (+) from investments in financial assets 2.0 0.8 -57.0% -1.1 Inflows (+) outflow (-) from the sale of longterm financal assets -0.3 -0.1 -80.1% 0.2 (+) Less inflows from financial assets (previous year: Inflows from the sale of property, plant and equipment and intagible assets 1.5 0.0 -100.0% -1.5 sale of remaining shares of a start-up company) Cash flow from investing activities -8.1 -9.4 -16.3% -1.3 Free cash flow 2.8 5.4 91.9% 2.6 Rounding differences might occur. 57
ROCE
     as of September 30

       12-month-EBIT                       Average capital                           ROCE *
       in euro millions                    employed in the                           in %
                                           past 4 quarters                                                              ROCE without
                                                                                                                       IFRS 16: 18,2%
                                           in euro millions
                                    57.5                                                     20.6%
                                                                                                     19.5%
                                                                         363.2
               44.8   46.1                                                           15.9%                           15.8%

                                                                                 =
                             42.3                                291.8                                       14.5%
        33.0                                             236.9
                                           207.4 217.1

        2015 2016 2017 2018 2019            2015 2016 2017 2018 2019                 2015 2016 2017 2018 2019

                                                                                                 Rounding differences might occur.

        ROCE sees earnings-induced increase in spite of the rise in the average capital employed
        (due to the acquisition of WhiteWall and the first-time application of IFRS 16).
        ROCE before IFRS 16 amendment even as high as 18.2%

58
Agenda
1. Results
- Photofinishing
- Commercial Online-Print
- Retail
- Other
- Group
2. Financial Report
3. Outlook
59CEWE Group Targets 2019
Targets 2018 Target 2019 Change
Photos billion photos 2.23 2.22 to 2.26 0% to +2%
CEWE PHOTO BOOK millions 6.18 6.24 to 6.31 1% to 2%
Investments* Euro millions 49.6 around 55
Revenue Euro millions 653.3 675 to 710 3% to 9%
EBIT Euro millions 53.7 51 to 58 -5% to 8%
EBT Euro millions 53.3 50.5 to 57.5 -5% to 8%
Earnings after tax Euro millions 36.3 35 to 39 -5% to 9%
Earnings per share Euro 5.06 4.74 to 5.40 -6% to 7%
Rounding differences might occur.
* Operative investments without potential investments in expanding the business volume and,
for example, corporate acquisitions and/or additional customer-base acquisitions
Q3 confirms the target: EBIT is expected to rise to up to 58 Euro millions in 2019
60EBIT Development Would be achieved, if
EBIT LTM as of Sept. Q4 EBIT contribution …
in Euro millions 2019: 57.5 Euro millions 58 … increases by 0.5 m€
53.7* 51 … decreases by 6.5 m€
49.2
47.0
36.4
32.6
29.4 28.3 28.9
27.2
17.9
11.2
2008 2009 2010 2011 2012 2013 2014 2015 2016 2017 2018 e2019
EBIT-target for 2019 continues the trend of increasing earnings …
… and appears reachable
* 2018 reported EBIT, updated EBIT without futalis acc. to IFRS 5 at 55.7 euro millions
61Q&A-Session Q3 2019 Analyst Conference Call November 13, 2019
You can also read