2021 Interim Results Corporate Presentation - August 2021 - China LESSO
←
→
Page content transcription
If your browser does not render page correctly, please read the page content below
2021 Interim Results
Corporate Presentation

               August 2021
Disclaimer
The slides/materials used in this presentation are strictly confidential. The information contained in this presentation is being furnished to you solely for your information and may
not be taken away, reproduced, redistributed, or passed on, directly or indirectly to any other person (whether within or outside your organization/ firm), or published, in whole or
in part, for any purpose. The slides/ materials do not constitute an offer of securities in the United Kingdom, Australia, the PRC, United States, Canada or Japan. In particular,
neither the information contained in this presentation nor any copy hereof may be transmitted, reproduced, taken or transmitted into the United Kingdom, Australia, the PRC,
United States, Canada or Japan or redistributed, in whole or in part, directly or indirectly, within the United States or to any U.S. person. By attending this presentation, you are
agreeing to be bound by the foregoing restrictions and to maintain absolute confidentiality regarding the information disclosed in these materials. Any failure to comply with these
restrictions may constitute a violation of applicable securities laws.

These slides/ materials do not constitute an offer or invitation to purchase or subscribe for any securities and no part of it shall form the basis of or be relied upon in connection
with any contract, commitment or investment decision in relation thereto. The shares of China Lesso Group Holdings Limited (the “Company”) have not been, and will not be,
registered under the U.S Securities Act of 1933, as amended (the “U.S Securities Act”) or the securities laws of any state of the United States and may not be offered or sold within
the United States, except pursuant to an exemption from, or in a transaction not subject to, the registration requirements of the U.S. Securities Act and any applicable state or local
securities laws. There will be no public offering of the Company’s shares in the United States. This document shall not constitute an offer to sell or a solicitation of an offer to buy
the Company’s securities nor shall there be any sale of such securities in any state or country in which such offer, solicitation or sale would be unlawful prior to registration or
qualification under the securities laws of any such state or country. In Hong Kong, no shares of the Company may be offered to the public unless it is conducted in compliance with
the Securities and Futures Ordinance, Chapter 571 of the laws of Hong Kong and a prospectus in connection with the offering for subscription of such shares has been formally
approved by the Stock Exchange of Hong Kong Limited and duly registered by the Registrar of Companies of Hong Kong which contains all the information as required under
the Companies (Winding Up and Miscellaneous Provisions) Ordinance (Cap. 32) of the laws of Hong Kong and the Rules Governing the Listing of Securities on the Stock Exchange of
Hong Kong Limited. Any decision to purchase securities in any offering should be made solely on the basis of the information contained such prospectus or international offering
circular to be published in relation to such offering.

This presentation may contain forward-looking statements. Any such forward-looking statements are based on a number of assumptions about the operations of the Company and
factors beyond the Company’s control and are subject to significant risks and uncertainties, and accordingly, actual results may differ materially from these forward-looking
statements. The Company undertakes no obligation to update these forward-looking statements for events or circumstances that occur subsequent to such dates.

The information in this presentation should be considered in the context of the circumstances prevailing at the time of its presentation and has not been, and will not be, updated
to reflect material developments which may occur after the date of this presentation. The information is not intended to provide, and you may not rely on these materials as
providing a complete or comprehensive analysis of the Company's financial or trading position or prospects. Some of the information is still in draft form. This presentation also
contains information and statistics relating to the plastic pipes industry. The Company has derived such information and data from unofficial sources, without independent
verification. The Company cannot ensure that these sources have compiled such data and information on the same basis or with the same degree of accuracy or completeness as
are found in other industries. You should not place undue reliance on statements in this presentation regarding the plastic pipes industries. The information contained in this
presentation does not constitute a due diligence review and should not be construed as such. The information contained in these materials has not been independently verified.
No representation or warranty, express or implied, is made as to, and no reliance should be place on, the fairness, accuracy, completeness or correctness of any information or
opinion contained herein. None of the Company, or any of their respective directors, officers, employees, agents or advisers shall be in any way responsible for the contents hereof,
or shall be liable whatsoever (in negligence or otherwise) for any loss or damage whatsoever arising from use of the information contained in this presentation or otherwise arising
in connection therewith and none of them shall owe you any fiduciary duty in relation to this presentation.

                                                                                                                                                                                           2
Agenda

         01 Results Highlights

         02 Financial Review

         03 Business Review

         04 Outlook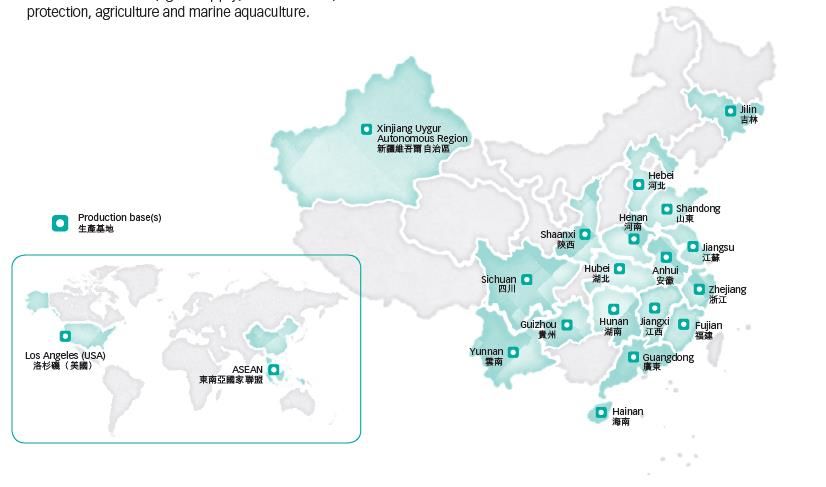
Results highlights
➢ Taking advantage of the domestic economic
  recovery in the post-pandemic era, the Group
  actively advanced the development of its various
  business segments and successfully broadened
  its revenue base, achieving steady business
  growth in 1H2021
    ➢ Revenue: RMB14.723 billion, + 28.1%
    ➢ Gross profit: RMB4.374 billion, + 29.4%
    ➢ Profit attributable to the owners of the ➢ Actively grasped opportunities arising from the
       Company: RMB1.814 billion, + 30.7%               “New Infrastructure, New Urbanisation Initiatives
                                                        and Major Projects” and economic stimulus
    ➢ Interim dividend: HK12 cents per share            package, helped boosting its sales volume of plastic
       (1H2021: HK12 cents per share)                   pipes and pipe fittings
                                                          ➢ Sales volume of plastic piping systems :
                                                             1.1773 million tonnes, +8.8%
                                                          ➢ Revenue:RMB12.574 billion, +24.0%
                                                     ➢ Gradually upgraded and built smart factories
                                                        integrating with the Internet of things, intelligent
                                                        control and automated production across the
                                                        country to realize the smart manufacturing of
                                                        products with both quality and efficiency improved
                                                                                                           4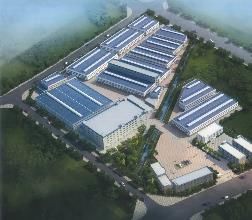
Results highlights
➢ Planned to expand or construct production bases in Gansu, Sichuan,
   Guangxi and Guangdong in order to increase production capacity,
   thereby adding impetus to its high-quality development
➢ Committed to broadening the scope of application of plastic pipes and
   pipe fittings and actively extended it to the agricultural sector, driving
   its sales growth
➢ Formed strategic partnerships with a number of private enterprises
   and achieved synergies through complementing each other with their
   respective advantages and sharing information

                                    ➢ Actively explored possibilities for collaboration with various industries
                                        to accelerate the business development of building materials and
                                        interior decoration products
                                    ➢ Continued to expand overseas markets with a focus on the Southeast
                                        Asian market
                                          ➢ Indonesia and Cambodia: Production bases are under planning
                                    ➢ Expedited the development of its environmental protection business,
                                        further expanded its layout to fully tap its potential for business growth
                                    ➢ Maintained stable and healthy financial position with cash and bank
                                        deposits of approx. RMB8.286 billion

                                                                                                                5
Agenda

         01 Results Highlights

         02 Financial Review

         03 Business Review

         04 Outlook
Steady revenue growth
                            Total revenue                                                      Total revenue (by business segment)
 (RMB million)                                                                  1H2021
                                                                                            Supply Chain Service       Environmental protection
                                                                                            Platform Business          0.9%
                               +28.1%                                                       3.0%
                                                       14,723                                                                     Others*
                                                                     Others*    Building materials & interior                     2.2%
                                                                                decoration products
                                                                     311
Environmental                                          445                      8.5%
protection            11,492                           1,258
149                                                             Environmental
                                                                protection
                                   Others*
Supply chain         743                                        135                           Plastic piping systems
                                   203
service                                                                                       85.4%
platform
business                                           12,574
256                10,141                                                        1H2020
                                                                                                                       Environmental protection
                                                                                            Supply Chain Service       1.3%
                                                                                            Platform Business
                                                                                            2.2%
                                                                                                                                   Others*
                  1H2020                                                        Building materials & interior                      1.8%
                                                 1H2021                         decoration products
                                                                                6.5%
   Others*
   Environmental protection
   Supply chain service platform business
   Building materials & interior decoration products
   Plastic piping systems                                                                     Plastic piping systems
                                                                                              88.2%                                         7
Remark: Others* including finance, connection materials and other businesses
Overall cost structure
1H2020 1H2021
Other overheads Other overheads
3.7% 2.0%
Depreciation &
Depreciation &
amortization
amortization
4.3%
4.2%
Utilities Utilities
3.1% 2.8%
Wages Wages
6.8% 6.7%
Raw materials Raw materials
82.2% 84.2%
8GP & NP continued to grow
GP & GP margin NP & NP margin
(RMB million) (RMB million)
29.9% 32% 4,000 3,757 15%
29.4% 29.7%
28.6%
9,000 3,028
8,384 12.1% 12.1%
11.5% 13.4%
7,537
24%
10%
+ 29.4% + 28.3%
16% 2,000
4,374 1,779
4,500
1,386
3,380
5%
8%
0 0% 0 0%
2019 2020 1H2020 1H2021 2019 2020 1H2020 1H2021
9Healthy & stable key financial indicators
Trade receivable days Trade payable days
(days) (days)
51 51
118
107
96
46
Jun-20 Dec-20 Jun-21 Jun-20 Dec-20 Jun-21
Inventory turnover days* Cash & bank deposits
(days) (RMB million)
94
84
76
8,286
7,152 7,447
Jun-20 Dec-20 Jun-21 Jun-20 Dec-20 Jun-21
* Remark: excluding properties
10Remained stable in return ratios
Return on equity(1) Return on assets(2) Return on invested capital(3)
18.5%
17.0%
15.7%
8.1% 10.3%
6.9% 8.9%
6.6% 8.4%
Jun-20 Dec-20 Jun-21 Jun-20 Dec-20 Jun-21 Jun-20 Dec-20 Jun-21
(1) Net profit divided by total equity at the end of the period
(2) Net profit divided by total asset at the end of the period
(3) Net profit divided by (total debt + total equity)
11Agenda
01 Results Highlights
02 Financial Review
03 Business Review
04 OutlookPlastic piping systems business: revenue & sales volume
Segment revenue Segment sales volume
(RMB million) (tonnes)
+ 24.0%
+ 8.8%
12,574 1,177,302
1,081,998
10,141
1H2020 1H2021 1H2020 1H2021
13Plastic piping systems business: revenue breakdown by region
1H2020 1H2021
Outside China Outside China
Outside 1.5% Outside 2.6%
Southern China Southern China
43.7% 45.1%
Southern China
Southern China 52.3%
54.8%
14Plastic piping systems business: revenue analysis
1H2020 1H2021
Gas Gas
1.5% Others (1)
Others(1) 1.6% 5.1%
4.2%
Power supply & Power supply & Water
tele-communication Water tele-communication
By supply
17.0% supply 17.4% 38.7%
application 38.9%
Drainage
Drainage
37.2%
38.4%
Non-PVC (2) Non-PVC (2)
By 36.3% 37.8%
PVC PVC
material 62.2%
63.7%
Total pipe products revenue: Total pipe products revenue:
RMB 10.14 billion RMB 12.57 billion
(1) Others include agricultural applications, floor heating and fire services
(2) Non-PVC includes PE, PP-R. etc 15Plastic piping systems business: ASP & GP margin analysis
By Material
ASP per tonne GP margin
(RMB)
15,431 15,051
14,250 14,577
33.20% 32.00% 32.30%
9,076 28.7%
8,116 7,781 7,789
29.10% 28.4% 28.0%
28.5%
2019 2020 1H2020 1H2021 2019 2020 1H2020 1H2021
PVC products Non-PVC products
PVC products Non-PVC products
Overall
(RMB) ASP per tonne GP margin
28.9% 30.2% 29.7% 29.7%
9,887 10,681
9,395 9,373
2019 2020 1H2020 1H2021 2019 2020 1H2020 1H2021 16Plastic piping systems business: production capacity &
utilization rate
Annual designed production capacity & average utilization rate
(million tonnes)
88.0% 80.0% 80.5%
87.9%
3
2
3.00
3.03 3.13
2.78 2.85
1
0
2019 2020 1H2020 1H2021
17Plastic piping systems business
➢ Actively expanded the agricultural sector
➢ Enriched income sources and increased market share
➢ Strengthened innovation and research capabilities
➢ Set up a R&D centre that measures up to the international
standard with an R&D team of over 1,000 professionals
➢ Providing a strong talent pool of support which built up its
core competitiveness
➢ Expedited the transformation and upgrading of the industry
through automation, digitalization and intelligent production
➢ Guangdong: The digital intelligent factory will put into
operation which enable the Group to deepen its plastic
piping system business, develop modern agriculture sector
and expand building materials and interior decoration
products business
➢ Gansu: Will invest in an intelligent production base for high-
tech and environmental product to accelerate the market
development of northwestern China. Expect an annual sales
of approx. 100,000 to 150,000 tons of plastic piping at full
capacity 18Building materials & interior decoration products
➢ China’s real estate sector has fully recovered, and the property market
turned bullish with a high volume of transactions due to benefiting from
the Chinese government’s economic stimulus policies
➢ Revenue from building materials and interior decoration products business
amounted to RMB 1.258 billion in 1H2021
➢ Actively explored possibilities for collaboration with various industries and
established a strategic partnership
➢ Established a partnership with a biopharmaceutical company: To
explore the potential of interdisciplinary integration in which
biopharmaceutical technology can be integrated into building materials
and interior decoration for their mutual benefit
➢ Entered into a strategic cooperation agreement with a Chinese real
estate developer: To jointly extend the scope of their collaboration and
explore the new business model of “finance + industry”
➢ Strengthen relationships with its existing customers and business partners
➢ Actively give full play to the synergies between the pipeline business and
its building materials and interior decoration business
➢ Establish a product research centre, innovate and upgrade eco-friendly
products which will further advance the healthy development of the
supply chain of the property sector and drive the steady business growth
19Environmental protection business Scope of Business
➢ Actively responded to the Chinese government’s environmental
policies and capitalized on municipal projects in various field
➢ Stable business with the revenue amounted to RMB135 million
in 1H2021
Water Treatment Solid Waste Disposal
➢ Planning to establish hazardous solid waste treatment centres
in Guangdong and Hunan in order to keep expanding its
environmental protection business
➢ Give full play to its technological advantages in the
environmental protection industry, continue to integrate
various resources to provide new impetus to business growth
drivers, aiming to become one of the China’s top, large Waste Gas Treatment Soil Remediation
environmental companies
Technical Consultancy & Scientific Research
Environmental Service
Monitoring Service
20Supply chain service platform business
➢ Still in early stage of business development
➢ Recorded revenue of RMB445 million in 1H2021
➢ With its focus on the development in Southeast Asian market, the
Group has projects in Thailand and Indonesia
➢ Further expand the distribution network for its supply chain services
platform business in Southeast Asia and capture opportunities to
drive its long-term business development according to the Group’s
business plan
Product Category
21Agenda
01 Results Highlights
02 Financial Review
03 Business Review
04 OutlookFuture prospect
Continuously promote automation and intelligent Focus on R&D to improve product quality
production to reduce cost and improve quality ➢ Increase investment in scientific
➢ Introduce high-precision equipment research, emphasize the cultivation
to enhance production automation, of technical talents and establish a
intelligent operation and product product research centre to innovate
optimization and upgrade eco-friendly products
➢ Accelerate the construction of ➢ Expedite the industry
production bases in Gansu, Sichuan, transformation and upgrading to
Guangxi and Guangdong, etc. offer a diverse range of high-quality
products to the customers and
actively expand its market network
Tap huge local demand of the Actively expand the business scope
region’s market and capitalize on the
local infrastructure development ➢ Broaden the scope of applications
of plastic pipes and pipe fittings in
➢ Focus on the Southeast Asian region all aspects
➢ Dedicate to scale up its production ➢ Proactively seek potential
➢ New production bases in Indonesia and partners with various industries
Cambodia are under planning
23Q&A
24Appendix: financial summary
Statement of profit and loss (RMB million) Statement of financial position (RMB million)
2019 2020 1H2020 1H2021 2019 2020 1H2020 1H2021
Revenue 26,345 28,073 11,492 14,723
7,604 7,447 7,152 8,286
Cash & bank deposits
Gross profit 7,537 8,384 3,380 4,374
Total assets 40,785 46,528 41,834 52,216
EBITDA 5,556 6,195 2,446 3,133
Total debts 13,537 16,236 15,440 18,977
EBIT 4,559 5,189 1,966 2,516
Net profit 3,028 3,757 1,386 1,779 Total equity 17,094 20,354 17,672 21,143
Ratio analysis
Profit ratio (%) 2019 2020 1H2020 1H2021
Gross profit margin 28.6% 29.9% 29.4% 29.7%
EBITDA margin 21.1% 22.1% 21.3% 21.3%
EBIT margin 17.3% 18.5% 17.1% 17.1%
Net profit margin 11.5% 13.4% 12.1% 12.1%
Growth rate (%)
Revenue 11.0% 6.6% 3.2% 28.1%
Gross profit 21.0% 11.2% 5.6% 29.4%
EBITDA 26.0% 11.5% 7.2% 28.1%
EBIT 24.9% 13.8% 6.1% 28.0%
Net profit 23.8% 24.1% 10.3% 28.3%
Liability ratio (times)
EBITDA/ financing costs 9.63x 14.21x 9.94x 12.24x
Total debts/ (total debts + total equity) 44.2% 44.4% 46.6% 47.3% 25Appendix: Layout of production bases
With over 30 advanced production bases in 18 provinces of China and in foreign countries
26You can also read