Phaunos Timber Fund Investor Presentation - 25 April 2017

Page created by Theresa Carrillo
 
CONTINUE READING
Phaunos Timber Fund Investor Presentation - 25 April 2017
Phaunos Timber Fund
Investor Presentation – 25 April 2017
Phaunos Timber Fund Investor Presentation - 25 April 2017
Stafford representatives

                    Stephen Addicott
                    Partner, Stafford Timberland
                    Stephen is a professional forester with 25 years experience in
                    plantation management, timberland appraisals, due diligence and
                    investment modelling.

                    Marek Guizot
                    Investment Manager, Stafford Timberland
                    Marek is a professional forester with over 20 years experience of
                    forestry, primarily in Africa and Latin America.

                                                                                        2
Phaunos Timber Fund Investor Presentation - 25 April 2017
Contents
           Phaunos 2016 Investor Presentation

            1. Phaunos Overview

            2. Phaunos Turnaround

            3. Dividend Proposal

            4. Market Update

            5. Stafford’s Capability & 2017
               Continuation Vote

                                              3
Phaunos Timber Fund Investor Presentation - 25 April 2017
Phaunos Timber Fund overview

                           A listed global         7 underlying
                    1        timberland      2   investments on
                              company              3 continents

                    Phaunos investment

                             Interests in         US$ 301.3m¹
                            150,000 ha of            NAV of
                    3                        4
                             sustainable           timberland
                             plantations             assets

¹ As at 31 December 2016

                                                                  4
Phaunos Timber Fund Investor Presentation - 25 April 2017
Phaunos investment portfolio

  Matariki Forests                                 NAV        Mata Mineira                                     NAV

  Country : New Zealand                                       Country : Brazil
                                                        46%
  Planted area : 115,000 ha                                   Planted area : 9,500 ha
  Main species : Radiata pine                                 Main species : Eucalyptus
                                                                                                              11%
  Rotation length : 24-26 years                               Rotation length : 8 years
  Main markets : Domestic sawmills and sawlog exports         Main markets : Charcoal and paper & packaging
  Phaunos ownership : 23%                                     Phaunos ownership : 100%

                                                                                                                     5
Phaunos Timber Fund Investor Presentation - 25 April 2017
Phaunos investment portfolio

  Eucateca
                                                       NAV   Aurora Forestal                              NAV

  Country : Brazil                                           Country : Uruguay

  Planted area : 7,300 ha                                    Planted area : 11,000 ha                9%

  Main species : Eucalyptus                      10%         Main species : Pine

  Rotation length : 8 years                                  Rotation length : 23 years

  Main markets : Biomass (agricultural drying)               Main markets : Own integrated sawmill

  Phaunos ownership : 100%                                   Phaunos ownership : 24%

                                                                                                                6
Phaunos Timber Fund Investor Presentation - 25 April 2017
Phaunos investment portfolio

  Pradera Roja
                                                   NAV   GTFF                                              NAV

  Country : Uruguay                           7%         Country : USA                                5%

  Planted area : 3,300 ha                                Planted area : 4,600 ha

  Main species : Eucalyptus                              Main species : Poplar

  Rotation length : 23 years                             Rotation length : 12 years

  Main markets : Domestic sawmills or sawlog exports     Main markets : Domestic sawmills and sawlog exports

  Phaunos ownership : 100%                               Phaunos ownership : 17%

                                                                                                                 7
Phaunos Timber Fund Investor Presentation - 25 April 2017
Phaunos Turnaround
Phaunos Timber Fund Investor Presentation - 25 April 2017
Improving results following Phaunos turnaround
Key Metric                YE 2015       YE 2016               Comments

                                                    Steady improvement from a
Net Asset Value (NAV)    US$ 278.8m    US$ 301.3m
                                                    realistic base

NAV/Share                 US$ 0.49      US$ 0.55    Assisted by share buybacks

                                                    Minimise volatility by debt
Revenues                 US$ 16.3m      US$ 9.5m
                                                    reduction and market access

Operating expenses                                  Reduced from (US$ 22m) in
                          (US$ 8.4)    (US$ 7.3m)
(excl. non-cash costs)                              2013.

                                                    Higher risk assets reduced
Asset sales               US$ 9.3m     US$ 27.6m
                                                    from 36% in mid-2014 to 13%.

                                                    US$15m reserve and surplus
Cash held                US$ 25.6m     US$ 45.6m
                                                    for investments/capital return

Share buybacks &                                    Has supported share price
                         (US$ 0.3m)    (US$ 9.1m)
dividends                                           increases.

                                                    Consistent narrowing of
Share Price               US$ 0.35      US$ 0.41
                                                    discount

                                                    A reflection of the turnaround
Net Profit/(Loss)        (US$ 10.5m)   US$ 18.3m
                                                    completed to date

                                                                                     9
Phaunos Timber Fund Investor Presentation - 25 April 2017
Phaunos performance in 2016
  NAV                                                                                                   NAV for underlying investments

                                                                                                               2015       2016
 • The NAV for Phaunos increased by 8% to USD

                                                                                                                                               Portfolio NAV (USD m)
                                                                                                  150                                    300
   301.3m.

                                                                              Asset Nav (USD m)
                                                                                                  120                                    240
 • Matariki’s NAV increased by 11%, largely due to
                                                                                                   90                                    180
   good log prices.
                                                                                                   60                                    120
 • NAV growth for the Brazilian assets (Mata
   Mineira & Eucateca) was relatively flat in local                                                30                                    60
   currency, but BRL appreciation resulted in a
                                                                                                    0                                    0
   combined increase of 25% in USD-terms.
 • Uruguayan assets (Aurora Forestal & Pradera
   Roja) were largely flat1.
 • Non-core assets2 reduced in line with ongoing
   asset sales.

   1 Reduction in Pradera Roja is due to the repatriation of cash from 2015
   standing timber sales
   2 GTFF, NTP and Green China

                                                                                                                                                          10
Phaunos performance in 2016
  Operating profit (excl. asset sales & non cash items)                                  Income & costs
                                                                        20
 • Total income came to USD 9.5m.                                       15
                                                                                                          16.3
                                                                        10
 • This decreased from US$ 16.3m in 2015 since the                                             8.8                  9.5
                                                                         5    8.6
   large standing timber sale made in Brazil was not

                                                          USD million
   repeated in 2016.                                                     0
                                                                         -5                               -8.4      -7.3
                                                                                               -11.7
                                                                        -10   -22.0
                                                                        -15
                                                                        -20
                                                                        -25
                                                                        -30
                                                                              2013             2014       2015      2016

                                                                                      Income           Cash costs

                                                                                                                           11
Phaunos performance in 2016
  Asset sales                                                                         Asset sales and return of capital
                                                                         30

                                                                         25
 • Phaunos’ objective has been and remains the sale
   of assets that are:                                                   20

                                                           USD million
        • High risk (our target level is less than 10%).                 15

        • Non-yielding                                                   10
        • High cost
                                                                         5
 • Total income from asset sales and return of
   capital amounted to USD 27.6m.                                        0
                                                                                  2014          2015              2016              2017-18*
 • Phaunos has reduced its share of high risk assets                          Green China        Eucateca (partial)       Pradera Roja (partial)
                                                                              GTFF               Green Resources          Eucateca (Alto Jauru)
   from 36% in mid-2014 to 13% at the end of 2016.                            Sale contracted    Sale under negotiation

                                                           * Forecast
                      Jun-14                 Dec-16

                                            13%
  Lower risk    36%         36%
  Medium risk                         20%
  Higher risk                                     66%
                      28%

                                                                                                                                                   12
Phaunos performance in 2016
  Cash position                                                                        Cash held at year-end
                                                                       50

 • Phaunos’ cash position increased significantly to                   40
   USD 45.6m during 2016.

                                                         USD million
 • The increase is due primarily to return of capital                  30
   and asset sales.
                                                                       20
 • This provides a buffer for operational costs in the
   event revenues dip unexpectedly, as well as the
   possibility to:                                                     10

      • Continue our programme of share                                0
        buybacks                                                               2013             2014             2015            2016*
      • Support dividend payments
      • Take advantage of Stafford’s existing
        pipeline of investment opportunities in the
        secondary market                                                * Note : After share buybacks and dividends totalling US$ 9.1m

                                                                                                                                         13
Phaunos performance in 2016
                                                                                                       Phaunos share price
  Share price & buybacks                                                      0.46
                                                                              0.44
                                                                              0.42
 • The share price increased by 17% from USD 0.35

                                                                USD/share
                                                                              0.40
   to USD 0.41 over the course of the year.
                                                                              0.38
                                                                                                                                 +17%
 • The share price has increased a further 7% to                              0.36
   USD 0.44 in Q1 2017.                                                       0.34
                                                                              0.32
 • In 2016 a total of 19.1 million shares were bought
                                                                              0.30
   back at an average price of USD 0.39 (total spend

                                                                                                                                            Oct
                                                                                                                                                  Nov
                                                                                                                                                         Dec
                                                                                                             May
                                                                                                 Mar

                                                                                                                                Aug
                                                                                                                                      Sep
                                                                                                       Apr

                                                                                                                                                                            Mar
                                                                                                                                                                                  Apr
                                                                                     Jan

                                                                                                                   Jun
                                                                                                                          Jul

                                                                                                                                                               Jan
                                                                                           Feb

                                                                                                                                                                     Feb
   USD 7.5m).
                                                                                                                         2016                                        2017
 • The NAV per share has increased to USD 0.55,
   and the share price discount has narrowed from                                            Phaunos share price vs. NAV
   29% in 2015 to 25% at end 2016.                                            90
                                                                              80
 • At the end of Q1 the share price discount was

                                                        USD cents per share
                                                                              70
   20%.                                                                       60
                                                                              50
                                                                              40
                                                                              30
                                                                              20
                                                                              10
                                                                               0
                                                                                       2013                  2014                2015                   2016               1Q2017

                                                                                                             NAV per share                    Share Price

                                                                                                                                                                                        14
Dividend Proposal
Phaunos dividends
  Commencement of regular dividends                                                                    Dividend payments outlook
                                                                                                 3.0

 • Phaunos paid a US 0.3 cent/share interim                                                      2.5

                                                                            US cents per share
   dividend in 2016.                                                                             2.0
 • The Board has proposed that a final dividend of                                               1.5
   US 1.6 cent/share, totaling USD 8.9m, be paid
                                                                                                 1.0
   following the AGM in June.
                                                                                                 0.5
 • The total dividend of US 1.9 cent/share for 2016
   is equivalent to 3.5% of NAV.                                                                 0.0
                                                                                                       2016          2017             2018
 • Phaunos expects to pay regular dividends going
   forward and is targeting a sustainable annual                                                               2016 dividend
   distribution of at least US 1.9 cents/share1.                                                               2017 dividend (forecast)
                                                                                                               2018 dividend (forecast)
 • Dividends will be paid twice a year.
 • The total distribution expected for 2017 is
   therefore US 2.55 cents/share, or 5.8% yield on
   the Q1 2017 share price of USD 0.44.

   1The ability to match or exceed this target will depend on a number of
   variables and should not be interpreted as a profit forecast.

                                                                                                                                             16
Sustainable dividends from increasing wood flow
                      Wood flows increasing                                                                                        Cash flow positive
                                     Annual harvest                                                                                                                                                High
                      2.9                                                                                                          10                                               Estimate
                                     Trend line (2016-25)                                                                           5                                                              Low
                      2.7

                                                                                                     Net cash flow (US$ million)
                                     Estimate
                                                                                                                                    0
                      2.5
Volume (million m3)

                                                                                                                                    -5
                      2.3
                                                                                                                                   -10
                      2.1
                                                                                                                                   -15
                      1.9
                                                                                                                                   -20
                      1.7
                                                                                                                                   -25
                      1.5
                            2012-    2017   2018   2019    2020   2021   2022   2023   2024   2025                                 -30
                            2016 ¹      Post-Continuation Vote                                                                           2011   2012   2013   2014   2015   2016f              2017-22

     • Sustainable revenue outlook is supported by                                                   • Looking ahead, Stafford estimates the current
       increasing wood flows.                                                                          portfolio can provide sustainable net cash flow of
                                                                                                       US$ 5m to 11m in addition to capital
                                                                                                       appreciation
                                                                                                     • Cashflow can be improved by re-investment of
                                                                                                       cash together with further diversification

                                                                                                                                                                                                         17
Market update
Phaunos market exposure
         Revenue exposure by geography 1                       Revenue exposure by product/sector 1

                                     Brazil                                       Pulp &
                              US        Uruguay                                   paper
                                                                                              Wood-based panels

                 India                                                                          Charcoal/pig-iron
                                            Other
              S.Korea                                                                             Carbon

                                                                                                   Finished
                                                                                                  sawtimber
                  China
                                          New                                                 Electricity generation
                                         Zealand                 Sawmills

  1   Based on Phaunos 2017 budget

 Despite its large weighting towards New Zealand assets, Phaunos has a well-diversified market exposure, with
 scope to improve this further by increasing wood sales from its Brazilian assets as market conditions improve.
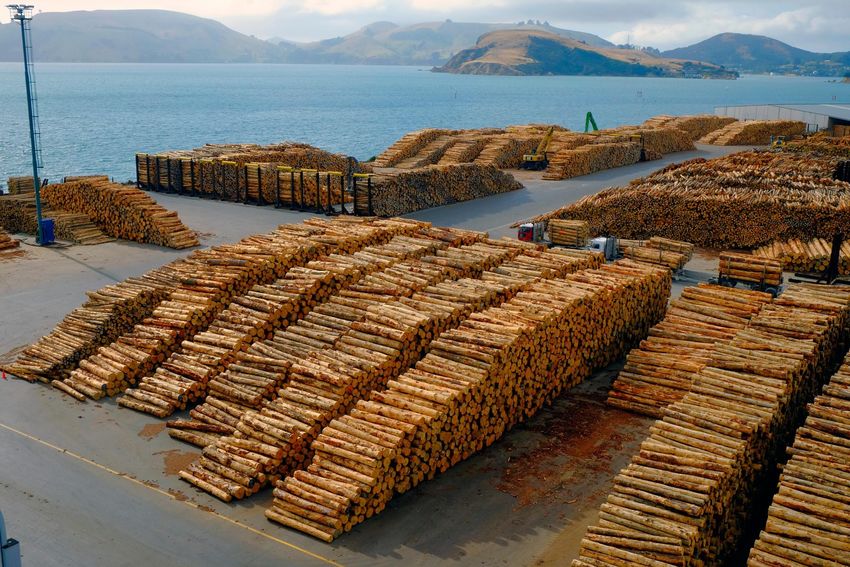
                                                                                                                       19
Wood Markets – New Zealand
    New Zealand is the world’s largest                          Buoyant housing construction sector
    exporter of softwood logs. Its forests are                  is maintaining high local sawlog
    typically not more than 150 km from a                       demand.
    port.                                                                                           35

                                                                                        Thousands
                                                 Consents approved (annualised)
                                                                                                    30
                                                                                                    25
                                                                                                    20
                                                                                                    15
                                                                                                    10
                                                                                                        5
                                                                                                        0

                                                                                                            Dec-05

                                                                                                                              Jun-07

                                                                                                                                                Dec-08

                                                                                                                                                                  Jun-10

                                                                                                                                                                                     Dec-11

                                                                                                                                                                                                       Jun-13

                                                                                                                                                                                                                         Dec-14

                                                                                                                                                                                                                                           Jun-16
                                                                                                                     Sep-06

                                                                                                                                                         Sep-09

                                                                                                                                                                                              Sep-12

                                                                                                                                                                                                                                  Sep-15
                                                                                                                                       Mar-08

                                                                                                                                                                           Mar-11

                                                                                                                                                                                                                Mar-14
                                                                                                                                                            Single                            Multi

    Export demand is driven by China.                           Average increase in export sawlog
                                                                price.
                                                                                         120

                                                                                         100

                               South                                                          80
                               Korea

                                                                                  NZD
     China                                                                                    60

                                                                                              40

                                India                                                         20

                             Japan                                                                  0
                            Other                                                                                    2013                                2014                             2015                             2016

                                                                                                                       Domestic (NZD/ton)                                           Export (NZD/JAS m3)

                                                                                                                                                                                                                                                    20
Wood Markets – China & United States
                                    China has a huge wood deficit and its                                                                                                            Housing starts in the US are steadily
                                    growing demand has been met by                                                                                                                   increasing following the 2009-11 crisis.
                                    imports, particularly from New Zealand.                                                                                                                               2,500

                                                                                                                                                                           US housing starts (000's pa)
                                    35
    Softwood imports (Million m3)

                                    30                                                                                                                                                                    2,000

                                    25
                                                                                                                                                                                                          1,500
                                    20
                                    15
                                                                                                                                                                                                          1,000
                                    10
                                     5
                                                                                                                                                                                                           500
                                     0
                                          2000
                                                 2001
                                                        2002
                                                               2003
                                                                      2004
                                                                             2005
                                                                                    2006
                                                                                           2007
                                                                                                  2008
                                                                                                         2009
                                                                                                                2010
                                                                                                                       2011
                                                                                                                               2012
                                                                                                                                      2013
                                                                                                                                             2014
                                                                                                                                                    2015
                                                                                                                                                           2016
                                                                                                                                                                                                              0

                                                                                                                                                                                                                   Jun-71
                                                                                                                                                                                                                            Dec-74
                                                                                                                                                                                                                                     Jun-78
                                                                                                                                                                                                                                               Dec-81
                                                                                                                                                                                                                                                        Jun-85
                                                                                                                                                                                                                                                                   Dec-88
                                                                                                                                                                                                                                                                             Jun-92
                                                                                                                                                                                                                                                                                       Dec-95
                                                                                                                                                                                                                                                                                                Jun-99
                                                                                                                                                                                                                                                                                                         Dec-02
                                                                                                                                                                                                                                                                                                                  Jun-06
                                                                                                                                                                                                                                                                                                                           Dec-09
                                                                                                                                                                                                                                                                                                                                    Jun-13
                                                                                                                                                                                                                                                                                                                                             Dec-16
                                         New Zealand                  Russia               North America                      Australia             Other

    From 2017 China has banned all harvesting of                                                                                                                                     Average sawtimber prices have trended
    its natural forest – which accounted for almost                                                                                                                                  upwards over the past 18 months.
    30% of its timber (both soft- & hardwood).                                                                                                                                                      450

                                                                                                                                                                  USD/1,000 board feet
                                                                                                                                                                                                    400
                                     Domestic -
                                      natural
                                                                                                                                                                                                    350
                                       forest

                                                                                                                                                                                                    300
                                                                                                                                   Imports
                                                                                                                                    (logs &
                                                                                30 million                                        sawtimber)                                                        250
                                                                                   m3
                                                                                                                                                                                                    200

                                                                                                                                                                                                                     Mar
                                                                                                                                                                                                                               May

                                                                                                                                                                                                                                                    Sep

                                                                                                                                                                                                                                                                                      Mar
                                                                                                                                                                                                                                                                                                May

                                                                                                                                                                                                                                                                                                                  Sep

                                                                                                                                                                                                                                                                                                                                                 Mar
                                                                                                                                                                                                             Jan

                                                                                                                                                                                                                                                                 Nov
                                                                                                                                                                                                                                                                            Jan

                                                                                                                                                                                                                                                                                                                            Nov
                                                                                                                                                                                                                                                                                                                                      Jan
                                                                                                                                                                                                                                         Jul

                                                                                                                                                                                                                                                                                                         Jul
                                         Domestic -
                                         plantations                                                                                                                                                                                 2015                                                          2016                                 2017

                                                                                                                                                                                                                                                                                                                                                       21
Stafford Timberland & Continuation Vote
Stafford Timberland

                   2.3bn                                                                                 500m                               10.1%
                                                                    Timberland funds                                                                  Secondary & Co-
                                                                    under
                                                                                                           $      Invested over the
                                                                                                                                                      Investment IRR ²
                                                                    management1                                   past 18 months

                                                                            An Investment Manager with specialist skills and proven track record

                                                                        Funds Under Management
                                                                                                                  • Team of experienced forestry professionals.
                                                         2.5                       Stafford Timberland
                                                                                                                  • 12 year track record.
                       Funds Under Management (US$ bn)

                                                                                   Phaunos
                                                         2.0                                                      • Extensive network
                                                         1.5                                                      • Access to unique proprietary deals, often in the
                                                                                                                    secondary market.
                                                         1.0

                                                         0.5

                                                         0.0
                                                               Dec-04 Dec-06 Dec-08 Dec-10 Dec-12 Dec-14 Dec-16

¹ In US$ as at March 2017, contributing towards US$ 4.8bn under management of Stafford Capital Partners
² Since inception to 31 December 2016. Across 58 secondary and co-investment transactions

                                                                                                                                                                         23
2017 continuation vote
         At the AGM on 19 June 2017, Phaunos will be seeking a 5-year continuation of the Company.
                                        The case for continuation is that …

  1   Stafford has completed the first phase of the Phaunos turnaround strategy announced in mid-2014.

  2   In 2016 the Phaunos NAV/share increased 12%, and the share price increased 17%.

      Positive operating cash flows, together with asset sales, have increased cash reserves to a level which will
  3
      allow for ongoing share buybacks, sustainable dividends, and potential new investments.

  4   Phaunos provides low-cost and liquid exposure to the timberland asset class.

  5   Stafford has the deal flow, knowledge, and ability to expand the Company.

  Phaunos is now in a position to deliver on its vision of being a …
  Globally diversified, listed timberland fund, with potential to provide yields of 3-5% p.a. and NAV growth
                           of 3-5% p.a., managed in accordance with ESG best practice.

                                                                                                                     24
Disclaimer
 •   Stafford Capital Partners Limited ("Stafford") is distributing this strategy presentation in its capacity as manager of Phaunos Timber Fund Limited (the "Company") The Company is a
     Guernsey domiciled Authorised Closed-ended investment scheme pursuant to section 8 of the Protection of Investors (Bailiwick of Guernsey) Law 1987, as amended and rule 6.02 of the
     Authorised Closed-ended Investment Schemes Rules 2008 published by the Guernsey Financial Services Commission. The Ordinary Shares of the Company are admitted to the Official List
     of the UK Listing Authority and to trading on the London Stock Exchange’s main market.

 •   In distributing this presentation Stafford is relying on the fact that all recipients are qualified investors' within the meaning of section 86(7) of Financial Services and Markets Act 2000
     (“FSMA”) who are also (i) investment professionals within the meaning of Article 19(5) of the Financial Services and Markets Act 2000 (Financial Promotion) Order 2005 (''FPO"); or (ii) high
     net worth companies within the meaning of Article 49 of the FPO; or.(iii) members of the Company within the meaning of Article 43(2) of the FPO; or (iv) certified high net worth individuals
     within the meaning of Article 48 of the FPO; or (v) certain sophisticated investors within the meaning of Article 50(1) of the FPO (each a "relevant person"). Persons who do not fall within any
     of these definitions should not rely on this document nor take any action upon it. The document is only exempt if it is distributed to these exempt categories of recipients. This document has
     not been approved as a financial promotion or otherwise by a person who is authorised under FSMA for the purposes of section 21 of FSMA and rules made under such legislation or any
     other applicable securities laws of any other territory. Approval will be required unless the recipient of this promotion is a relevant person. This presentation has not been, and will not be,
     reviewed or approved by the Financial Conduct Authority ("FCA") or any other authority or regulatory body.

 •   Stafford is issuing this strategy presentation exclusively as manager of the Company and will not be responsible to anyone other than the Company for providing regulatory and legal
     protections afforded to customers (as defined in the rules of the FCA) nor for providing advice in relation to the contents of this document on any matter, transaction or arrangement referred
     to in it. None of Stafford nor the Company, nor any of their respective directors, officers or employees makes any representation or warranty, express or implied, as to the accuracy or
     completeness of the information or reasonableness of any opinions contained in this strategy presentation .

 •   Stafford is authorised and regulated by the FCA, but has not authorised the contents of, or any part of, this document for the purposes of Section 21 of FMSA. To the fullest extent permitted
     by law, none of Stafford nor the Company (nor their respective members, directors, officers, employees, agents or representatives) nor any other person accepts any liability whatsoever for
     any errors, omissions or inaccuracies in such information or opinions or for any loss, cost or damage suffered or incurred howsoever arising, directly or indirectly, from any use of this
     document or its contents or otherwise in connection with the subject matter of this document. The contents of this strategy presentation are not to be construed as legal, financial or tax
     advice. This document should not be distributed in whole or in part to other parties.

 •   This strategy presentation is being supplied to shareholders and other relevant persons and solely for their information and does not constitute or contain any invitation or offer to any person
     to subscribe for, otherwise acquire, or dispose of any Ordinary Shares in the Company or advise persons to do so in any jurisdiction. This strategy presentation does not constitute a
     recommendation regarding the Ordinary Shares of the Company.

 •   Some statements contained in this presentation are or may be forward-looking statements, including without limitation any forecasts or projections. Actual results may differ from those
     expressed in such statements, depending on a variety of factors. Any forward-looking information contained in this strategy presentation has been prepared on the basis of a number of
     assumptions, only some of which are set out in the presentation , which may prove to be incorrect, and accordingly, actual results may vary.

 •   For the avoidance of doubt, nothing in this strategy presentation is intended to constitute a profit forecast.

 •   The value of any investment may fall over time and you may receive back less than you invested.

 •   Stafford Capital Partners Limited is incorporated in England under registered number 04752750 and its registered office is at 4th Floor, 24 Old Bond Street, London, W1S 4AW, England.

                                                                                                                                                                                                         25
You can also read