Food from Finland Japan market training - June 8, 2020 - Business Finland
←
→
Page content transcription
If your browser does not render page correctly, please read the page content below

Food from Finland
Japan market
training
June 8, 2020
Contents
09:30 Japanese food market statistics and trends by Business Finland Tokyo
Do’s and Don’ts when entering the Japanese markets for Food companies by
Business Finland Tokyo
10:00 Export of food products from Finland to Japan by Ruokavirasto
10:20 Japanese business customs by JETRO
10:50 Future promotion opportunities with Food from Finland by Business
Finland
11:00 End
JAPAN situation with COVID 19 Most of the data in this presentation is from pre-COVID19 Number of confirmed cases on June 7, 2020: 17 864 Deaths: 917 State of emergency (both partial and national) from April 7, 2020 until May 25 School closures from late February 2020 No actual lockdown inside the country, borders closed Economic impact: GDP -3.4% Q1 2020 Phased road map to fully open the economy by August 2020 Japan is in technical depression with 2 consecutive quarters of negative growth Revitalization package by goverment 200 trillion yen ($1.9 trillion), equal to 40% of GDP Unemployment rate 2.5 % in March, worst case scenario estimated to come up to 7%
Japanese food markets
  statistics & trends
Japanese food industry structure and market size
①
Out of Japan’s 547 trillion GDP, Japan food industry structure
10,1% consist from the agriculture &
food related industry
The sector has seen 2,1% yearly
24%
growth in recent years and now 37%
accounts for 55,19 trillion GDP on it’s
own
12%
Main players:
Food distribution totaling 20,5 3% 24%
trillion yen
Restaurant industry 13,3 trillion
yen Restaurant industry Agriculture, forestry & fishing
Food production 13,3 trillion yen Food production Other
Food distribution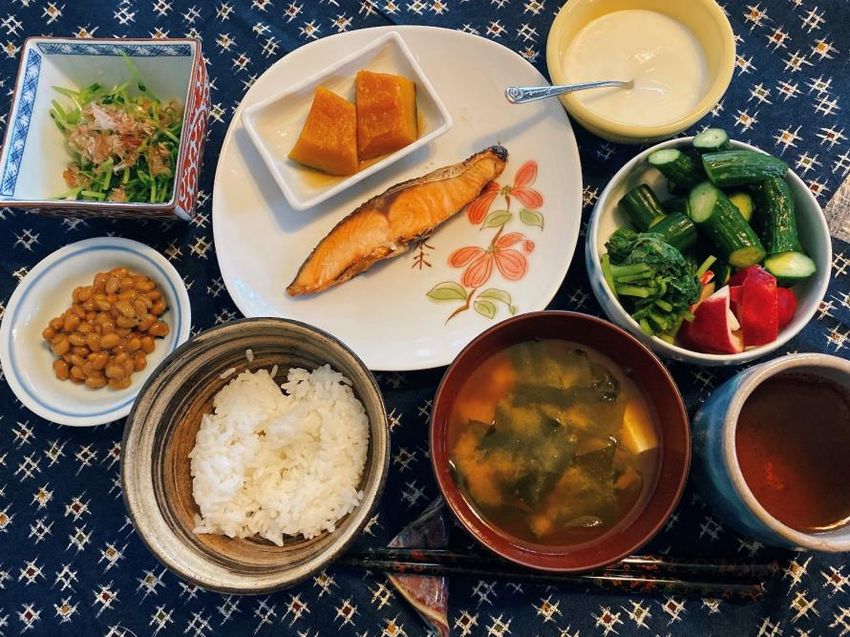
Japanese restaurant & RTE markets
The restaurant market’s growth rate had been
slowing down due to general Izakaya (tavern)
chains struggling, but has been recovering steadily Eat-in vs RTE market size
since 2016 due to the resurgence of the
hamburger industry
In the Ready-to-Eat (RTE) market, home delivery
and catering services are generally continuing
expansion.
13.50%
Eat-in still accounts for roughly 80% of meals
purchased 79.73% 20.27%
Convenience stores (CVS) takeout foods have
been increasing their market share. 6.77%
CVS take outs are still targeted mainly at male
customers
Due to increase in female and senior
customers, convenience stores have launched
new products targeted at these customer Restaurant CVS Delivery, Catering etc. RTE
groups
*Estimates for 2019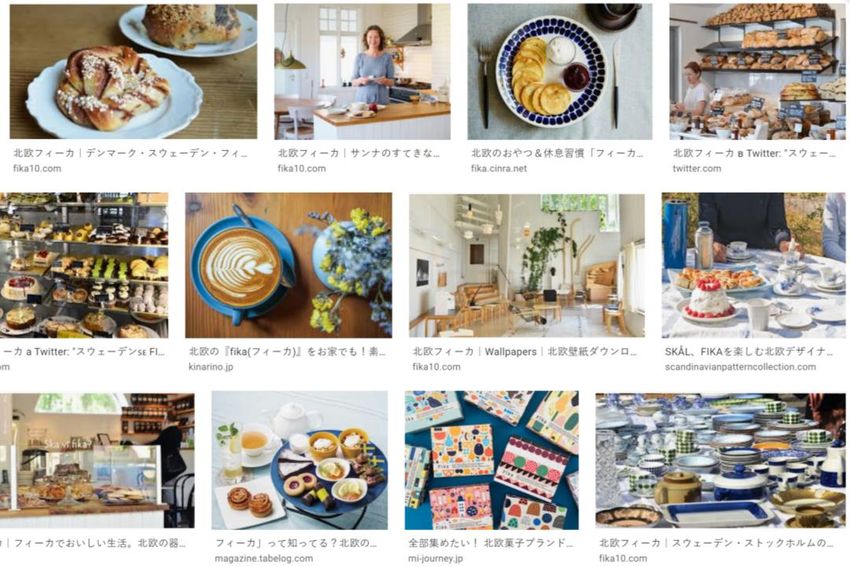
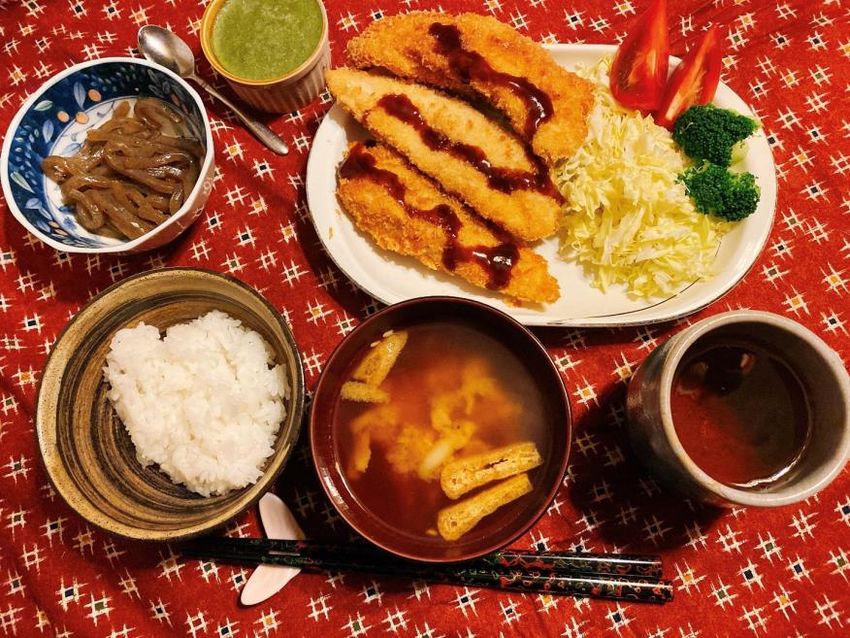
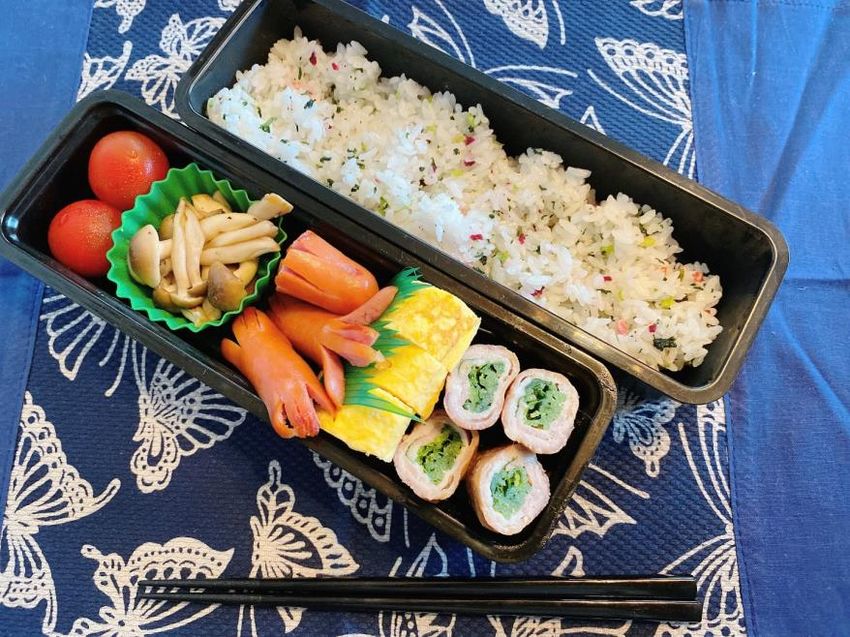
Japanese dining habits
Restaurant industry takes
24% of whole Japanese
food industry
Eating out is more common
and affortable than in
Finland
Convenience stores are very
popular & have a very vide
variety of RTE foods
Home-cooked meals still the
ideal
Photos: breakfast, bento lunch and dinner, Masahiro Kimura, Business Finland Tokyo
Current food trends in Japan COVID19: Take-out and delivery food, food subscriptions Healthy (balanced sets of meat, vegetables and carbonhydrates) foods Vegan products (still much behind Finland) Less or non-plastic packaking (eco-friendlines) 中食 easy to prepare/almost ready-made (frozen etc.) foods Non-alcoholic drinks Mexican, Thai etc. ethnic food Foods that picture well for Instagram, TikTok etc. Video formats instead of just photos
Growth products from the past 10 years
Top 10 Highest Growth % Categories
During 2010-2019 the fastest growing
food products have been: 0.00% 100.00% 200.00% 300.00% 400.00% 500.00% 600.00% 700.00%
Non-alcoholic drinks +648,6% Non-Alcoholic Drinks
Sugar-free carbonated drinks 0-Sugar Carbonated Drinks
+438,2%
Barley Tea
Asahi Beverages strongly promoting
Wilkinson, a high carbonate, zero Breakfast Cereal
sugar drink in the early 2010s, had a
strong influence on the current Amazake (sweet, low-alcohol drink)
demand and growth trend of these
drinks Yogurt Drinks
Barley tea +370.5% (part of growing Jelly Snack Foods
health trend)
Tomato Drinks
In general healthy food as well as foreign
food have consistently been growing Chinese Cuisine Spices
during the past decade
Seasonin for Japanese and Western Menues
Source: Fuji Keizai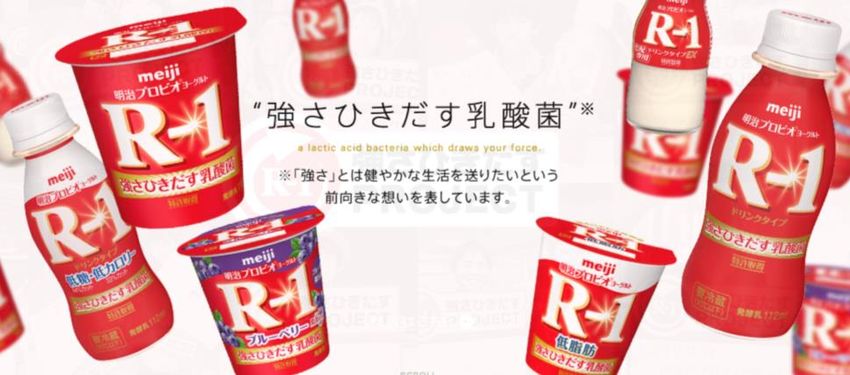
Japanese retailing trends
Focus on consumer experience: • Seasonality: strong focus on seasonal
shopping as an exiting experience & produce and special seasonal products
turning shops into spaces where • Self-checkouts and semi-self-checkouts
consumers spend time are continuing to gain a presence in
Convenience in terms of the shopping store-based retailing
process, product offer and delivery,
which is benefiting accessible urban Standard opening hours in Japan by channel type in 2019
stores and e-commerce Channel 24-hour Monday- Friday Saturday Sunday
opening? Thursday
Convenience store outlet numbers and Supermarkets No 08.00-23.00 06.00-23.00 08.00-22.00 11.00-17.00
retail value sales of convenience stores
Convenience Yes 24 hours 24 hours 24 hours 24 hours
continued to see good annual growth Stores
Tendency to buy smaller amounts more Department No 10.00-21.00 10.00-21.00 10.00-21.00 10.00-20.00
Stores
frequently
Source: Euromonitor International, Retailing in JapanJapanese Food Industry value chain
Main players of the food & retailing market
   Production of foods &                         GMS、Super markets &
                                                                                                               Grocery Retail
        beverages                                 convenience stores
                              Annual sales                                    Annual sales                                            Annual sales
Rank        Company name                      Rank         Company name                       Rank            Company name
                              (Million yen)                                   (Million yen)                                           (Million yen)
         Asahi Breweries,                              AEON RETAIL Co.,
       1                           943,171           1                           2,197,833            1 CO-OP MIRAI                         389,811
         Ltd                                           Ltd.
       2 Nipponham Ltd             802,712           2 Ito-Yokado Co., Ltd.      1,244,262            2 Yaoko Co., Ltd.                     363,891
         Yamazaki Baking                               SEVEN-ELEVEN
       3                           744,922           3                             849,862            3 MANDAI Co.,Ltd.                     337,795
         Co., Ltd                                      JAPAN Co., Ltd.
                                                       FamilyMart UNY
                                                       Holdings Co., Ltd.
                                                       (since 2017
       4 Meiji Co., Ltd.           742,174           4 changed ownership,          712,815            4 Valor holdings                      290,045
                                                       current Pan Pacific
                                                       International
                                                       Holdings)
           Kirin Holdings                                                                                 NISSIN HEALTHCARE
       5                           674,213           5 IZUMI Co., Ltd.             683,850            5                                     237,466
           Company, Limited                                                                               FOOD SERVICE CO.,LTD
                                                         LIFE
       6 Itoham Foods Inc.         533,179           6                             677,306            6 Maxvalu Tokai co.,ltd.              221,748
                                                         CORPORATION
      ASAHI SOFT
       7                           447,975           7 FamilyMart Co., Ltd.        480,361            7 Belc CO., LTD.                      211,917
      DRINKS CO., LTD
      Morinaga Milk                                      York Benimaru                                    Suntory Beverage Service
    8                              440,554           8                             429,064            8                                     184,929
      Industries Co., Ltd.                               Co.,Ltd.                                         Limited.
      Nippon Suisan
    9                              379,515           9 The Maruetsu, Inc.          414,200            9 U CO-OP                             179,208
      Kaisha, Ltd.
   10 ITO EN Ltd.                  371,873       10 HEIWADO                        375,556           10 Maxvalu Kyushu co.,ltd.             177,305

                                                                                                                                     All numbers from 2017
Largest convenience store chains
Convenient
location
High-end convenience store by Lawson group,
Specializes in healthy & inported products
supermarket
All companies in this section are supermarkets
Scarce Abundant
selection Life corporation selection
Pan Pacific International Holdings
Discount chain store
Japanese
major
retailers Inconvenient
location
IZUMI Co., Ltd.
York Benimaru Co.,Ltd.Main players of the horeca & wholesale
Grocery wholesale(※) Restaurant industry
Annual sales (Million Annual sales (Million
Rank Company name Rank Company name
yen) yen)
1 Toa Shoji Co., Ltd. 142,321 1 SKYLARK HOLDINGS CO., LTD. 285,140
2 TOHO Food Service Co,.Ltd. 111,635 2 Japan McDonalds 253,640
3 UCC FOODS Co, Ltd. 101,925 3 Starbucks Coffee Japan 170,984
4 TAKASE BUSSAN CO., LTD 100,509 4 AKINDO SUSHIRO CO.,LTD. 155,085
AIM SERVICES CO.,LTD. (catering for
5 OIE SANGYO co.,ltd. 87,160 5 121,971
schools, offices etc.)
6 Yaguchi Corporation 74,928 6 Saizeriya Co., Ltd. 117,259
7 Nishihara Shokai Co., Ltd. 68,100 7 Kura Sushi, Inc. 115,954
8 Kuze Co.,Ltd. 61,317 8 TORIDOLL Holdings Corporation 101,408
9 OOMITSU CO.,LTD. 47,827 9 MONTEROZA CO.,LTD. 94,704
10 Satoh & Co., Ltd. 45,645 10 Matsuya Foods 92,289Abundant Japanese major
establishments
restaurant
chains
Part of Matsuya Foods Part of SKYLARK HOLDINGS CO., LTD.
Japanese style dishes Family restaurant
Part of TORIDOLL Holdings Corporation ”Italian style” Family restaurant
Japanese style noodle restaurant
Low price High price
Family restaurant
Japanese style dishes,
Part of SKYLARK HOLDINGS CO., LTD. Focus on healthines
Part of MONTEROZA CO.,LTD.
Japanese style ”izakaya” tavern
Scarce
establishmentsIngredient Suppliers for horeca sector ①
In the tables below are illustrated the main ingredient suppliers of well known hotels or family-oriented restaurants
Hotels* Family Restaurants
*Includes wedding organizersIngredient Suppliers for horeca sector ② The table below illustrates the main ingredient suppliers of well known Café chains in Japan
EPA EU Japan Economic Partnership
Agreement
• 1st of February 2019, impacts on Food were immediately witnessed
• Duties in important categories for EU like cheese, wines will be gradually lowered or were
  immediately deleted after enforcement
• Once the agreement is fully implemented, Japan will have scrapped customs duties on 97% of
  goods imported from the EU
• The agreement also removes a number of long-standing non-tariff barriers
• Sources on EPA in English:
   • https://www.eu-japan.eu/epa-helpdesk
   • https://www.eubusinessinjapan.eu/node?destination=node
Japanese imports to Eu before and after EPA
               EPA not active  EPA active

                                                   *Import Values are in M€
Food categories
imported by Japan
• Total value and total growth percentages of
different food categories in Japan
• Tuna demand and consumption inside Japan has
been sluggish and it’s very visible in the import
statistics as well
• Shrimp is doing even worse and has reached a
6-year low
• Salmon consumption is still experiencing
moderate growth
• In the meat market, pork still dominates in both
amount and value despite having a small amount
of negative growth.
*All data from 2018Food categories imported
by Japan from Finland
Finnish food exports to Japan ranked by total
value in tens of thousands of €
• Dairy products are the clear cornerstone of
Finnish food exports representing 40% of total
import values of top 20 food categories.
• Additionaly to Finnish chocolate exports being
high, the Finnish image of healthiness and
freshness is visible in export statistics as well.
• Many of these categories, especially dairy
products, are expected to grow significantly due
to EPA implementations.
2019 Average Exchange rate *Import Values are in Millions of ¥
1 EUR € = 122,01 JPY ¥
Import Amounts in Metric Tons / Kilo LitresDo’s and don’ts when
entering the Japanese
marketsWhat sells in Japan
Japanese consumer preferences:
Importance of packaking & quality
Small packaking size, single portions etc.
Clear messages in Japanese on how to use
or eat products via packaking, media,
demonstrations, website etc.
Examples of popular domestic products:
R-1 yoghurt (how tu use –message, size)
Häagen-Dazs Japan (domesticated packaking size and
flavours)
Calbee Furugura cereal (clear message, packaking)
Examples of succesfull Finnish products:
Premium alcohol products
Confectionary
Most of Finnish exports is still B2B bulk
ingredients
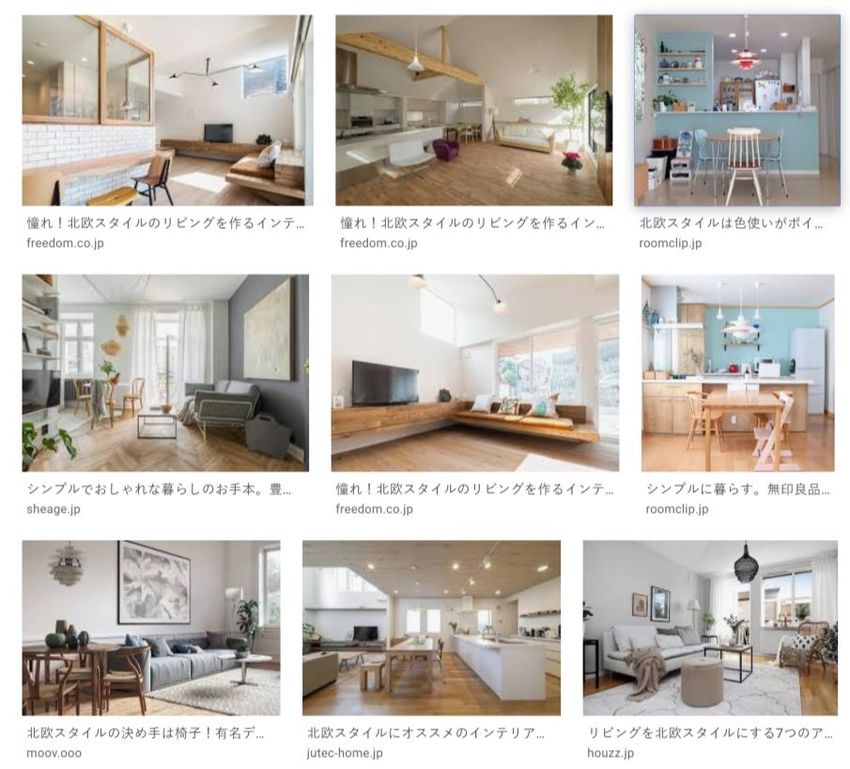
All pictures from respective companies official websitesImage of Finland
”Nordic” design and life style is
popular in Japan
Finland is relatively well known,
but people also associate things
like”Fika” or ”Fjord” to all Nordics
Japanese main image of Finland:
Nature, design (mainly just
Marimekko), Moomin, Santa Claus,
Aurora Borealis
Finnish food culture is not well
known
Need to think how your product fits
this image
Pictures: Google search results for ”Nordic style” and ”Nordic fika”DON’TS in Japanese markets Trying to use same sales strategy as in Finland or other markets Inability to conform and adapt to Japanese rules, regulations and business conditions Not taking part in local marketing efforts in Japan (expecting importer/partner to do all of the work) Unwillingness to take the time & resources needed for finding a partner in Japan (usual time requirement: 1 year or more after first meeting) Too high volume requests from the start (Japanese importers like to test products with small volumes)
DO’s for succesful entry into Japanese
markets
Finnish food can best be marketed as natural and pure in Japan as it fits the
country image and differentiates from other foreign products
Products that utilize the uniqueness of Finland, not just high quality
Sufficient customization for Japanese markets
Packaking (size and design)
Adabtability to Japanese legistlation and rules
Long expiration dates required by Japanese importers
Attitude on doing business
Preparedness for long-term negotiations, export procedures, understanding of Japanese
business culture
Arranging communication in Japanese language through own staff or strong agent/partnerBusiness Finland services for food industry
companies in Japan
• Business Finland main mission is to support exports by providing basic
information on markets, connections and advice
• This does not include detailed support in rules & regulations for imports to a certain country
or direct partner search
• If you would need these kinds of services, we are happy to introduce consultants that can
help you against a fee
• Usually the best way is to find an importer who are generally happy to take on these tasks
as they have the final legal responsibility of products that they import
• We organize several buyer meetings, trade fairs, and consumer promotions
each year and welcome you to join! Please follow FFF newsletters for updated
informationExport of food products
from Finland to Japan
RuokavirastoJapanese business
customs
JETROFuture promotion
opportunities with Food
from FinlandEvents & promotions in 2020 & early 2021
E-commerce training on June 12, 2020
Digital department store fair (ongoing)
Finnish Food Week @ Tokyo Metsä pavilion from November 3 – 7, 2020
Find details & link to registration from:
https://www.businessfinland.fi/en/whats-new/events/food-from-
finland/2020/tokyo-2020-for-food-companies/
FoodEx 2021 in Makuhari Messe from March 9 – 12, 2021
Find details from: https://www.jma.or.jp/foodex/en/index.html
Buyer toursThank you ありがとうございました!
You can also read