The Food Travel Experts - www.foodtravelexperts.com - Investors
←
→
Page content transcription
If your browser does not render page correctly, please read the page content below

The Food Travel Experts

www.foodtravelexperts.com

Presentation structure

1. Group highlights                Kate Swann
2. Financial review                Jonathan Davies
3. Business review                 Kate Swann
4. Q&A                             All

2   SSP: The Food Travel Experts
Group highlights
• Good first half performance with operating profit up 38.5% at actual exchange rates, 24.7% at
  constant currency
• Like for Like sales up 2.9%, net new space growth strong at 3.4%
• Total sales growth including India 8.1%
• Strong operating margin growth of 30bps
• Strategic initiatives progressing well, delivering both growth and efficiency
• EPS 4.2p, up 40%
• Interim dividend 3.2p, up 28%
• Medium term pipeline encouraging
• Indian acquisition – early days, but progressing well
• Business is in good shape and we continue to invest in our many growth opportunities

3   SSP: The Food Travel Experts
Financial review
Interim Results 2017

Jonathan Davies, CFO

   SSP: The Food Travel Experts
Group financial overview
                                                                                                                            Change (%)

                                                                                                                   Constant               Reported
                        £m                                                     H1 2017           H1 2016
                                                                                                                   Currency               FX Rates

                        Revenue                                                 1,072.5            896.7               8.1%                19.6%

                        LFL Sales Growth                                          2.9%              3.3%                n/a                 n/a

                        Operating Profit*                                         42.8              30.9              24.7%                38.5%

                        Profit Before Tax*                                        34.7              23.2                n/a                49.6%
                        Earnings per share (p)*                                    4.2               3.0                n/a                40.0%
                        Net Debt                                                (378.8)           (374.7)              4.0%                (1.1)%

* Underlying excludes exceptional items and amortisation of intangible assets created at acquisition of the SSP business by EQT in 2006

5     SSP: The Food Travel Experts
H1 2017 LFL sales growth

                                                4.5%   4.3%
                                                4.0%

                                                3.5%                    3.3%           3.4%
                      LFL Sales Growth (%YOY)

                                                3.0%                                            2.9%
                                                2.5%           2.4%            2.4%
                                                2.0%

                                                1.5%

                                                1.0%

                                                0.5%

                                                0.0%
                                                        Q1      Q2       H1    Q1       Q2      H1
                                                              H1 FY16                 H1 FY17
Note: Same store like-for-like sales growth at constant currency

6      SSP: The Food Travel Experts
Revenue growth of 8.1% at constant currency
                                                                   Net Contract
                      Change at Constant Currency     LFL Sales                    Total Revenue
                                                                  Gains/(Losses)

                         UK                             1.9%          1.9%             3.8%

                         Continental Europe             3.5%          (1.7)%           1.8%

                         North America                  6.2%          11.1%           17.3%

                         Rest of World (excl India)     0.4%          19.4%           19.8%

                         Group (excl India)             2.9%          3.4%             6.3%

                         Leap Year                                                    (0.6)%

                         Group (incl Leap Year)                                        5.7%

                          India                                                        2.4%

                          Reported Growth                                              8.1%

7   SSP: The Food Travel Experts
Operating profit growth of 24.7%
                                                                Operating Profit*             Change (%)
                                                                                      Constant      Reported FX
                                £m                           H1 2017        H1 2016
                                                                                      Currency         Rates
                                UK**                          29.7            26.5     11.3%           12.1%

                                Continental Europe            20.2            11.9     42.9%           69.7%

                                North America                  5.6            3.7      25.6%           51.4%

                                Rest of World (excl India)     1.1            2.4     (38.5)%         (54.2)%

                                Non-attributable              (17.5)         (13.6)   (28.7)%         (28.7)%

                                Group (excl India)            39.1            30.9     14.7%           26.5%

                                India                          3.7             -        n/a                n/a

                                Group                         42.8            30.9     24.7%           38.5%

    * Operating profit is underlying, at actual currency
    ** UK includes Republic of Ireland

8        SSP: The Food Travel Experts
Operating profit margin (excl India) up by 30bps
                                                                                                                             YOY bps Change
                   £m                                                      H1 2017                  H1 2016     Constant Currency     Reported FX Rates

                   Revenue                                                 1,047.9                   896.7

                   Gross Profit                                             719.8                     603.0
                   % Sales                                                  68.7%                     67.2%            80                     150

                   Labour Costs                                             323.4                     275.1
                   % Sales                                                  30.9%                     30.7%            10                     (20)

                   Concession Fees                                          190.0                     156.4
                   % Sales                                                  18.1%                     17.4%           (50)                    (70)

                   Overheads                                                124.4                     106.0
                   % Sales                                                  11.9%                     11.8%            0                      (10)

                   Depreciation & Amortisation                               42.8                     34.6
                   % Sales                                                   4.1%                     3.9%            (10)                    (20)

                   Operating Profit (excl India)*                            39.1                     30.9
                   Operating Margin (%)                                      3.7%                     3.4%             30                     30

                   India                                                     3.7                       n/a            n/a                     n/a
                   Operating Margin (%)                                     14.9%
                                                                             42.8                     30.9
                   Operating Profit*                                         4.0%                     3.4%             50                     60
* Underlying excludes amortisation of intangible assets created at acquisition of SSP business by EQT in 2006

9     SSP: The Food Travel Experts
Net profit up 37.5%
                             £m                                                    H1 2017                   H1 2016                  Change (%)

                             Operating Profit*                                        42.8                     30.9                     38.5%

                             Net Financing Cost*                                     (8.8)                     (7.5)

                             Share of Associates                                      0.7                      (0.2)

                             Profit Before Tax*                                       34.7                     23.2                     49.6%

                             Tax*                                                    (7.6)                     (5.2)

                             Non-Controlling Interests                               (7.3)                     (3.6)

                             Net Profit*                                              19.8                     14.4                     37.5%

                             Earnings per share (p)*                                  4.2p                     3.0p                     40.0%

                             Dividend per share (p)                                   3.2p                     2.5p                     28.0%

* Underlying excludes exceptional items and amortisation of intangible assets created at acquisition of SSP business by EQT in 2006

10    SSP: The Food Travel Experts
Free cash outflow of £53.0m
£m H1 2017 H1 2016
Operating Profit* 42.8 30.9
Depreciation & Amortisation** 44.1 34.6
Working Capital (19.6) (19.8)
Capital Expenditure (61.4) (49.2)
Net Tax (14.4) (9.2)
Investment in Associates - (4.7)
Acquisition of TFS, adjusted for net debt
(35.0) -
acquired
Other (1.6) (2.9)
Operating Cash Flow* (45.1) (20.3)
Net Financing Costs (7.9) (6.7)
Free Cash Outflow* (53.0) (27.0)
* Underlying excludes exceptional items and amortisation of intangible assets created at acquisition of SSP business by EQT in 2006
** inclusive of £1.3m depreciation & amortisation relating to India
11 SSP: The Food Travel ExpertsNet debt of £378.8m
Leverage
£m
(Net Debt/EBITDA)
Opening Net Debt (1 October 2016) (317.4) 1.6x
Free Cash Flow (53.0)
Dividend (13.8)
Impact of foreign exchange rates 6.1
Other (0.7)
Closing Net Debt (31 March 2017) (378.8) 1.7x
12 SSP: The Food Travel ExpertsAcquisition of 49% stake in TFS
Fully consolidated H1 (4 months)
• In October 2016 SSP announced the acquisition of a 49% JV £m
with Travel Food Services, completed in December 2016 Constant
Reported FX rates
Currency
• SSP currently owns 33%, the remaining 16% is to be acquired
Revenue 21.6 24.7
in 2018
EBIT 3.2 3.7
• SSP has management and operational control % Margin 15% 15%
Tax (1.4)
• TFS is fully consolidated in the SSP H1 figures* % 38%
(1.9)*
Minorities
• Good H1 performance – strong double digit LFL sales growth 83%
and net gains of 4.6% Net income 0.4
*SSP’s share of the fully consolidated revenue and profit was 11% (1
• Significant new opening programme underway December 2016 – 28 February 2017) and 26% (1 March - 31 March 2017).
On a fully consolidated basis this equated to 17% in the 4 months to 31
March 2017.
• Encouraging start and good contract pipeline
13 SSP: The Food Travel ExpertsFinancial summary • Robust LFL sales growth of 2.9% • Net contract gains (excl India) stronger at 3.4% • Strategic programmes delivering strong operating margin growth (excl India) up 30bps • India adding 2.4% to revenue and an additional 20bps to operating margin • Operating profit up 24.7% • EPS up 40.0% • Interim dividend per share of 3.2p, up 28% 14 SSP: The Food Travel Experts
Business review
Interims Results 2017

Kate Swann, CEO

   SSP: The Food Travel Experts
SSP business fundamentals

• Multiple structural market growth drivers

• Market leader in attractive channels and regions

• Strong business platform combining international scale and local expertise

• 5 key levers to drive growth and efficiency

• Sales growth, margin expansion and strong cash generation

16   SSP: The Food Travel Experts
UK update
• 36%* of SSP revenue, strong presence in rail and air                                                             Revenue
                                                                                               400
• Air growing strongly, rail remains more challenging
                                                                                               350

• Strategic initiatives delivering well                                                        300

                                                                                               250

• Focus on                                                                                           2013
                                                                                                      H1
                                                                                                            2014
                                                                                                             H1
                                                                                                                      2015
                                                                                                                       H1
                                                                                                                               2016
                                                                                                                                H1
                                                                                                                                      2017
                                                                                                                                       H1

     ‒ Strategic initiatives, global test bed
     ‒ High renewal rate                                                                                    Operating profit
     ‒ Further brand development                                                               30

     ‒ Selective new business                                                                  20

                                                                                               10

                                                                                                0
                                                                                                     2013   2014      2015   2016     2017
                                                                                                      H1     H1        H1     H1       H1
* SSP revenue by region %s is calculated, adjusting for the impact of annualised India sales
Note: All figures in constant currency

17     SSP: The Food Travel Experts
Continental Europe update
• 37%* of SSP revenue, strong presence in rail and air Revenue
400
• Improved performance reflecting softer Q2 last year 350
• Focus on
300
‒ Cost efficiency and flexibility of labour 250
2013 2014 2015 2016 2017
H1 H1 H1 H1 H1
‒ High renewal rate
‒ Selective new business
‒ Mobilisation of new contracts, particularly in Operating profit
Norway, France and Germany 20
10
0
2013 2014 2015 2016 2017
H1 H1 H1 H1 H1
* SSP revenue by region %s is calculated, adjusting for the impact of annualised India sales
Note: All figures in constant currency
18 SSP: The Food Travel ExpertsNorth America update
• 14%* of SSP revenue Revenue
150
• Focus on air channel, increasing share 100
• Strategic initiatives improving profitability +30bps 50
0
• Focus on 2013
H1
2014
H1
2015
H1
2016
H1
2017
H1
‒ Profitable new business - successful first half
‒ Mobilising new contracts quickly and efficiently Operating profit
‒ Infrastructure and people to support growth 10
‒ Generating efficiencies as business grows
0
-10
2013 2014 2015 2016 2017
* SSP revenue by region %s is calculated, adjusting for the impact of annualised India sales H1 H1 H1 H1 H1
Note: All figures in constant currency
19 SSP: The Food Travel ExpertsRest of World update excl. India
• 10%* SSP revenue, focused on air, initial trials in rail Revenue
150
• 19.8% sales growth including 19.4% net gains
100
• Regional differences 50
‒ Terminal developments impacting: e.g. Abu Dhabi, HK 0
2013 2014 2015 2016 2017
‒ Continued good LFL growth elsewhere: eg China, Thailand H1 H1 H1 H1 H1
• Operating profit growth in line with expectations
Operating profit
• Focus on
10
‒ Profitable new business development, 19.4% net gains
‒ Selective geographic expansion
‒ Infrastructure and people to support growth
0
2013 2014 2015 2016 2017
H1 H1 H1 H1 H1
* SSP revenue by region %s is calculated, adjusting for the impact of annualised India sales
Note: All figures in constant currency
20 SSP: The Food Travel ExpertsRest of World – India update
• Joint venture – combines SSP’s international
expertise and TFS’ local knowledge
• Focused on air
Delhi T3 Kolkata
• LFL sales growth strong
• Good progress on integration
• Focus on Mumbai
‒ Integration
‒ Profitable new business - encouraging H1
‒ Infrastructure and people to support
growth
Chennai Vizag
21 SSP: The Food Travel ExpertsOur focus remains on five key levers to deliver value
1 Optimise our offer to benefit from the positive trends in our markets
2 Grow profitable new space
3 Optimise gross margin and leverage scale benefits
4 Run an efficient and effective business
5 Optimise investment using best practice and shared resource
22 SSP: The Food Travel Experts2 Grow profitable new space
Areas of Focus
• Strong performance, 3.4% net gains
New units within existing sites
• High level of activity involved in opening new
units
• Successful growth in existing sites, new sites Existing markets, new sites
and new markets
• Encouraging pipeline in H2
New markets
• Disciplined approach to new business
• Renewal rate in line with plan
High renewal rate
23 SSP: The Food Travel ExpertsNew opening: JFK Terminal 7
• JFK T7, approx 2m pax, all international
• Tender process during summer 2016
• SSP selected as partner to deliver the “New York
experience” to T7
Boomwich
• 7 units, brands including: Boomwich and Burger Joint
• March 2017 opened temporary units
• Begin opening new permanent units in Autumn 2018
Burger Joint
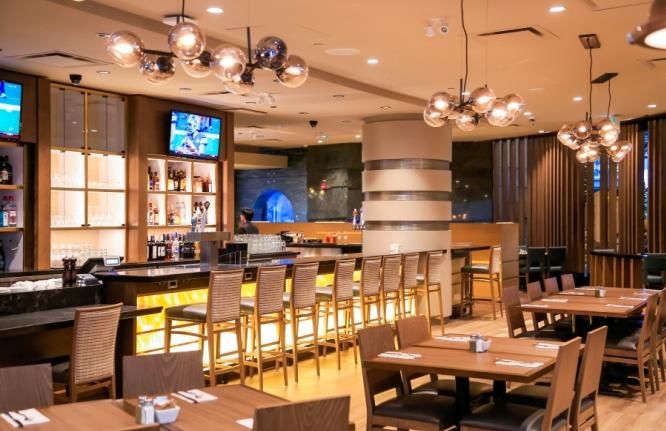
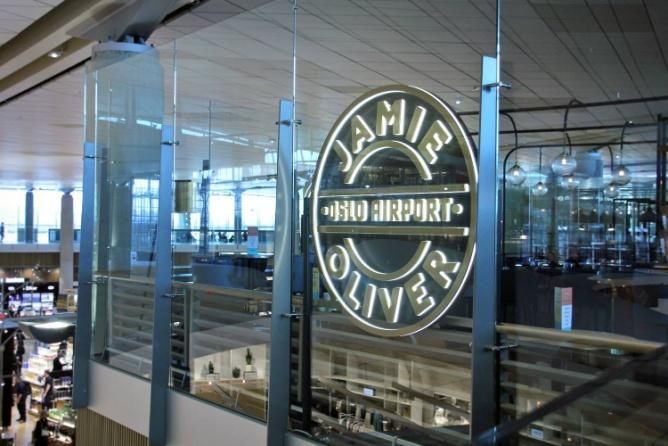
24 SSP: The Food Travel ExpertsContract renewal: Oslo Airport
• SSP present since 1998
• Oslo airport, 25.8 million pax
• Major renovation and extension to airport,
contract re-tendered in 2015 Jamie’s Deli & Bakery
• Operate 30 units and 20 brands
• Many new brands like Deli & Bakery by Jamie
Oliver, Jamie’s Italian, Hunter Bar, Norgesglasset
opened in H1
Norgesglasset
25 SSP: The Food Travel ExpertsGood progress on contract wins including:
Helsinki
5 units
Stavanger
2 units
Ibiza China
5 units 3 units
Phoenix
2 units
New York
Chicago 7 units
Thailand
18 units
3 units
Greece
Toronto 5 units
4 units
SSP presence
26 SSP: The Food Travel Experts1 Optimising our offer
Areas of Focus
• LFL growth of 2.9%, improvement in Q2 Improve ranges
as soft Q2 last year
• Geographic diversification helps Optimise price and promotion
mitigate specific country issues
Upselling
• Underlying positive trends in travel
channels
Maximise use of space
• Strategic initiatives delivering well
Focus on category as well as brand performance
27 SSP: The Food Travel ExpertsOptimising our offer: Case Study – Hot beverage sizes • Coffee sizes well established in main brands • Limited size choice in other brands • Out of line with customer expectations • Missed opportunity to upsell • Core sizes introduced (S/M/L) as standard 28 SSP: The Food Travel Experts
3        Further progress optimising gross margin

• Gross margin improved by 80bps                   Areas of Focus
                                                 Procurement disciplines
• Some increase in food inflation

• Key initiatives making good progress
                                             Simplify and standardise recipes
• Procurement discipline progressing well

• Good progress on simplification and
  standardisation                               Reduce waste and losses

29       SSP: The Food Travel Experts
Gross margins: Camden Food Co – North America
• Range size varies
• Ranges not standardised
JFK Sacremento Boston Toronto
• Multiple recipes for same item
• Best sellers missing, long tail of
slow sellers
Houston Minneapolis Camden Main - Orlando San Diego
• Structure not clear
• Variance in category participation
• Manage mix opportunity
Montreal Camden Express - Orlando Indianapolis Raleigh
30 SSP: The Food Travel Experts4 Encouraging progress on operating efficiency
Areas of Focus
• H1, labour costs 10bps improvement
Service optimisation
• Rising labour costs; minimum wage, living
wage
Improve forecasting and scheduling
• Service optimisation; a major focus in
parallel with forecasting and scheduling
• Further technology being tested Employ technology to improve efficiency
• Multi-year programme
Improve reporting and accountability
31 SSP: The Food Travel ExpertsOperating efficiency: Better Service Planning
More consistent scaling of labour hours with sales…
BEFORE AFTER
• BSP better matches labour spend to sales Labour Labour
• New system now rolled out to all UK units
• Comprehensive training programme
• Initial results encouraging: Sales Sales
‒ More efficient labour usage … and improved matching of hours to sales by day part
‒ Improved service levels BEFORE AFTER
‒ More consistent weekly labour spend vs target Man hrs per
time slot
• Overseas pilots in progress
8am-11am 5pm-8pm 8am-11am 5pm-8pm
3hr day parts 3hr day parts
= Target # of man hours = # of man hours scheduled
32 SSP: The Food Travel Experts5 Optimise investment using best practice and shared resource • Shared service facility for back of house finance • 2 shared service centres now operating • Operations now live in UK, Germany, US, Sweden and Norway - consistent delivery of services • Now trialling in Asia Pacific region • Further services being reviewed 33 SSP: The Food Travel Experts
Summary and outlook
• Strong half year financial performance, profit up 24.7%
• Good LFL sales
• Net new openings ahead of plan
• On-going good progress on margin and efficiency
• EPS 4.2p, up 40%
• Half year dividend of 3.2p, up 28%
• Pipeline encouraging
• Focus on delivering value for our shareholders

34   SSP: The Food Travel Experts
Q&A
Interim Results 2017

   SSP: The Food Travel Experts
Disclaimer
Certain statements in the presentation may constitute “forward-looking statements”. These statements reflect the Company’s current
beliefs and expectations and are based on numerous assumptions regarding the Company’s present and future business strategies and
the environment the Company and members of its group will operate in and are subject to risks and uncertainties that may cause
actual results, performance or achievements to differ materially. Forward-looking statements involve inherent known and unknown
risks, uncertainties and contingencies because they relate to events and depend on circumstances that may or may not occur in the
future and may cause the actual results, performance or achievements of the Company to be materially different from those expressed
or implied by such forward looking statements.

Many of these risks and uncertainties relate to factors that are beyond the Company’s ability to control or estimate precisely, such as
future market conditions, currency fluctuations, the behaviour of other market participants, the actions of regulators and other factors
such as the Company’s ability to continue to obtain financing to meet its liquidity needs, changes in the political, social and regulatory
framework in which the Group operates or in economic or technological trends or conditions. As a result, you are cautioned not to
place undue reliance on such forward-looking statements. Additionally, forward-looking statements regarding past trends or activities
should not be taken as a representation that such trends or activities will continue in the future. Forward-looking statements speak
only as of their date and the Company, any other member of the Group, its parent undertakings, the subsidiary undertakings of such
parent undertakings, and any of such person’s respective directors, officers, employees, agents, affiliates or advisers expressly disclaim
any obligation to supplement, amend, update or revise any of the forward-looking statements made herein, except where it would be
required to do so under applicable law or regulatory obligations. It is up to the recipient of this presentation to make its own
assessment as to the validity of such forward-looking statements and assumptions. Nothing in this presentation shall exclude any
liability under applicable laws that cannot be excluded in accordance with such laws.

36   SSP: The Food Travel Experts
You can also read