MONTHLY UPDATE
South African Edition
March 2020
←
→
Page content transcription
If your browser does not render page correctly, please read the page content below

MONTHLY UPDATE South African Edition March 2020
Hi All,
There are few months which manage to attain infamy in the history of financial markets, October 1987 and
September 2008 are the two that quickly spring to mind. March 2020 will certainly be another entry. The most
jarring aspect of the COVID-19 market crisis has been the unprecedented expediency of the crash. As
illustrated below, it has taken approximately 20 trading days for global equities to fall 35%. In comparison the
2008 Global Financial Crisis (GFC) and 2000 Dot-com bubble, took roughly 240 and 380 days respectively to
reach these levels.
Source: Fairtree Capital and Bloomberg as at 31/03/2020
As Coronavirus (COVID-19) cases and, unfortunately, deaths began to sharply increase, markets took a
dramatic downturn. Monetary and fiscal stimulus proposed by multiple countries only served to give temporary
relief during a very volatile month for all asset classes. This sharp market sell-off was compounded by a
disagreement between OPEC and Russia around the need for production cuts. South African investors took
one extra punch, when Moody’s downgraded the country’s debt to sub-investment grade. This has been an
arduous test of every investor’s composure, but it is paramount to stick with a well-crafted financial plan in
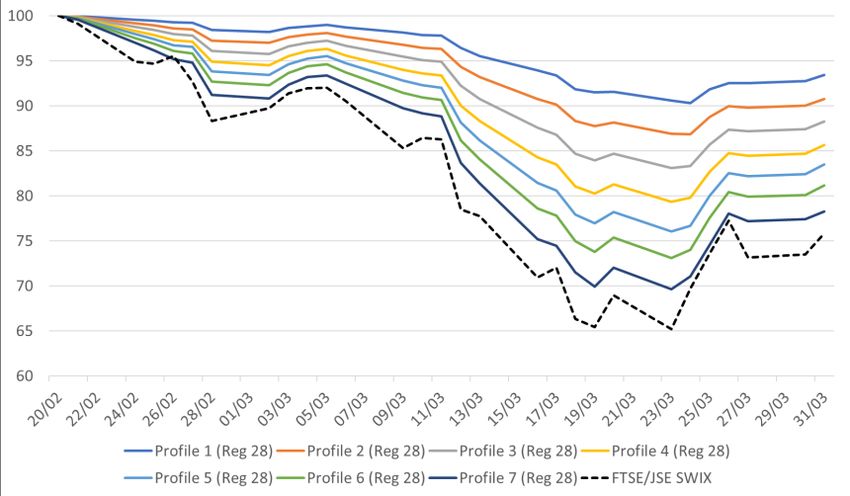
these trying times. We are extremely pleased with how our soundly engineered portfolios have weathered
these turbulent markets.
Source: PortfolioMetrix and Financial Express
Throughout the month we have communicated extensively on our portfolio positioning and current thinking,
links to which are provided below:
• 04/03/2020 Recording and slides| PortfolioMetrix Webinar Composure and black swans
• 03/30/2020 Portfolio Update: South African (ZAR) Solution Rebalance
2• 03/26/2020 SA Market Update
Stay Safe, Stay Health and please Stay at Home,
Russell
PERFORMANCE FEEDBACK, MARCH 2020
(Compiled by Nic Spicer and Russell Brown)
In a first for democratic South Africa, President Cyril Ramaphosa acted emphatically on the 15th of March and
declared a State of Disaster in response to the COVID-19 Pandemic. This initially led to a “soft” countrywide
lockdown, with loose restrictions on travel, communal gathering and the economy. These restrictions were
escalated a week later and have resulted in a 21-day “hard” lockdown, which stipulates complete bans on non-
essential travel, shopping and economic activity. The impact of this on the country will unfortunately be dire.
Knowing this, plus all the existing headwinds facing the South African economy and fiscus, Moody’s
downgraded the country’s debt rating to junk. This decision ended a two-year standoff. As broadly expected,
the downgrade only caused some short-term noise in the market. The true impact of the downgrade will
however only be felt when the increased cost of borrowing associated with junk status filters through the
economy. The South African Reserve Bank (SARB) also acted by cutting interest rates by 1% and starting a
bond buyback program as a form of quantitative easing. Sasol Ltd, was another former darling South African
large cap stock which fell from grace in March. The company has scored several own goals in the past few
years, which had significantly detracted from its share price already. But the dramatic fall in the oil price, from
+/-$ 60 to +/-$25, due to OPEC tensions, was catastrophic for the company’s earnings expectation and debt
covenants. This resulted in the stock falling from +/- R200 to +/-R 25 in March.
It is still VERY early days and there are a lot of unknowns, but one small domestic positive is that the
government’s tough stance on flattening the curve appears to be yielding some results. At the time of writing
(06/04) we have had 9 consecutive days where new cases of COVID-19 have not exceeded 100 infections/day.
Globally, British Prime Minister Boris Johnson announced a UK shutdown during March with strict guidance
as to what people can leave their house for. The Bank of England acted twice, cutting rates from 0.75% to
0.1%, restarted quantitative easing to the tune of an extra £200mn and introduced funding and purchases
schemes as well as capital guidance for banks, all aimed at providing credit to businesses (particularly small
and medium-sized). Alongside this, the government announced a large fiscal stimulus which included business
loans, paying 80% of employee wages to prevent firms having to lay off staff and covering 80% of the incomes
of the self-employed. Data points which show economic activity since the shutdown have been fairly sobering,
with the flash composite purchasing managers’ indices (PMI) for March slumping to 37.1 (from 53 in February),
mostly off the back of a very weak services component as large chunks of the economy ground to a halt (goods
can be stockpiled, services can’t). Datapoints printed in March but for periods prior to the increase in UK
COVID-19 cases had not been favourable either, with GDP growth confirmed at 0% (quarter-on-quarter) for
Q4 2019 and unemployment nudging up to 3.9% in January.
In the US, the Federal Reserve had a bit more ‘dry powder’ to play with but they quickly used this up by cutting
rates from the range of 1.5-1.75% to 0-0.25% and effectively committing to unlimited quantitative easing. This
included funding to support consumer and business debt and direct lending to large corporations as well as,
for the first time, the purchasing of corporate bonds. The US government also pledged to provide $2trn of fiscal
support which will include most taxpayers receiving a cheque for $1,200 and additional money for those with
children. These measures may not be as effective as what the UK has done to ensure staff stay employed and
that has probably been reflected in the weekly unemployment claims for 21st March which spiked to a record
high of 3.3m (data released in early April for week ending 28th March shows this has doubled to 6.6mn). US
services PMI fell dramatically to 39.1 in March, from 49.4 in February, whilst manufacturing edged into
contractionary territory (49.2), resulting in a composite PMI of 40.5 for March.
The European Central Bank did not change interest rates in March but committed to €120bn more of
quantitative easing, additional liquidity support for banks and incentives for them to lend to businesses (in
particular medium- and small-sized companies). They also launched a €750bn temporary programme of
government, corporate bond and commercial paper purchases. In addition national governments announced
various fiscal packages, with Germany making a similar commitment to the UK by compensating staff who are
sent home during this crisis in addition to underwriting corporate debt. Much like in the UK and the US, the
3services PMI tumbled in March to 28.4, an all-time low; manufacturing PMI didn’t suffer quite as much, ‘only’
down to 44.8 (from 49.2 the previous month); overall composite PMIs also reached a record low of 31.4 from
51.6 in February.
To date, Japan has been relatively immune to the COVID-19 outbreak, according to official numbers, although
this could change. A decision has been made to postpone the Tokyo Olympics to 2021. Japan’s GDP for Q4
2019, was revised down in the final reading to -1.8% quarter on quarter. The composite PMI flash reading for
March showed a stark drop to 35.8, the weakest ever figure, as with other countries, this was driven by
particularly weak services numbers. The Bank of Japan has also been active during this time by doubling the
amount of ETFs and Real Estate Investment Trusts it intends to purchase each year to ¥12trn and ¥180bn
respectively, increased corporate debt purchases by up to ¥2trn and offering loans against corporate debt.
China is now showing tentative signs of people going back to work and the economy starting to pick-up slightly
and, more importantly, with no noticeable increase in reported cases and deaths. Data looking at January and
February showed exports slumping 17.2% year-on-year so there will be a focus on the next few readings to
look for any signs of improvement. We have already seen improvements in PMIs with manufacturing jumping
to 52.0 – the strongest level since September 2017.
Disagreement over oil supply cuts between Russia and OPEC triggered both Saudi Arabia and Russia to
increase supply. This hit oil prices hard and has subsequently affected a large number of other oil export reliant
countries.
March Overview
The rand weakened significantly over the course of the month. This was largely due to a general flight from
risky Emerging Market to safer Developed Market currencies.
USD/ZAR EUR/ZAR GBP/ZAR JPY/ZAR
28/02/2020 15.732 17.280 20.094 0.146
31/03/2020 17.860 19.597 22.146 0.165
13.53% 13.41% 10.21% 13.44%
*Red means weakening Source: PortfolioMetrix, Financial Express
Asset Classes
Global markets continued to sell-off in March due to the spread of COVID-19 and the geopolitical risk
associated with Saudi Arabia/Russia Oil tension. Global bonds in rands performed very well over the month
demonstrating their ability to act as a “shock absorber” in local portfolios. Local property continued its rout as
the asset class fell another astonishing -36.6% over the month, this is on the back of a -16% fall in February.
Local equities also fell sharply with all sectors feeling the effects of the risk off environment.
Below is a summary of performance of the broader asset classes for the month:
Source: PortfolioMetrix, Financial Express
4GPS PERFORMANCE FEEDBACK, MARCH 2020
GBP Asset Classes and Currency Performance
All asset classes fell heavily over the month with the exception of global sovereign bonds which were up 2.4%.
Global equities were particularly hard hit, although Japanese equities shone in a relative sense with yen
strengthening against the pound helping returns. Pacific ex Japan equities (predominantly made up of
Australian shares) were the worst performing equity asset class in sterling terms, but real assets and
specifically global property and commodities sold off hard.
Whilst sovereign bonds held up well over the month (albeit with a lot of intra-month movement), riskier bonds
really suffered, with high yield bonds the worst performer due to liquidity issues and an increased fear of
default. High yield bonds of energy companies, a significant part of the index, struggled in particular as a result
of the lower oil price.
GBP ASSET CLASS
PERFORMANCE FOR THE MONTH
Global Global Global High Emerging
Sovereign Corporate Yield Bonds Market Bonds North America Europe ex UK UK Equity Japan Equity Pacific ex Japan
Bonds (GBP) Bonds (GBP) (GBP) (GBP) Equity (GBP) Equity (GBP) (GBP) (GBP) Equity (GBP)
2.44% -4.68% -11.59% -8.40% -10.56% -11.35% -15.07% -4.35% -17.84%
EM Equity Global Commodities
(GBP) Property (GBP) (GBP)
-12.85% -20.07% -27.30%
Source: PortfolioMetrix, Financial Express
GBP CURRENCY PERFORMANCE FOR THE MONTH
GBP/USD GBP/EUR GBP/JPY GBP/ZAR GBP/AUD GBP/CHF
29/02/20 1.277 1.163 137.776 20.094 1.981 1.236
31/03/20 1.240 1.130 133.859 22.145 2.026 1.200
-2.92% -2.82% -2.84% 10.21% 2.26% -2.96%
Weaker Weaker Weaker Stronger Stronger Weaker
Source: PortfolioMetrix, Financial Express
USD Asset Classes and Currency Performance
The US dollar continued to strengthen over the month against all developed currencies. As a result, asset
class returns were less attractive when viewed in USD terms. The USD gained significant ground against
Emerging Market currencies.
USD ASSET CLASS PERFORMANCE FOR THE MONTH
Global Global Global High Emerging
Sovereign Corporate Yield Bonds Market Bonds North America Europe ex UK UK Equity Japan Equity Pacific ex Japan
Bonds (USD) Bonds (USD) (USD) (USD) Equity (USD) Equity (USD) (USD) (USD) Equity (USD)
-0.45% -7.37% -14.09% -11.07% -13.18% -13.94% -17.55% -7.15% -20.24%
EM Equity Global Commodities
(USD) Property (USD) (USD)
-15.40% -22.40% -29.43%
5Source: PortfolioMetrix, Financial Express
USD CURRENCY PERFORMANCE FOR THE MONTH
USD/GBP USD/EUR USD/JPY USD/ZAR USD/AUD USD/CHF
29/02/20 0.783 0.910 107.865 15.732 1.551 0.968
31/03/20 0.806 0.911 107.955 17.860 1.634 0.968
3.01% 0.11% 0.08% 13.53% 5.34% -0.04%
Stronger Stronger Stronger Stronger Stronger Weaker
Source: PortfolioMetrix, Financial Express
PROFILE PERFORMANCE
Local Profile Performance
Period performance for the profiles as at the end of the month are shown below (all periods greater than a
year are annualised):
REGULATION 28 PROFILE PERFORMANCE
Profile 1 Profile 2 Profile 3 Profile 4 Profile 5 Profile 6 Profile 7
(Reg 28) (Reg 28) (Reg 28) (Reg 28) (Reg 28) (Reg 28) (Reg 28)
1 Month -5.09% -6.69% -8.15% -9.73% -11.04% -12.49% -14.23%
3 Month -5.10% -7.68% -9.90% -12.28% -14.19% -16.51% -19.35%
6 Month -3.44% -5.75% -7.78% -9.82% -11.50% -13.40% -15.76%
1 Year 0.63% -2.13% -4.49% -6.94% -8.92% -11.29% -14.17%
2 Years 5.04% 3.54% 2.35% 0.95% -0.14% -1.55% -3.12%
3 Years 5.98% 4.78% 3.86% 2.89% 2.12% 1.03% -0.32%
5 Years 6.83% 5.84% 5.01% 4.15% 3.45% 2.51% 1.25%
Since Inception 7.90% 7.82% 8.21% 8.58% 8.90% 9.06% 9.08%
DISCRETIONARY PROFILE PERFORMANCE
Profile 1 Profile 2 Profile 3 Profile 4 Profile 5 Profile 6 Profile 7
(Disc) (Disc) (Disc) (Disc) (Disc) (Disc) (Disc)
1 Month -5.59% -7.18% -8.74% -10.45% -12.01% -13.49% -15.07%
3 Month -5.96% -8.48% -10.85% -13.41% -15.81% -18.34% -21.07%
6 Month -4.22% -6.52% -8.60% -10.84% -12.89% -14.91% -17.09%
1 Year -0.30% -2.99% -5.44% -8.07% -10.50% -13.03% -15.72%
2 Years 4.49% 3.09% 1.88% 0.54% -0.73% -2.16% -3.57%
3 Years 5.49% 4.33% 3.40% 2.38% 1.42% 0.14% -1.14%
5 Years 6.45% 5.47% 4.61% 3.69% 2.81% 1.65% 0.50%
Since Inception 7.92% 7.93% 8.47% 8.85% 9.19% 9.28% 9.24%
6GPS Profile Performance
Period performance for the profiles as at the end of the month are shown below (all periods greater than a
year are annualised):
PMX UCITS – GPS (GBP) PERFORMANCE
Profile 3 - Profile 4 - Profile 5 - Profile 6 - Profile 7 -
Model UCITS UCITS UCITS UCITS
1 Month -8.09% -9.42% -10.62% -11.72% -12.75%
3 Month -10.02% -11.82% -14.36% -16.61% -18.66%
6 Month -12.05% -13.69% -15.57% -17.26% -18.82%
1 Year -4.23% -6.43% -8.72% -10.77% -12.65%
2 Year 1.15% -0.10% -1.28% -2.36% -3.34%
3 Year 0.23% -0.20% -0.53% -0.90% -1.21%
5 Year 2.87% 3.06% 3.37% 3.59% 4.48%
Since Inception 4.10% 4.59% 5.11% 5.43% 6.31%
PMX UCITS – GPS (USD) PERFORMANCE
Profile 3 - Profile 4 - Profile 5 - Profile 6 - Profile 7 -
Model UCITS UCITS UCITS UCITS
1 Month -10.77% -12.08% -13.25% -14.31% -15.31%
3 Month -15.35% -17.38% -19.76% -21.86% -23.78%
6 Month -11.35% -13.17% -15.06% -16.75% -18.32%
1 Year -9.07% -10.91% -13.09% -15.04% -16.83%
2 Year -4.95% -6.34% -7.60% -8.71% -9.72%
3 Year -0.22% -0.87% -1.38% -1.88% -2.30%
5 Year
Since Inception 1.08% 0.84% 0.74% 0.50% 0.59%
7You can also read