Gap Analysis of University Online Learning Website from Students' Perspectives: A Case from Telkom University, Indonesia
←
→
Page content transcription
If your browser does not render page correctly, please read the page content below

Journal of Physics: Conference Series

PAPER • OPEN ACCESS

Gap Analysis of University Online Learning Website from Students’
Perspectives: A Case from Telkom University, Indonesia
To cite this article: M Pradana et al 2021 J. Phys.: Conf. Ser. 1752 012069

View the article online for updates and enhancements.

 This content was downloaded from IP address 46.4.80.155 on 04/07/2021 at 23:38
ICSMTR 2019 IOP Publishing
Journal of Physics: Conference Series 1752 (2021) 012069 doi:10.1088/1742-6596/1752/1/012069

Gap Analysis of University Online Learning Website from
Students' Perspectives: A Case from Telkom University,
Indonesia

 M Pradana1*, M D Rahmawan2, S Wahyuddin3 and R Imam1
 1
 Telkom University, Indonesia
 2
 Latimodjong Student House, Indonesia
 3
 AMIK Lamappapoleonro, Indonesia

 *email: mahirpradana@telkomuniversity.ac.id

 Abstract. The purpose of this research is to observe the perceived quality of Telkom
 University online learning website from students' perspectives. Students here act as the main
 users of the learning platform and we would like to see whether the perceived quality and the
 ideal quality already fulfil users' expectation. The data used are the primary and secondary data
 with a set of sample taken from 100 students. We use the question items from website quality
 method and analyse the data with importance performance analysis (gap analysis). The
 research shows that the usability and service interaction aspects of the website have quite
 significant gaps between perceived and ideal qualities.

 Keywords: Education Management, Website Quality, Virtual Learning, Gap Analysis

1. Introduction
Implementing effective information technology (IT) will reduce unexpected costs and increase
flexibility [1]. This type of technology brings the world of communication into a new paradigm. The
existence of the internet has removed national borders in terms of information flow [2]. This results in
an increasingly dynamic educational environment. Universities that are not able to adapt to this
development will not be able to compete with universities that are already capable [3].
The growth of internet users in Indonesia continues to increase from year to year. Noted penetration of
an increase in internet users in Indonesia by 28% from the number of 71.19 million users in 2013
increased to 82 million users in the first quarter of 2019 [4]. The world of education is demanded to
always improve its quality so that Indonesian people can survive and be able to adjust in this era of
information disclosure [3]. Universities as one of the education units are also required to provide
public services, both public and private universities.
 For this reason, a virtual educational platform is needed by university as one of the information
services, both for lecturers, students and other general public [5]. The website itself is a form of mass
media whose publication is via the internet and can be accessed 24 hours and from any hemisphere [6].
Another advantage of publication via the website is its interactive capabilities and very fast
distribution [7]. Thus, the website can be a gateway for educational institutions to go public. The
quality of a good information system which in this study is a website according to [8]. The quality of
the system is measuring the information process through the system used or the relationship between
the characteristics of the system with the successful implementation [9]. Meanwhile, the quality of
 Content from this work may be used under the terms of the Creative Commons Attribution 3.0 licence. Any further distribution
 of this work must maintain attribution to the author(s) and the title of the work, journal citation and DOI.
Published under licence by IOP Publishing Ltd 1
ICSMTR 2019 IOP Publishing
Journal of Physics: Conference Series 1752 (2021) 012069 doi:10.1088/1742-6596/1752/1/012069

information is a function that concerns the value of the output produced by a system that is felt by the
user [10].
 Based on these indications, this study conducted an analysis of the quality of information
systems from the Telkom University website with the Webqual approach and Importance Performance
Analysis (IPA) according to students' perceptions, especially students of Telkom University's Faculty
of Communication and Business. Webqual is one method of measuring website quality based on end-
user ratings. Webqual is prepared based on three assessment criteria, namely, usability, information
and service interaction. Whereas IPA is an analytical technique used to identify the factors of an object
of measurement on its performance and importance. User ratings can be divided into two perspectives,
namely, the assessment of the desired quality (ideal) and the perceived quality (actual). The level of
quality can be demonstrated by looking at the gap (gap) between these two assessment perspectives.
The objectives of this research are to find out the quality level of Telkom University website
information system based on the dimensions that exist in Webqual; to find out the quality level of
Telkom University website information system based on the gap (gap) between perceived quality
(actual) and desired quality (ideal); and to describe the position of information system quality
indicators of Telkom University virtual learning website so that it shows which indicators are in
accordance with user expectations and which indicators need improvement.

2. Literature Review
Quality measurement is one important element in the aspects of integrated quality management [11].
Quality measurements of goods and services or other parts of the company body will be useful to
provide information about current performance [12]. Referring to the quality of the information
system, [7] revealed that the quality of the system was measuring the information process through the
system used or the relationship between the characteristics of the system and the successful
implementation. Meanwhile the quality of information is a function that concerns the value of the
output produced by a system that is felt by the user [7].
 From this context, quality in information systems can be concluded as the value of characteristics
in an information system that is felt by the user [10]. The quality of information systems is often
associated with the quality of services because of the nature of the information system that has
similarities with the characteristics provided to the recipient. [13] concluded that quality is in
accordance with customer specifications. The basic idea is that quality does not meet a number of
criteria established by the company, instead quality meets the criteria set by the customer.
 There are two dominant theory models that are built based on information systems and marketing
disciplines for website quality measurement. The two theoretical models are Technology Acceptance
Model (TAM) and Web Quality (Webqual). Technology Acceptance Model (TAM) was first put
forward by [14], is a method of approach to explain and predict one's acceptance of information
technology. The TAM model believes that the actual use of technology can be predicted from the
intentions of its users and attitudes towards its use, which in practice is influenced by the ease of use
and its benefits.
 On the other hand, website quality is one of the methods of measuring website quality developed
by Stuart Barnes and Richard Vidgen [10]. This method is a development of SERVQUAL which was
widely used before in measuring service quality in general. Webqual is based on the concept of
Quality Function Deployment (QFD), namely, "structured and disciplined processes that provide a
means to identify and carry the voice of the customer through each stage of product and or service
development and implementation" which can be interpreted as a structured and disciplined process that
presents a means of identifying and bringing in the voice of customers through each stage of
development and implementation of a product or service. From the QFD concept which states the
development of a product or service is preceded by a "voice of customer", webqual is prepared based
on the perception of the end user (end user) of a website.
 Quality measurement is one important element in the aspects of integrated quality management.
Quality measurements of goods and services or other parts of the company body will be useful to
provide information about current performance. Referring to the quality of the information system, [7]

 2
ICSMTR 2019 IOP Publishing
Journal of Physics: Conference Series 1752 (2021) 012069 doi:10.1088/1742-6596/1752/1/012069

revealed that the quality of the system is measuring the information process through the system used or
the relationship between the characteristics of the system and the successful implementation. While the
quality of information is a function that concerns the value of the output produced by a system that is
felt by the user.
 As mentioned before, quality in information systems can be concluded as the value of
characteristics in the information system that is felt by the user [7]. According to [15], service quality
is how far the difference is between reality and customer expectations for the service they receive.

3. Research Methodology
This research is categorized into descriptive research type using quantitative methods. Descriptive
research is a form of research that studies problems in society, as well as the procedures that apply in
society and situations, including relationships, the activities, attitudes, views, and processes that are
taking place and the effects of a phenomenon [16]. The sampling technique used in this study is
multistage sampling in which sampling uses more than one probability sampling technique. The first
part is Proportionate Stratified Random Sampling and the second using Accidental Sampling [17].
In this study, we chose not to use "neutral" instrument items to minimize "ambiguous" data, so the
results obtained were less accurate. The Likert scale design used in this study follows the original
WEBQUAL instrument with a scale of 1-4 (1 = strongly disagree, 4 = strongly agree). Data collection
was done by online questionnaire. Questionnaires were distributed in several forums and social media
that are relevant to the sample and population is 100 Telkom University students.
 The gap analysis was conducted to answer the problem “how is the level of Telkom University
website quality viewed from the gap (perceived gap) between perceived quality (actual) and desired
quality (ideal)?” The actual quality was indicated by respondents' assessment of performance
(performance) website quality building attributes based on WEBQUAL dimensions, while the ideal
quality was shown from the respondents' assessment of the importance of these quality attributes. For
determining the value of the gap, it could be seen from the disagreement between the value of the
actual quality (performance) and ideal quality (importance).

 = –

 = quality level
 = actual quality value (performance)
 = ideal quality value (importance)

4. Result and Discussion
A good level of quality is indicated by a positive result or ≥0. This means that the actual quality
value meets the ideal quality expected by the user. Conversely, if the result is
ICSMTR 2019 IOP Publishing
Journal of Physics: Conference Series 1752 (2021) 012069 doi:10.1088/1742-6596/1752/1/012069

 Table 1. Question Items on Usability.
 Indicators Perf. Imp. Q
 (P) (I) (P-I)
 1 Easy to operate 3,00 3,01 -0,01
 2 Positive experience 3,04 3,04 0,00
 3 Competitive power 2,98 2,92 0,06
 4 Compatible design 3,07 3,09 -0,02
 5 Easy to use 2,96 3,00 -0,04
 6 Understandable instruction 2,81 2,95 -0,06
 Average 2,97 3,06 -0.09
 Source: analysed by authors

Table 1 above shows the gap values for indicators in the usability dimension. From this table, it can be
seen that the difference value between the actual quality (performance) and the ideal quality
(importance) of all indicator is negative. The average difference value of - (0.09) indicates the negative
value or Q
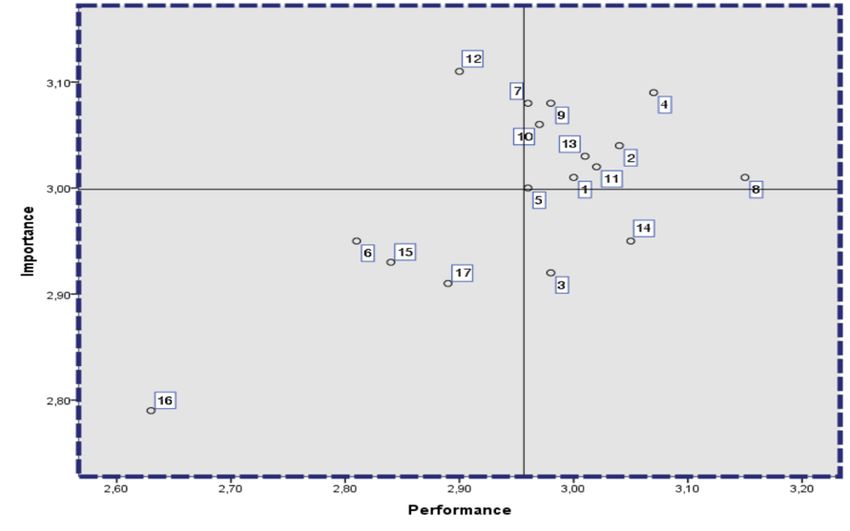
ICSMTR 2019 IOP Publishing
Journal of Physics: Conference Series 1752 (2021) 012069 doi:10.1088/1742-6596/1752/1/012069

 The table above shows the value of the gaps of the indicators in the Service Interaction
dimension. From this table, it can be seen that the difference between the actual quality (performance)
and ideal quality (importance) of all indicators is negative. The average difference value of - (0.11).
After analysing every dimension, we used gap analysis or Importance Performance Analysis (IPA) to
answer problem “which website quality indicators are in accordance with the wishes of users and
which ones need improvement?” The results of the IPA showed the location of each indicator in the
IPA matrix consists of four quadrants.
 In determining the coordinates for each indicator, the average weighting of indicators is used and
shows the position of the indicator in the IPA matrix graph (figure 1). The different colors of the
markers represent the indicators of each dimension.
 In this study, website quality measurements were carried out with WEBQUAL approach and
Importance Performance Analysis (IPA) instruments. Science is a very useful analytical tool to
describe the relationship between valuation factors seen from the level of importance and performance
[17].
Based on the results of the study showed that indicator no 12 "reliable information" needed to improve
this in accordance with the conditions in the reality where respondents in this study were students who
did not believe in the information on the website and were more likely to seek information on the
official account of the student organization.

 Figure 1. IPA matrix.

Based on the indications above results that the quality of information can be trusted could not meet the
expectations of students because the indicator is in quadrant I and has a high gap value. In a previous
study conducted by Juhanda (2011) that it was a high gap in the dimension WEBQUAL information
dimension which stated the results of the negative gap and IPA in quadrant I is an indicator of the
information dimension can be said to not be able to meet the expectations of users [17].
5. Conclusion
The level of information system quality on the Telkom University website on the usability dimension
for the category is above, while the level of expectation for the category is high but higher than reality
so that it is in line with user expectations. Quality level information system on the Telkom University
website on the dimension information to be in the high category, while for expectations to be at high
category but higher than reality so that something is not according to user expectations. The level of
information system quality on the Telkom University website on the service interaction dimension for
the high category, while for convenience is in the category high but higher than reality so it is not in
accordance with user expectations.
 The level of information system quality on the Telkom University website seen from the
perceived quality gap (actual) and the desired quality (ideal) shows that the dimensions of usability,

 5
ICSMTR 2019 IOP Publishing
Journal of Physics: Conference Series 1752 (2021) 012069 doi:10.1088/1742-6596/1752/1/012069

dimensions information, and the service interaction dimension have a negative value which means that
the actual quality perceived at this time cannot meet the ideal quality desired by the user, so the quality
level is still poor. Thus the reality is not yet fulfilling website user expectations.
Website information system quality indicators that are in accordance with user desires and who need
improvement. Indicators of the quality of information systems on the Telkom University website that
are in accordance with the wishes of users are in quadrant II, namely Indicator 1 "easy to learn and
operate", indicator 2 "positive experience", indicator 4 "design in accordance", indicator 5 "easy to
use", indicator 7 "accurate information", indicator 8 "information with the right level of detail",
indicator 9 "information easily understood", indicator 10 "relevant information", indicator 11 "actual
information", indicator 13 "good reputation" which has a high level of importance and its performance
too feel good. Information system quality indicators on the Telkom University website that need
improvement are in quadrant I, which is indicator 12 "reliable information" which has a high level of
importance but its performance is felt to be low.
 Based on the results of descriptive analysis shows that the three dimensions of Webqual have
higher expectations, but the reality does not match user expectations, it is recommended that website
managers better understand the user's expectations such as by making observations about the user's
expectations for the website. Last but not least, when viewed from the IPA analysis indicator 12
"reliable information", website managers are expected to make improvements or improve their
performance such as gathering information needed by students and loaded on the website and always
providing information in accordance with the reality that exists in real time.
For further research, research with Website quality measurement will still have meaningful
contributions. Research development can be done by connecting website quality with the main service
quality of the company website owner. More broadly, research can be done on several company
websites that are in one industry or an educational institution. It is also expected that to apply
measurements, website quality in companies and educational institutions that are judged to have flaws
in order to become input for managers the website.

Acknowledgments
Authors wishing to acknowledge department of information system of Telkom University for
becoming a research partner and Telkom University Center of Research and Publication for the
funding.

References

[1]. Bahli, B., & Rivard, S. (2003). The information technology outsourcing risk: a transaction cost
 and agency theory‐based perspective. Journal of Information Technology, 18(3), 211-221.
[2]. Deibert, R. J., & Villeneuve, N. (2016). Firewalls and power: An overview of global state
 censorship of the Internet. In Human rights in the digital age (pp. 125-138). Routledge-
 Cavendish.
[3]. Martilla, J. A., & James, J. C. (1977). Importance-performance analysis. Journal of marketing,
 41(1), 77-79.
[4]. Hafid, H., Pradana, M., Diandri, M., & Bunga, N. (2019). The influence of brand equity toward
 Indonesian prepaid SIM card customers’ purchase decision. Sustainable Collaboration in
 Business, Technology, Information and Innovation (SCBTII).
[5]. Parasuraman, A., Berry, L. L., & Zeithaml, V. A. (1993). More on improving service quality
 measurement. Journal of retailing, 69(1), 140-148.
[6]. Venkatesh, V., & Davis, F. D. (2000). A theoretical extension of the technology acceptance
 model: Four longitudinal field studies. Management science, 46(2), 186-204.
[7]. Pradana, M., & Novitasari, F. (2017). Gap analysis of Zalora online application: Indonesian
 users' perspectives. International Journal of Learning and Change, 9(4), 334-347.
[8]. Oproiu, G. C. (2015). A study about using e-learning platform (Moodle) in university teaching
 process. Procedia-Social and Behavioral Sciences, 180, 426-432.

 6
ICSMTR 2019 IOP Publishing
Journal of Physics: Conference Series 1752 (2021) 012069 doi:10.1088/1742-6596/1752/1/012069

[9]. Arasid, W., Abdullah, A. G., Wahyudin, D., Abdullah, C. U., Widiaty, I., Zakaria, D. & Juhana,
 A. (2018). An Analysis of Website Accessibility in Higher Education in Indonesia Based on
 WCAG 2.0 Guidelines. In IOP Conference Series: Materials Science and Engineering (Vol.
 306, No. 1, p. 012130). IOP Publishing.
[10]. Barnes, S., & Vidgen, R. (2000). Webqual: an exploration of website quality. ECIS 2000
 Proceedings, 74.
[11]. Pradana, M., & Amir, N. (2016). Measuring E-Learning Effectiveness at Indonesian Private
 University. International Journal of Environmental and Science Education, 11(18), 11541-
 11556.
[12]. Fakhri, M., Aditya, M., & Pradana, M. (2014). Factor analysis of work motivation using
 Maslow’s hierarchy of needs: Case study on civil servants at Banten Province’s Office of
 Agriculture and Livestock. In International Conference on Emerging Trends in Academic
 Research (pp. 258-274).
[13]. Saragih, R., Fakhri, M., Pradana, M., Gilang, A., & Vidjashesa, G. A. (2018). Ethical
 Leadership’s Effect on Employee Discipline: Case of An Indonesian Telecommunication
 Company. In Proceedings of the International Conference on Industrial Engineering and
 Operations Management.
[14]. Setiawan, H., Minarsih, M. M., & Fathoni, A. (2016). Influence of Product Quality, Service
 Quality and Trust on Customer Satisfaction and Customer Loyalty with Satisfaction as
 Intervening Variables (Case Study on Rejo Agung Successful Cooperative Customers of
 Ngaliyan Branch). Journal of Management, 2 (2).
[15]. Zarzuela, M. M., Pernas, F. J. D., Calzón, S. M., Ortega, D. G., & Rodríguez, M. A. (2013).
 Educational tourism through a virtual reality platform. Procedia Computer Science, 25, 382-
 388.
[16]. Pradana, M., & Puspitasari, D. N. (2016). Webqual Analysis Of Telkom University's
 Openlibrary System From The Perspectives Of Communication And Business Students.
 Bandung Creative Movement (BCM) Journal, 3(1).
[17]. Negash, S., Ryan, T., & Igbaria, M. (2003). Quality and effectiveness in web-based customer
 support systems. Information & management, 40(8), 757-768.

 7
You can also read