SUBSYSTEMS AND GROUPS IN LIFE CYCLE ASSESSMENTS WITH VAGUE INPUT DATA SUBSYSTEME UND GRUPPEN IN ÖKOBILANZEN MIT VAGEN EIN-GANGSDATEN
←
→
Page content transcription
If your browser does not render page correctly, please read the page content below
SUBSYSTEMS AND GROUPS IN LIFE CYCLE ASSESSMENTS WITH VAGUE INPUT DATA

SUBSYSTEMS AND GROUPS IN LIFE CYCLE ASSESSMENTS WITH
VAGUE INPUT DATA

SUBSYSTEME UND GRUPPEN IN ÖKOBILANZEN MIT VAGEN EIN-
GANGSDATEN

Helen Hein, Joachim Schwarte
Institute of Construction Materials, University of Stuttgart

SUMMARY
 When interval arithmetic is used to calculate life cycle inventories in the
context of life cycle assessments, the accuracy of the results depends on the to-
pology of the product systems under consideration. In principle, depending on the
calculation method used, product systems with a non-tree-like structure can be
expected to have result intervals that are far too wide for numerical reasons. This
may lead to pessimistic interpretations which are not justified by the product sys-
tems. This phenomenon therefore requires further investigation. The problem area
addressed is presented systematically in this article. Possible solutions are pre-
sented, which are currently being implemented and tested in the prototype-like
software MultiVaLCA [1].

ZUSAMMENFASSUNG
 Bei der Nutzung von Intervallarithmetik zur Berechnung von Sachbilanzen
im Rahmen von Ökobilanzen ist die Genauigkeit der Ergebnisse von der Topolo-
gie der jeweils betrachteten Produktsysteme abhängig. Grundsätzlich ist bei Pro-
duktsystemen, die eine nicht-baumartige Struktur aufweisen, je nach Rechenver-
fahren mit unterschiedlichen Ergebnisintervallen zu rechnen, die aus numerischen
Gründen auch eine deutlich zu große Breite aufweisen können. Dies kann gege-
benenfalls pessimistische Interpretationen zur Folge haben, die im tatsächlichen
Produktionsprozess des durch das abgebildete Produktsystem nicht auftreten wür-
den. Dieses Phänomen bedarf somit näherer Untersuchung. Der angesprochene
Problemkreis wird in diesem Artikel systematisch dargestellt. Es werden Lö-
sungsmöglichkeiten vorgestellt, die aktuell in der prototypartigen Software Mul-
tiVaLCA [1] implementiert und getestet werden.

 61 Otto-Graf-Journal Vol. 19, 2020
H. HEIN, J. SCHWARTE

1. THE TOPOLOGY OF PRODUCT SYSTEMS
 For the purpose of calculating the life cycle inventory of a product system,
the first step in the process is to clarify what quantities of the intermediates oc-
curring in the product system are required for the target quantity of the target
product at the respective interfaces. This leads to the calculation of scaling factors,
which quantify the respective intensity of use of each existing unit process. These
numerical values in turn can be summarized in a scaling vector (see [2], p. 327 ff).
In the simplest case, a product system consists of a chain of successive unit pro-
cesses (see Fig. 1).

Fig. 1: Linear product system, consisting of three unit processes. The numerical values of the
 product flows refer to the balance of the individual unit processes before calculation of the
 scaling vector

The calculation of the scaling vector of such chain-shaped product systems is -
for conventional as well as for interval-based life cycle assessments - largely triv-
ial. Here, the solution of the linear algebraic system of equations can be performed
"sequentially", i.e. the individual scaling factors can be calculated one after the
other, i.e. starting from the final product, step by step backwards along the unit
process chain, since then the scaling factors to be calculated are the only un-
knowns in the individual equations of the unit processes.
In many cases, product systems do not have a chain-like but a tree-like topology
(see Fig. 2). The life cycle inventory of a tree-like product system can also be
performed step by step as described above.
Here and in the following it is assumed that the resulting system of equations is
solvable and that the unambiguity of the solution is guaranteed also on the basis
of interval arithmetic. Product systems, where this is the case, can generally be
described as unambiguously balanceable systems.

 62
SUBSYSTEMS AND GROUPS IN LIFE CYCLE ASSESSMENTS WITH VAGUE INPUT DATA

 Fig. 2: Tree-like product system, consisting of three unit processes. The numerical values of
 the product flows refer to the balance of the individual unit processes before calculation of
 the scaling vector

However, if the topology of a product system contains nets or cycles, i.e. if the
tree structure is disturbed, the solution of the system of equations for the calcula-
tion of the scaling vector with the "sequential" approach is only possible by sev-
eral iterations. Although this is usually possible without problems with the con-
ventional method, it can be advantageous in these cases to use direct solution
methods. As is well known, numerous methods are available for this purpose. If,
however, as described elsewhere (see [3 - 6]), the entire LCA is processed using
interval arithmetic, a fundamental problem arises for product systems that are not
structured like trees.
So in interval arithmetic the commutative and the associative law are valid for
elementary algebraic operations, but the distributive law cannot be maintained in
interval arithmetic [7]. This means, that the sequence of a connexion of two or
three operands has no influence on the results, e.g.:

 � , � + � , � + [ , ] = � , � + � , � + [ , ]
However, the calculation sequence of two connexions can affect the result, i.e. not
all connexions are compatible with other connexions, for example:

 �� , � − � , �� ∙ � , � ≠ � , � ∙ � , � − [ , ] ∙ � , �
This also means, that the single arithmetic steps cannot be reversed by opposite
arithmetic steps, but sometimes lead to a further enlargement of the result interval.
In principle is valid, that every single step of calculation leads to an enlargement
of the result interval. This numerically caused interval widening has to be pre-
vented or at least limited as far as possible, because otherwise the width of the

 63 Otto-Graf-Journal Vol. 19, 2020
H. HEIN, J. SCHWARTE

result intervals cannot be interpreted in the intended way and used for the evalu-
ation of the underlying product system. On the other hand, it is positive that there
is no undesired narrowing of the result intervals.

Fig. 3: Product system consisting of three unit processes, whose original chain-like structure
 is disturbed by the by-product P2 occurring in unit process M1

Two cases with non-tree-like topology can be distinguished in principle: this is
the occurrence of an internal by-product (see Fig. 3) and the presence of an inter-
nal recycling loop (see Fig. 4).

 Fig. 4: Product system consisting of three unit processes whose original list-like structure is
 disturbed by the by-product P1 occurring in unit process M3

Under the assumption that the end product of a product system to be achieved is
to be generated and not consumed, it can happen in these two cases that the scaling
vector in the result has one or more values with a negative sign. These may be
modelling errors based on the assumption that the by-products and recycling
streams within the product system can actually all be reused. If this is not the case,
the product system must be supplemented by additional unit processes that take
over the necessary disposal of the surplus product stream.

 64
SUBSYSTEMS AND GROUPS IN LIFE CYCLE ASSESSMENTS WITH VAGUE INPUT DATA

2. SUBSYSTEMS
 If it is possible or even necessary to delimit or separately model a subsystem
within a product system which, when considered on its own, represents a system
that can be clearly accounted for and whose associated life cycle inventory can
thus be calculated separately, the relevant part can be designated as a subsystem
and evaluated accordingly. It is also possible to add a subsystem to a superordinate
product system for modelling purposes. In case of chain- or tree-like product sys-
tems, any subsystem can be treated in this way (see Fig. 5).

Fig. 5: Linear product system with the two exemplary subsystems Subsystem A, consisting of
 unit processes M1 and Subsystem B, consisting of Subsystem A and unit process M2

In cases where the chain- or tree-like structure of a product system is disturbed by
the presence of internal by-products or recycling cycles, the delimitation of sub-
systems cannot be arbitrary in the unrestricted manner described.

 Fig. 6: Product system whose chain-like structure is disturbed by the by-product K1. There-
 fore the smallest possible subsystem B consists of unit processes M1 and M2

Rather, it is necessary to locate the parts of the system in which the by-products
and recovery streams occur and to assign each of these completely to a corre-
sponding subsystem (see Fig. 6).

 65 Otto-Graf-Journal Vol. 19, 2020
H. HEIN, J. SCHWARTE

3. GROUPS
 A special case that deserves special attention is when there are several unit
processes within the product system that can be used to provide the same inter-
mediate product side by side. A combination of such unit processes is referred to
as a unit process group in the following. Unit process groups can be considered
the most important special case of the more general groups within a general LCA
system.
Product systems that contain unit process groups cannot be uniquely assigned. In
order to avoid these difficulties, the available options are usually not recorded as
individual unit processes, but as an overall unit process group in which the data
from the unit processes are averaged with an appropriate weighting. This ap-
proach has the blatant disadvantage that the elementary flows and thus the envi-
ronmental impacts resulting from the worst of the available options are hidden, so
to speak, by grouping the better options with the better variants - possibly even
with clear intent. The typical example of the described procedure is the so-called
"electricity mix" (see Fig. 7).

 Percentage share of GWP [kg CO2 eq.] in relation to their MJ contribution

 226%
 203%
 GWP [kg CO2 eq.]

 156%
 127%
 97%

 34%
 20% 13% 16%
 10% 2%
 1% 1%

 Electricity from different energy sources

 Fig. 7: German electricity mix and its percentage share of GWP in relation to MJ contribu-
 tion of the respective energy sources
As a (sub)system, the electricity mix represents the composition of the average
electricity production of a country. The results of the GWP of the individual en-
ergy sources are standardised in the diagram in such a way that those energy
sources have a GWP of more than 100% whose expansion would lead to a dete-

 66
SUBSYSTEMS AND GROUPS IN LIFE CYCLE ASSESSMENTS WITH VAGUE INPUT DATA

rioration in the GWP of the overall electricity mix and at the same time their re-
duction would lead to an improvement in the GWP of the overall electricity mix.
Similarly, the expansion of those energy sources whose GWP is below 100% in
the figure would lead to an improvement in the GWP of the electricity mix - at
the same time, this also means that a reduction in these energy sources can lead
to a deterioration in the GWP of the overall electricity mix. The weighting factors
required in such cases therefore represent the averaged factor values of the coun-
try. This prevents the possibility of a targeted improvement of a product system
through the concrete selection of a favourable individual unit process or at least
through the explicit exclusion of a particularly unfavourable individual unit pro-
cesses. Within the framework of the interval-arithmetic approach, averaging is
dispensed with completely. Instead, an aggregated unit process is ultimately cal-
culated that takes into account the respective extreme values of all available op-
tions as upper and lower limits of the data intervals and thus continues to fully
consider both "the best" and "the worst" processes for power generation.
In this context, the interval-based method favours two things: On the one hand, if
the information base is insufficient - and the resulting large interval width is usu-
ally too wide - the transparent presentation of the results makes it immediately
obvious that the significance is too low and more precise information is required.
On the other hand, the interval representation in product development enables the
early identification of improvement potentials, so that "bad" representatives can
be recognized early and excluded as processes with high environmental impact.

4. IMPLEMENTATION IN MULTIVALCA
 The implementation of the two described concepts can be done in two fun-
damentally different ways. In case of an explicit implementation, unit processes
representing the results of the life cycle inventory of subsystems or groups of unit
processes would be added to the database in form of real unit processes. An obvi-
ous advantage of this approach is that each corresponding calculation has to be
performed only once and the obtained results are available as output data for fu-
ture calculations of larger product systems containing the corresponding elements.
On the other hand, the disadvantage is that any subsequent modification of indi-
vidual unit processes within the subsystems or unit processes groups will invali-
date all data sets based on an earlier version of the corresponding unit process. In
the case of an implicit implementation, the subsystems and unit process groups
are declared, but the associated Life Cycle Inventory calculation is always only

 67 Otto-Graf-Journal Vol. 19, 2020
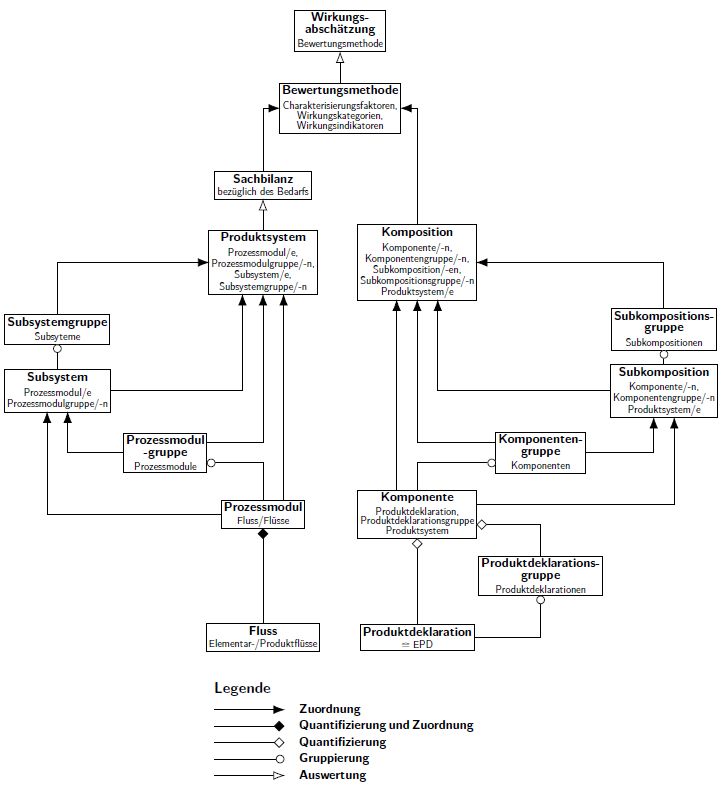
H. HEIN, J. SCHWARTE

performed in the course of the calculation of a modified product system in which
they are included as components.

Fig. 8: Systematic structure of the MultiVaLCA program: on the left-hand side unit processes
and systems are used to enter life cycle inventories, on the right-hand side results of life cycle
 assessments (e.g. EPDs) for individual components (in the picture: compositions) [8]

The two concepts discussed in section 2 Subsystem and section 3 Groups have
been implemented in MultiVaLCA in the implicit way and first tests have been
carried out regarding the performance of this approach. From the point of view of
the user this means that at those places in the program dialog where a previously

 68
SUBSYSTEMS AND GROUPS IN LIFE CYCLE ASSESSMENTS WITH VAGUE INPUT DATA

recorded single unit processes can be entered, the entry of a subsystem or a unit
processes group is also possible. This is made possible by the special class hier-
archy shown in Fig. 8.

5. SUMMARY AND OUTLOOK
 The concepts of the subsystems and groups within the product system dis-
cussed above were consistently implemented within the interval arithmetic calcu-
lation method within the software MultiVaLCA. An unintentional widening of the
result intervals could be avoided and/or reduced in first experimental calculations.
In the course of the investigation of larger and more complex product systems the
procedure is to be further optimized. Overall, it can be assumed that the proposed
procedure will be ready for practical application in the foreseeable future. In ad-
dition to the realization of the numerical aspects presented in this thesis, an opti-
mization of the user interface is also aimed at in the course of the corresponding
further development.

REFERENCES
[1] Github: MultiVaLCA, www.github.com/JoachimSchwarte/MultiVaLCA,
 2019
[2] SCHWARTE, J.: Eine einfache Java-Klassenbibliothek für Öko-Sachbilanz-
 Studien in Forschung und Lehre in: Werkstoffe, Denkmalschutz, und…,
 Institut für Werkstoffe im Bauwesen der Universität Stuttgart, Stuttgart,
 2017
[3] HEIN, H.L., SCHWARTE, J.: Feasibility of Forecasting Ecological Perfor-
 mances of Products in early Development Phases, IOP Conference Series:
 Materials Science and Engineering, Band 615 (2019), 012108
[4] HEIN, H., SCHWARTE, J.: Products in early development phases: ecological
 classification and evaluation using an interval arithmetic based calculation
 approach, World Academy of Science, Engineering and Technology, Inter-
 national Journal of Energy and Environmental Engineering, Band 13 (2019),
 Nr. 5, S. 368-374
[5] HEIN, H., SCHWARTE, J.: Innovative insulation materials – specific issues
 performing LCA in early development phases, Advanced Materials Proceed-
 ings, Band 3 (2018), Nr. 9, S. 531-535

 69 Otto-Graf-Journal Vol. 19, 2020
H. HEIN, J. SCHWARTE

[6] SCHWARTE, J., HEIN, H.L.: Treatment of Uncertainties in Green Engineering,
 IOP Conference Series: Materials Science and Engineering, Band 615
 (2019), 012109
[7] SPANIOL, O.: Die Distributivität in der Intervallarithmetik in: Computing 5
 (1970), p. 6-16
[8] DIPPON, J.: Weiterentwicklung des Java-Basierten Ökobilanz-Programms
 MultiVaLCA. Masterarbeit (unveröffentlicht), Stuttgart, 2020

 70
You can also read