Q2-2021 RESULTS CONFERENCE CALL - Seeking Alpha
←
→
Page content transcription
If your browser does not render page correctly, please read the page content below
Q2-2021 RESULTS   August 5th, 2021 | 9AM Eastern
CONFERENCE CALL
Q2-2021 | Cautionary Statement
This presentation may contain forward-
looking statements with respect to Killam
Apartment REIT and its operations,
strategy, financial performance and
condition. These statements generally can
be identified by use of forward-looking
words such as “may”, ”will”, “expect”,
“estimate”,     “anticipate”,    “intends”,
“believe” or “continue” or the negative
thereof or similar variations. The actual
results and performance of Killam
Apartment REIT discussed herein could
differ materially from those expressed or
implied by such statements. Such
statements are qualified in their entirety
by the inherent risks and uncertainties
surrounding        future     expectations.
Important factors that could cause actual
results to differ materially from
expectations include, among other things,
risks and uncertainties relating to the
COVID-19 pandemic, general economic
and market factors, competition, changes
in government regulation and the factors
described under “Risk Factors” in Killam’s
annual information form, Killam's
Management's Discussion and Analysis
for the three and six months ended June
30, 2021, and other securities regulatory
filings. The cautionary statements qualify
all       forward-looking       statements
attributable to Killam Apartment REIT and
persons acting on its behalf. Unless
otherwise stated, all forward-looking
statements speak only as of the date to
which this presentation refers, and the
parties have no obligation to update such
statements.
                                              2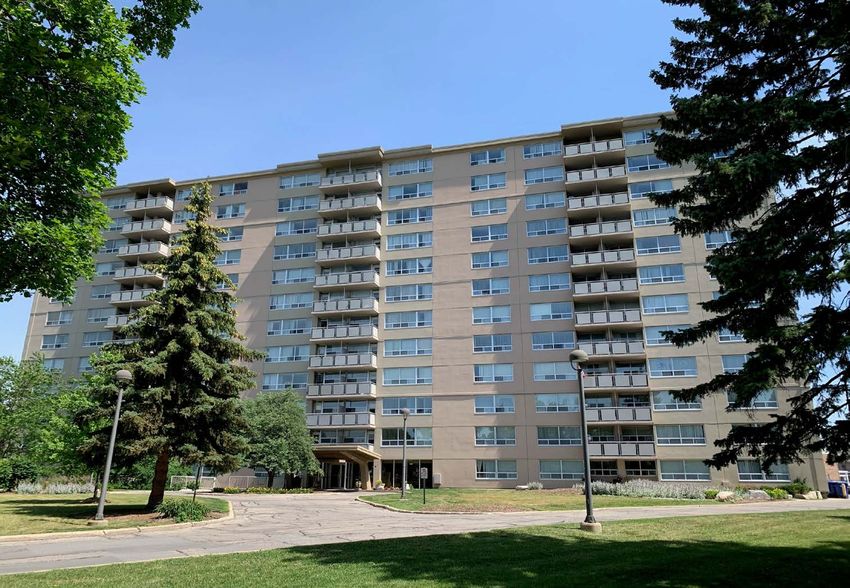
Q2-2021 | Strategic Targets

       Grow Same Property NOI                            Develop High-Quality Properties
       • 2021 Target: >2%, subject to COVID-19 related   • 2021 Target: Complete 166 units (two
         restrictions being lifted by Q3-2021.             buildings) and break ground on two additional
       • **Revised in Q2-2021: >3.5%                       developments (>150 units).
       • YTD 2021 Performance: 3.6%                      • YTD 2021 Performance: Killam is on track to
                                                           meet this target.

       Expand the Portfolio Through Acquisitions
       • 2021 Target: Acquire a minimum of $100M.
       • YTD 2021 Performance: Acquired $271M in         Strengthen the Balance Sheet
         acquisitions in YTD-2021.                       • 2021 Target: Maintain debt as a % of assets
                                                            ratio below 47%.
                                                         • YTD 2021 Performance: 44.5% as of June 30,
                                                            2021.

       Diversify Geographically
       • 2021 Target: Earn >32% of 2021 NOI outside
                                                         Improve Sustainability
          Atlantic Canada.
                                                         • 2021 Target: Minimum $5M investment in
       • YTD 2021 Performance: Killam is on track to
                                                           energy initiatives to reduce Killam’s carbon
          meet this target.
                                                           footprint.
                                                         • YTD 2021 Performance: Year-to-date Killam
                                                           has invested $0.7 million on energy projects
                                                           and has an additional $3.4 million in approved
                                                           projects that are expected to be completed
                                                           early in the second half of the year.            3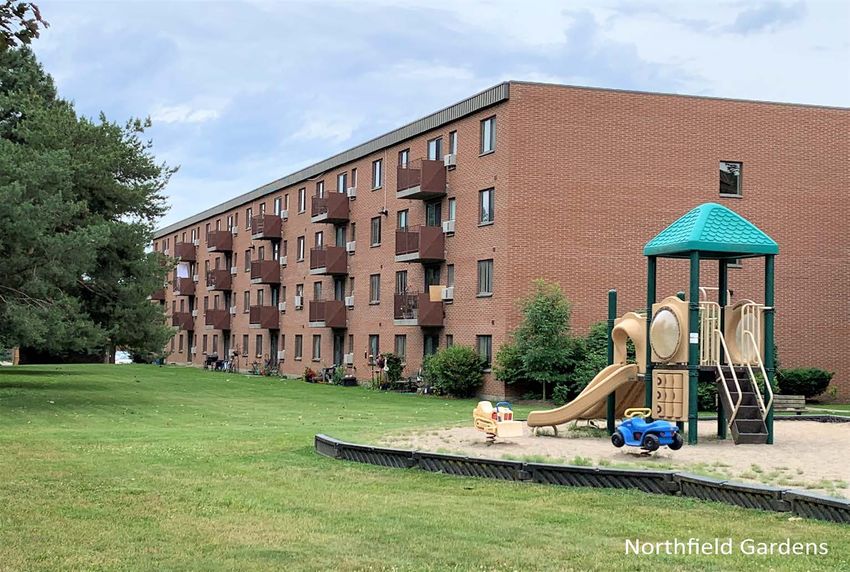
Q2-2021 | Financial Highlights

      $136.7M                                                             44.5%                                                         $206M
        Net income                                                 Debt to Total Assets                                              Q2 Acquisitions
$136.7 million, an increase of            $0.27                  Flexible capital structure with            4.5%                   Acquired $271 million in
$115.2 million from Q2-2020        FFO per Unit Growth           a conservative balance sheet.       Same Property NOI            acquisitions year-to-date;
as fair value gains realized on      $0.27 per unit, a 3.8%                                               Growth                 88% outside Atlantic Canada.
    investment properties.        increase from $0.26 per unit                                     4.5% growth in Q2-2021 with
                                          in Q2-2020.                                                a 20 bps improvement in
                                                                                                        operating margin.                                       4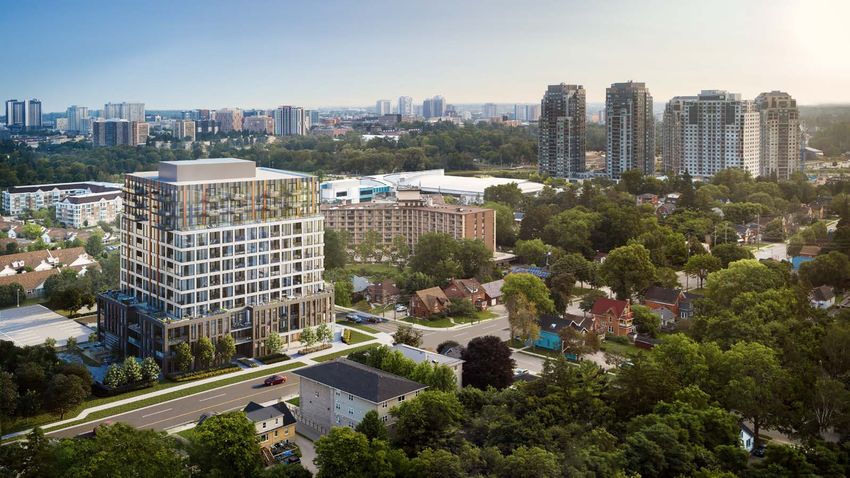
Q2-2021 | Financial Highlights

Strong FFO and Same Property NOI Growth due to rental rate growth, improved occupancy and modest expense growth.

          Q2 FFO & AFFO Per Unit                               Same Property Portfolio Performance
                                                             For the three months ended June 30, 2021
                        Q2-2021    Q2-2020
          $0.27

                        $0.26

                                     $0.23

                                                 $0.22

                                                                4.0%

                                                                               3.3%

                                                                                             4.5%
                  FFO                     AFFO                Revenue        Expense         NOI

         YTD FFO & AFFO Per Unit                                    Same Property Portfolio Performance
                                                                   For the six months ended June 30, 2021
                    Q2-2021       Q2-2020
         $0.50

                    $0.48

                                  $0.42

                                             $0.40

                                                                 3.1%

                                                                               2.3%

                                                                                            3.6%
              FFO                    AFFO
                                                               Revenue       Expense        NOI

                                                                                                              5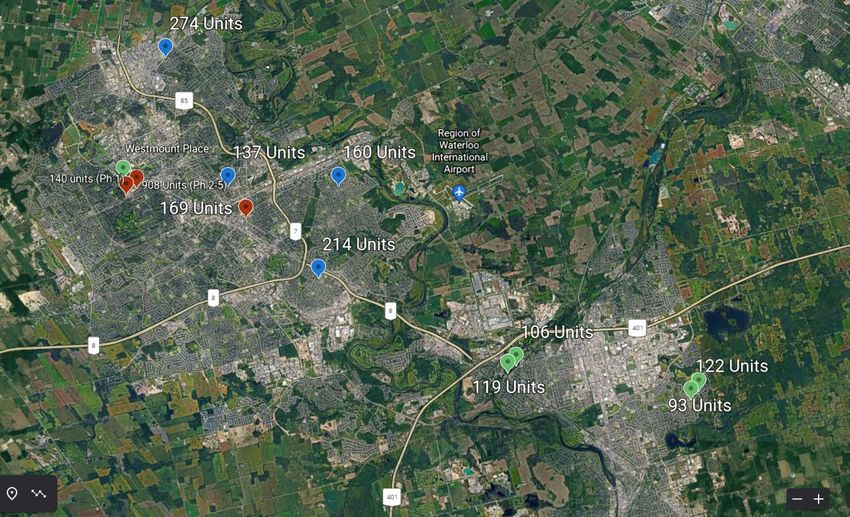
Q2-2021 | Financial Highlights

     Apt Same Property Avg                      Apt Same Property                                          Apt Same Property
      Rental Rate Increase                        Occupancy(1)                                            Incentive Offerings(2)

                                            96.1%

                                                       96.9%

                                                               97.0%

                                                                          96.7%

                                                                                     96.9%
  1.6%

          2.4%

                  3.2%

                          2.9%

                                   3.1%

                                                                                                   0.8%

                                                                                                             0.4%

                                                                                                                      0.4%

                                                                                                                               0.4%

                                                                                                                                        0.7%
 Q2-2017 Q2-2018 Q2-2019 Q2-2020 Q2-2021   Q2-2017 Q2-2018 Q2-2019 Q2-2020 Q2-2021                Q2-2017 Q2-2018 Q2-2019 Q2-2020 Q2-2021

                                            (1) Measured as dollar vacancy for the quarter.       (2) Measured as a percentage of residential rent.

     MHC Same Property                               Commercial Same                          Net Consolidated Revenue Growth of
     Net Revenue Growth                                Property Net                           4.0% in Q2-2021
                                                                                                     Apt rental rate growth of 3.1%
                                                     Revenue Growth                           •
                                                                                              •      Apt occupancy increase of 20 bps
                                                                                              •      Apt incentive offerings in only select
                  2.0%

                                                     4.4%

                                                                                   7.6%
                                                                                                     markets
                          (3.1%)
          4.3%

                                   8.5%
  3.5%

                                                                                              •      MHC seasonal revenue growth of 20.3%
                                                    Q2-2019     Q2-2020           Q2-2021
                                                                                              •      Commercial occupancy increases and
 Q2-2017 Q2-2018 Q2-2019 Q2-2020
                         Q2-2020 Q2-2021                                                             reduction of bad debt and tenant
                                                                 (3.1%)

                                                                                                     abatements.

                                                                                                                                                      6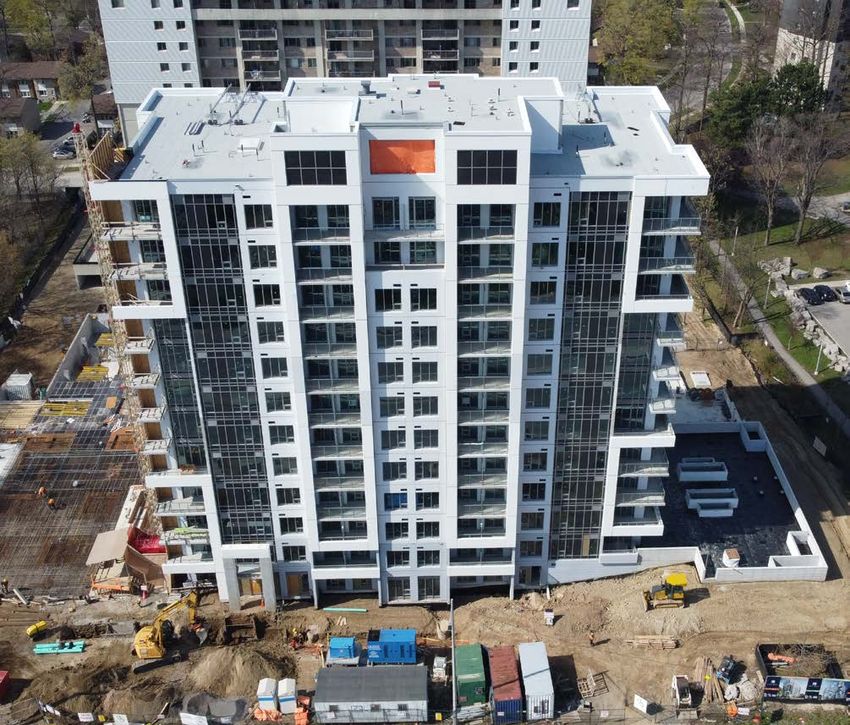
Q2-2021 | Revenue - Renovations

Revenue growth through unit repositions to meet market demand to optimize NOI growth and investment returns.

                                                          YTD-2021 Actuals
                                                          • 287 unit repositions
                                                          • 13% ROI
                                                          • $25k avg investment

                             2021 Program
                             • 550 unit repositions
                             • ~$14-16M investment
                             • ~$1.8-2.0M annualized revenue growth

                                                          Total Opportunity                                                     Based on a 4.75% cap
                                                                                                                                 rate this investment
                                                          • 5,500 unit repositions                                             would increase the NAV
                                                          • ~$140-165M investment                                                    by ~$260M.
                                                          • ~$18-21M annualized revenue growth

                Note: Unit renovations have continued in compliance with social distancing measures throughout the pandemic.                            7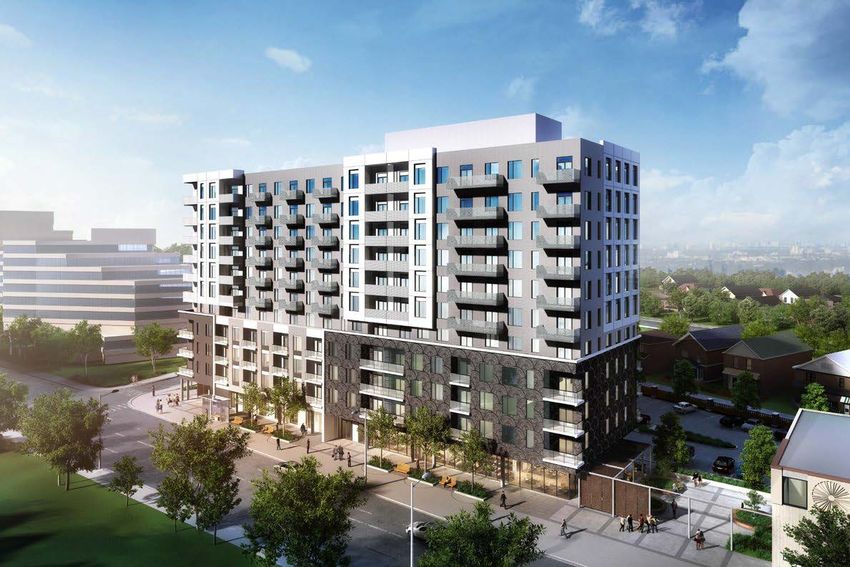
Q2-2021 | Financial Highlights

                                                                                Same Property Expense Growth
Increased operating expenses and a modest increase in heating
fuel and utility expenses for Q2. This was partially offset by                                    3.1%                 3.3%
property tax expense savings to generate a 3.3% increase in Q2-              2.7%
2021.
                                                                                        0.9%
• General Operating expenses have increased compared to Q2-
  2020 due to higher R&M costs in 2021 with less COVID-19                                                    (0.3%)
  restrictions.

• Utility and fuel expenses were relatively flat with reduced               Q2-2017   Q2-2018    Q2-2019    Q2-2020   Q2-2021
  consumption from energy efficiency projects offset energy
  pricing increases.

                                                 Same Property Expense by Category ($M)

                                                 2021                2020       % Increase/(Decrease)
                                $25      9.1%                                                            20.0%
                                                                             6.8%                        15.0%
                                $20                                                             1.2%     10.0%
                                                     0.2%   (1.3)%
                                $15                                                   (3.2)%             5.0%
                                                                                                         0.0%
                                $10                                                                      (5.0)%
                                 $5                                                                      (10.0)%
                                                                                                         (15.0)%
                                 $0                                                                      (20.0)%

                                                Q2                                    YTD                                       8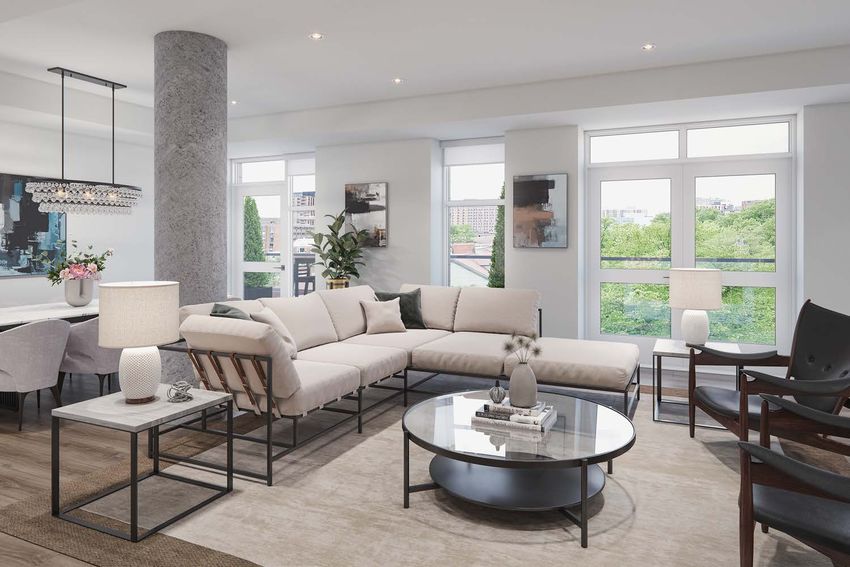
Q2-2021 | Financial Highlights

                                                Apartment Mortgage Maturities by Year
                                                        As at June 30, 2021

                                  Mortgage Maturities                             Weighted Average Interest Rate (Apartments)
                                                                                                                                           Current Weighted
                                  Five-year CMHC rate                             Ten-year CMHC rate                                    Average Interest Rate
                           $600
                           $525                         3.19%
                                                                                                                       4%                       2.61 %
Mortgage Maturities ($M)

                           $450              2.68%                                               2.85%      2.75%

                                                                                                                        Interest Rate
                                                                2.56%                                                  3%
                           $375   2.44%                                               2.31%
                                                                         1.91%                                                             Weighted Average
                           $300                                                                                                             Term to Maturity
                                                                                                                       2%
                           $225                                                                                                                   4.3
                           $150                                                                                        1%
                                                                                                                                                 years
                            $75
                             $0                                                                                        0%               Apartment Mortgages
                                  2021       2022       2023     2024      2025        2026       2027    Thereafter                          CMHC Insured
                                                                                                                                                  78 %

                                                        Current rate for 5-year and 10-year CMHC
                                                        insured debt is approximately 1.8% and 2.2%.
                                                                                                                                                                9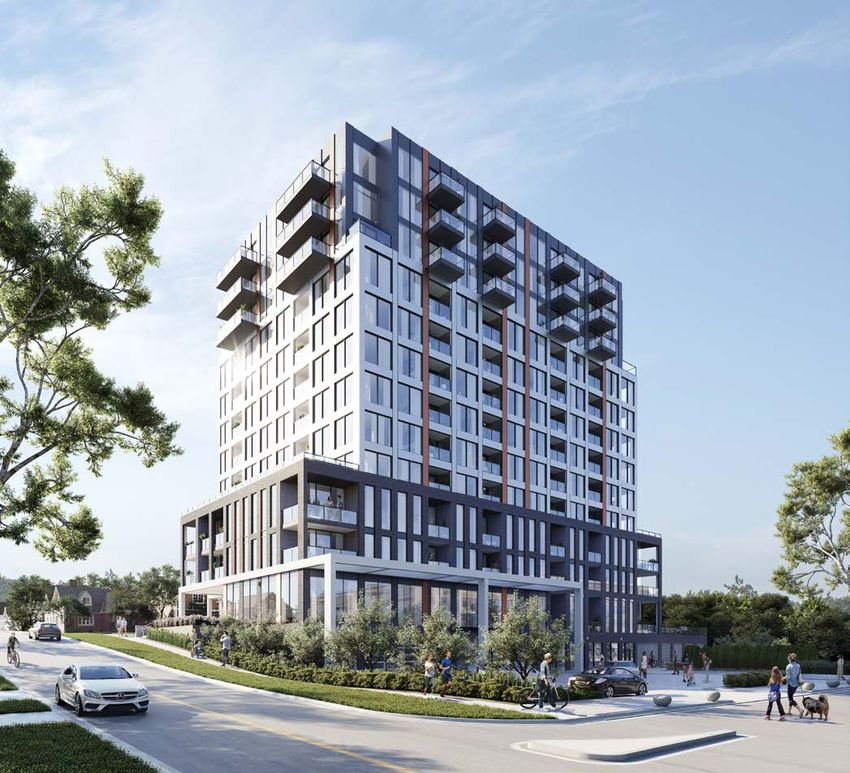
Q2-2021 | Financial Highlights

     Increasing value of investment properties with conservative debt metrics.

             Debt as a % of Assets                            Interest Coverage Ratio                      Debt to Normalized
%                                                                                                                EBITDA

0%

%

0%

                                                                                                   10.51

                                                                                                           10.50

                                                                                                                   10.62

                                                                                                                           10.15

                                                                                                                                   10.78

                                                                                                                                           11.11
     53.5%

               48.7%

                       49.8%

                               43.4%

                                       44.6%

                                               44.5%

                                                       2.70

                                                                3.13

                                                                       3.22

                                                                              3.20

                                                                                     3.36

                                                                                            3.44
%

                                                                                                                                                   10
Q2-2021 | Focusing on Long-Term Growth Drivers
Best-in-class multi-family residential owner, operator and developer
NOI Contribution by Market (%)
AB | 7% NL | 4%
Calgary | Edmonton
St. John’s
BC | 3% PEI | 6%
Victoria Charlottetown
ON | 22% NS | 38%
Ottawa | London
NB | 20% Halifax
Toronto | KWC
Moncton | Fredericton
Saint John
Killam’s strategy to increase FFO, NAV and maximize value is focused on three priorities:
Expand the portfolio and Develop high-
Increase earnings
diversify geographically quality properties
from existing
through accretive acquisitions, in Killam’s core
portfolio.
targeting newer properties. markets.
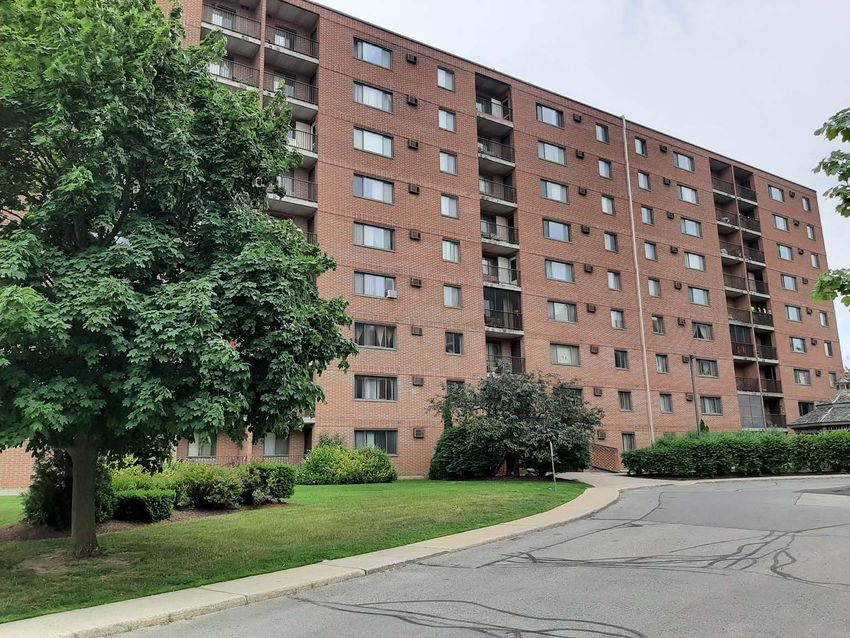
11Q2-2021 | Portfolio Acquisition in Kitchener-Waterloo
Focused on diversifying the portfolio geographically, a 785-unit portfolio in KWC was purchased on June 30, 2021.
Acquisition Details:
$190.5 million The Estates | Kitchener
3.5% capitalization rate 137 units | Avg 865 SF | 99% occupied
$123.9 million mortgages: Avg Mth Rent $1,319 per unit ($1.53/SF)
• $65.5 million; 4-yr; 2.18%
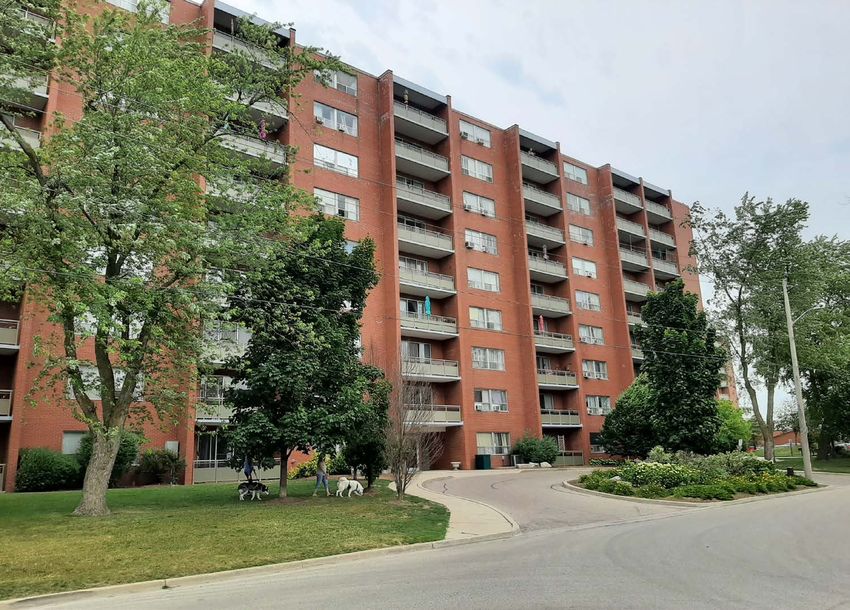
12Q2-2021 | Portfolio Acquisition in Kitchener-Waterloo
Heritage Place | Kitchener
160 units | Avg 1,084 SF | 100% occupied
Avg Mth Rent $1,197 per unit ($1.10/SF)
13Q2-2021 | Portfolio Acquisition in Kitchener-Waterloo
Northfield Gardens| Waterloo
274 units | Avg 800 SF | 100% occupied
Avg Mth Rent $1,195 per unit ($1.49/SF)
14Q2-2021 | Portfolio Acquisition in Kitchener-Waterloo
Ridgeway & Somerset | Kitchener
214 units | Avg 740 SF | 99% occupied
Avg Mth Rent $1,169 per unit ($1.58/SF)
15Q2-2021 | Portfolio Acquisition in Kitchener-Waterloo
KWC region is a strong economic hub that will continue to be a main driver of growth for Killam.
2020 Assets
Newly Acquired Assets (Jun 2021)
Future Development Growth Expected
Future Growth
2020 Today ~2,500 units + 297,000 SF Commercial with the
following developments:
440 units + 297,000 SF Commercial 1,225 units + 297,000 SF Commercial
169 Units (Civic 66) - 2022
Annual NOI ~$11 million Annual NOI ~$17 million 139 Units (Westmount Ph1) - 2024
Market Value ~$250 million Market Value~$455 million ~950 Unit (Westmount Ph2-5) to be delivered in
phases from 2025 to 2028. 16Q2-2021 | Acquisition in Charlottetown
Charlottetown Mall
$10.1 million (Additional 25% acquired)
Ownership: 75% Killam/25% PEI operator*
Closed June 1, 2021
352,000 SF enclosed mall; 32 acres
60,000 SF vacant space
Opportunities with local and diverse leasing,
development and improved operating
efficiencies.
38 Pasadena | St. John’s
*Killam’s former joint venture partner, RioCan REIT,
40 units
sold their 50% interest to Killam and a local PEI real
estate operator. Avg Mth Rent $860 per unit
100% occupied
$4.2 million
Closed: June 8, 2021
17Q2-2021 | Acquisitions
Annual Acquisitions ($ millions) $315
Average $122M $271
$200 $200 $211
$160 $191
$167
$125 $115 $106 $121
$103
$85 $72
$16 $45 $36 $3 $54
2002 2003 2004 2005 2006 2007 2008 2009 2010 2011 2012 2013 2014 2015 2016 2017 2018 2019 2020 YTD
2021
NOI Generated Outside Atlantic Canada
36%
32% 33%
30%
27%
21% 23%
20%
15%
12% 12%
2012 2013 2014 2015 2016 2017 2018 2019 2020 2021 2025
Forecast Target
18Q2-2021 | Strong Leasing of Developments
Shorefront Leasing Activity (as of July 28, 2021) 99%
Shorefront | 78 units | Charlottetown, PE
100%
75%
50%
25%
0%
Month Month Month Month Month Month Month Month Month Month Month
1 2 3 4 5 6 7 8 9 10 11
Month from Opening Date (Oct 2020)
Nolan Hill | 233 units | Calgary, AB Nolan Hill Leasing Activity (as of July 28, 2021)
100%
100%
75%
50%
25%
0% 2021 has shown
Month Month Month Month Month Month Month Month strong leasing
1 2 3 4 5 6 7 8 activity at the three
Month from Opening Date (Jan 2021)
new development
10 Harley | 38 units | Charlottetown, PE properties, with 347
10 Harley Leasing Activity (as of July 28, 2021) of the 349 units
leased (99%).
125%
100% 97%
75%
50%
25%
0%
Month 1 Month 2 Month 3 Month 4 Month 5 Month 6
Month from Opening Date (March 2021) 19Q2-2021 | Strong Leasing of Developments
Shorefront | 78 units | Charlottetown, PE These newly completed developments contributed $0.3 million to FFO
in Q2-2021 with further FFO growth throughout the remainder of 2021
once fully leased in Q3-2021.
Operating Margin % (Stabilized)
73%
70% 70%
68%
Killam’s Avg 63.5%
Nolan Hill | 233 units | Calgary, AB
Harley Nolan Hill Shorefront Average
Annual NOI Contribution in $ millions (Stabilized)
$4.2
10 Harley | 38 units | Charlottetown, PE
$2.5
$1.2
$0.5
Harley Nolan Hill Shorefront Total
20Q2-2021 | Development Progress
With Shorefront, Harley Developments - Scheduled
and Nolan Hill now open, Completion
Killam currently has five
developments underway, 2021-2022
which will add an $millions
additional 497 units to $200
128 units | Mississauga, ON Killam’s portfolio by the Total $180M | 369 units
end of 2022. This current
pipeline has a construction $160 Latitude | 104 units (1)
$44
cost of ~$237 million and
will contribute to FFO per
unit growth starting in $22 Governor | 12 units
$120
2022-2024.
84 units(1) | Ottawa, ON
$80 $70 Civic 66 | 169 units
$40 The Kay | 128
units
$57
$44 Luma | 84 units(1)
169 units | Kitchener, ON $-
2021 2022
12 units | Halifax, NS 104 units(1) |Ottawa, ON (1) Represents Killam’s 50% ownership 21Q2-2021 | Development Activity - Mississauga
THE KAY, 128-unit development broke ground in Q3-2019 and is expected to be completed in Q4-2021.
Key Statistics
Progress shots as of June 2021
Number of units 128
Start date Q3-2019
Est. completion date Q4-2021
Project budget ($M) $57.0
Cost per unit $445,000
Expected yield 4.5%-4.75%
Expected cap-rate 3.5%
Avg unit size 748 SF
Avg rent $2.98 per SF
The Kay
Silver Spear
Dixie Road
GREEN FEATURES:
Sub-metered water,
geothermal heating and
cooling 22Q2-2021 | Development Activity - Ottawa
THE LATITUDE, 209-unit development
Progress shots as of June 2021
Key Statistics
Number of units 209
Start date Q2-2019
Estimated completion date Q1-2022
Project budget ($M)(1) $43.5
Cost per unit $416,000
Expected yield 4.4%-4.6%
Expected value cap-rate 3.5%
Average unit size 803 SF
Average rent $2,085
GREEN FEATURES: Sub-
($2.60/SF)
metered water, geothermal
heating and cooling
(1) Killam’s 50% interest. 23Q2-2021 | Development Activity - Ottawa
LUMA – 168-unit development in Ottawa 50/50 with RioCan REIT.
Progress shots as of July 2021
Key Statistics
Number of units 168
Estimated completion date Q2-2022
Project budget ($M)(1) 44.3
Cost per unit $527,000
Expected yield 4.0%-4.25%
Avg rent $2.90 per SF
Avg unit size 748 SF
(1) Killam’s 50% interest. 24Q2-2021 | Development Activity - Kitchener
CIVIC 66 – 169-unit development in Kitchener that broke ground in Q3-2020 and is expected to be completed by
Q4-2022.
Key Statistics
NumberLatitude
of units (Phase II) 169
Start date Q3-2020
Est. completion date Q4-2022
Project budget ($M) $69.7
Cost per unit $412,000
Expected yield 4.75%-5.0%
Avg unit size 780 SF
Avg rent $2.77 per SF
Progress shot as of July 2021
* Killam’s 50% interest.
GREEN FEATURES: Sub-metered water,
geothermal heating and cooling
25Q2-2021 | Development Activity - Halifax
THE GOVERNOR - 12 luxury units and 3,500 square foot ground floor commercial development in downtown Halifax.
Key Statistics
Number of units 12
Start date Latitude (Phase II) Q1-2021
Est. completion date Q3-2022
Project budget ($M) $22
Expected yield 4.25%-4.75%
Avg unit size 2,350 SF
+(330 SF terrace)
Avg rent $3.30 per SF
Progress shot as of July 2021
26Q2-2021 | Development Activity - Halifax
THE GOVERNOR, 12-unit development broke ground in early 2021 and is expected to be completed in Q3-2022.
Latitude (Phase II)
* Killam’s 50% interest.
27Q2-2021 | Development Activity - Halifax
THE GOVERNOR, interior suite rendering, average suite size 2,350 SF
28Q2-2021 | Development Activity - Halifax
THE GOVERNOR, interior suite rendering, average suite size 2,350 SF
29Q2-2021 | Future Development Activity – Westmount Phase 1
WESTMOUNT PHASE 1 – Expect to break down on the 139-unit development in Waterloo in Q4-2021.
Key Statistics
Number of units 139
Est. start date Q4-2021
Est. completion date Q1-2024
30Q2-2021 | Development Pipeline - ~$1.3 billion
Future Development Opportunities
Killam’s Potential # Est Year of
Property Location Interest of Units(1) Status Completion
Developments expected to start in 2021
Nolan Hill (Phase 2)(2) Calgary, AB 10% 234 Detailed design, preparing submission 2024
Westmount Place (Phase 1) Waterloo, ON 100% 139 Conditional approval 2024
Developments expected to start in 2022-2026
Carlton East & West Halifax, NS 100% 140 Submitted for approval 2024
Stratford Land Charlottetown, PE 100% 175 In design 2024
Sherwood Crossing Charlottetown, PE 100% 325 In design 2025
Medical Arts Halifax, NS 100% 200 Concept design 2025
Hollis Street Halifax, NS 100% 100 In design 2025
Gloucester City Centre (Phase 3) Ottawa, ON 50% 200 In design 2025
Westmount Place (Phase 2) Waterloo, ON 100% 150 In design 2028
Additional future development projects
Nolan Hill (Phase 3-4) (2) Calgary, AB 10% 468 Future development TBD
Christie Point Victoria, BC 100% 312 Development agreement in place TBD
Gloucester City Centre (Phase 4-5) Ottawa, ON 50% 400 Future development TBD
Westmount Place (Phase 3-5) Waterloo, ON 100% 800 Future development TBD
Kanata Lakes Ottawa, 50% yields of 4.5%
ON Canada. Killam targets
Over half of Killam's development pipeline is outside Atlantic 80to 5.0%
Future development
on development, TBD cap-
50–150 bps higher than the expected
rate value
St. George on completion. Building out the $1.0Moncton,
Street billion pipeline 100% would create 60
NB at a 100 bps spread Future$250
approximately development
million in NAV growth for unitholders. TBD
15 Haviland Street Charlottetown, PE 100% 60-90 Future development TBD
Topsail Road St. John's, NL 100% 225 Future development TBD
Block 4 St. John's, NL 100% 80 Future development TBD
Total Development Opportunities 4,163
(1) Represents total number of units in the potential development.
(2) Killam has a 10% interest in the remaining three phases of Nolan Hill development in Calgary, AB, which Killam expects to purchase upon completion of each phase.
31Non-IFRS Measures
Non-IFRS Measures
Management believes these non-IFRS financial measures are relevant measures of the ability of the REIT to earn revenue and to evaluate Killam's financial
performance. The non-IFRS measures should not be construed as alternatives to net income or cash flow from operating activities determined in accordance
with IFRS, as indicators of Killam's performance, or sustainability of Killam's distributions. These measures do not have standardized meanings under IFRS and
therefore may not be comparable to similarly titled measures presented by other publicly traded organizations.
• Funds from operations ("FFO"), and applicable per unit amounts, are calculated by Killam as net income adjusted for depreciation on an owner-occupied
building, fair value gains (losses), interest expense related to exchangeable units, gains (losses) on disposition, deferred tax expense (recovery), unrealized
gains (losses) on derivative liability, internal commercial leasing costs, interest expense related to lease liabilities, insurance proceeds, and non-controlling
interest. FFO are calculated in accordance with the REALPAC definition, except for the adjustment of insurance proceeds as REALPAC does not address this
adjustment.
• Adjusted funds from operations ("AFFO"), and applicable per unit amounts and payout ratios, are calculated by Killam as FFO less an allowance for
maintenance capital expenditures ("capex") (a three-year rolling historical average capital spend to maintain and sustain Killam's properties), commercial
leasing costs and straight-line commercial rents. AFFO are calculated in accordance with the REALPAC definition. Management considers AFFO an earnings
metric.
• Same property results in relation to Killam are revenues and property operating expenses for stabilized properties that Killam has owned for equivalent
periods in 2021 and 2020. For Killam's commercial portfolio same property NOI is presented on a cash basis, as it excludes straight line rent. Same property
results represent 87.4% of the fair value of Killam's investment property portfolio as at June 30, 2021. Excluded from same property results in 2021 are
acquisitions, dispositions and developments completed in 2020 and 2021, non-stabilized commercial properties linked to development projects, and other
adjustments to normalize for revenue or expense items that relate to prior periods or are not operational.
• Interest coverage is calculated by dividing earnings before interest, tax, depreciation and amortization ("EBITDA") by interest expense, adjusted for interest
expense related to exchangeable units.
• Debt service coverage is calculated by dividing EBITDA by interest expense, less interest expense related to exchangeable units, and principal mortgage
repayments.
• Debt to normalized EBITDA is calculated by dividing interest-bearing debt (net of cash) by EBITDA that has been adjusted for a full year of stabilized earnings
from recently completed acquisitions and developments.
See the Q2-2021 Management’s Discussion and Analysis for further details on these non-IFRS measures and, where applicable, reconciliations to the most
directly comparable IFRS measure.
32Q2-2021 RESULTS CONFERENCE CALL August 5th, 2021 | 9AM Eastern
You can also read