2021 HALF-YEAR RESULTS - AWS
←
→
Page content transcription
If your browser does not render page correctly, please read the page content below
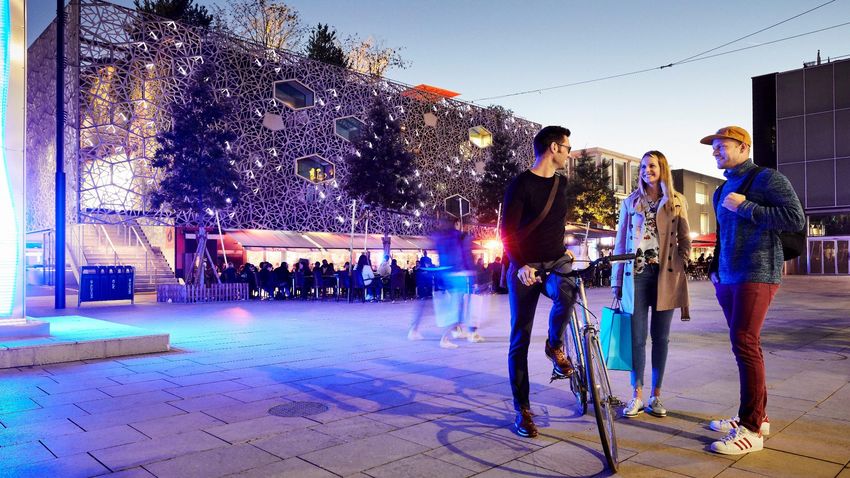
Moxy Hotel
                         Quartier du Flon, Lausanne

2021 HALF-YEAR RESULTS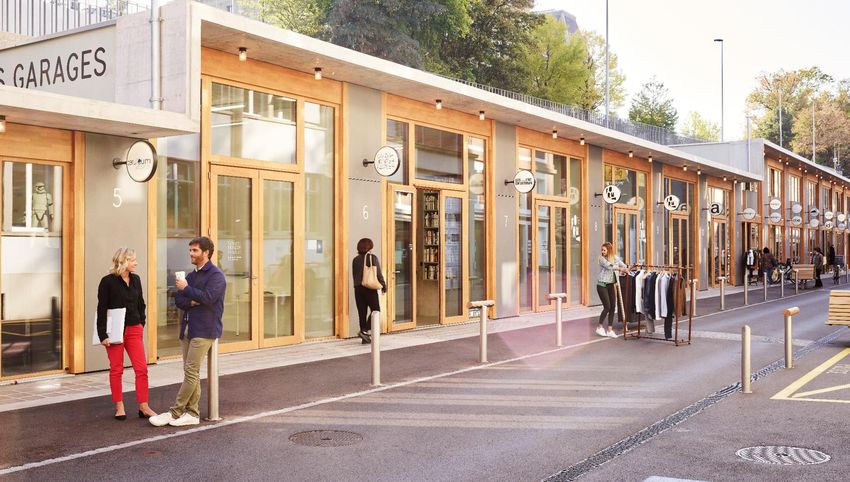
Agenda

              Overview of the first half of 2021

              Financial key figures for the first half of 2021

              Real estate portfolio and pipeline

              Focus and outlook 2021

30.7.2021 | Half-Year Results 2021                               2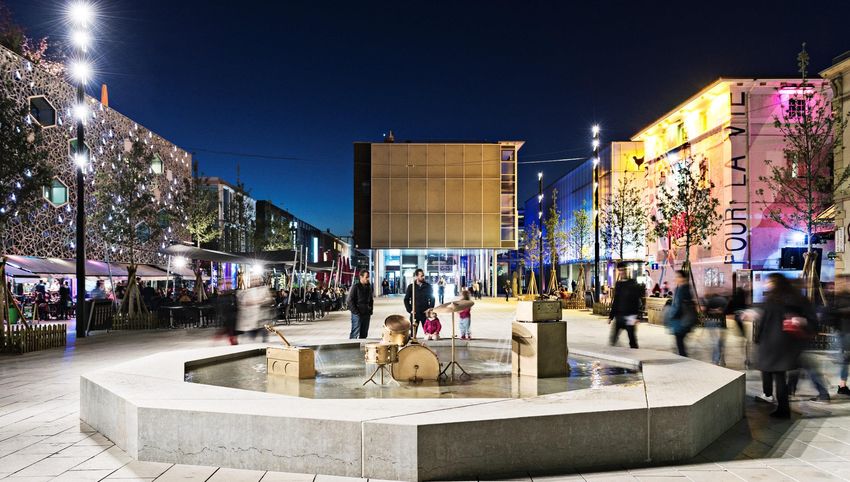
Overview of the first half of 2021

Highlights

                                 Successful sale of the Cosmos project     Reduction of vacancy rate to 5.0% (as
                                 with building permission in Dübendorf.    at 31 December 2020: 5.5%).
                                 Sales successes at the Grace              Gratifying success in renting,
                                 condominium project in Meggen.            particularly at the Mattenhof in Kriens.
                                 Profit on development projects and sale   Viable solutions were found for tenants
                                 of trading properties of CHF 54.4         particularly hard hit by the coronavirus
                                 million (prior year: CHF 2.7 million).    measures.
                                                                           The impact of the Covid effect on the
                                                                           half-year result amounted to CHF 1.0
                                                                           million.

                                 Portfolio growth through ongoing          Reduction of average financing costs
                                 development of current projects.          as at the reporting date to 1.2% (as at
                                                                           31 December 2020: 1.5%).
                                 Risk diversification through mix of use
                                 with a high proportion of residential     Refinancing of a bond for CHF 200
                                 property (34.3%).                         million with a new coupon of 0.25% and
                                                                           a term of around six years.

30.7.2021 | Half-Year Results 2021                                                                                    3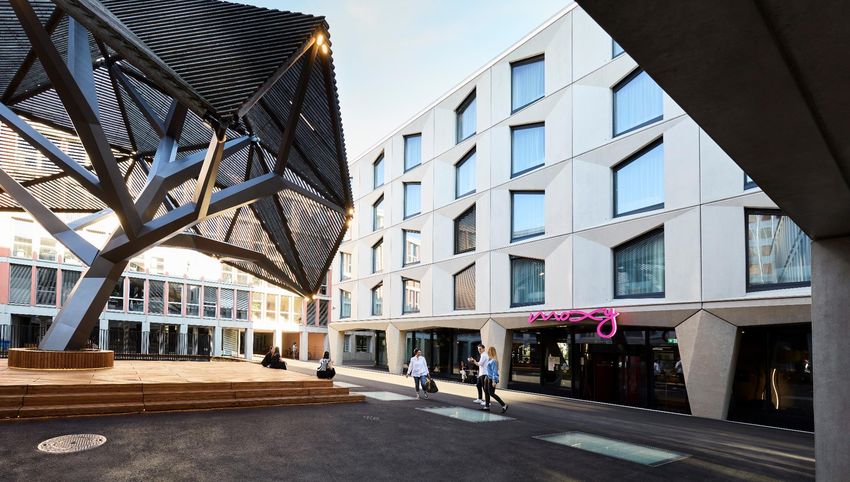
Overview of the first half of 2021

Market environment
 Economic environment                           Market for office/commercial space          Residential rental market

     Switzerland is an attractive place to do     Altered use needs and new sense of          Continued high level of demand from a
     business                                     purpose for office space                    wide range of tenants
     Ongoing low interest rate environment        Structural change in the retail sector      Liquid market
     encourages investment in property
                                                  Temporarily challenging situation for       Residential construction projects still
     No interest rate impact so far despite       city hotels                                 offer huge potential
     inflation expectations
                                                  Swift recovery in food service industry
                                                  after reopening

 Development for Third Parties                  Transaction market                          Condominiums

     Unbroken earnings potential in the           Dynamic market with the same actors         Continued healthy demand
     market                                       driving it
                                                                                              Liquid market
     High level of risk tolerance among real      Ongoing pressure on yields
                                                                                              Rising prices, particularly in the mid-
     estate investors
                                                  Challenging transaction market for          price and low-price brackets
     Interest from an early stage in projects     hotels and office space at B and C
                                                  locations

30.7.2021 | Half-Year Results 2021                                                                                                      4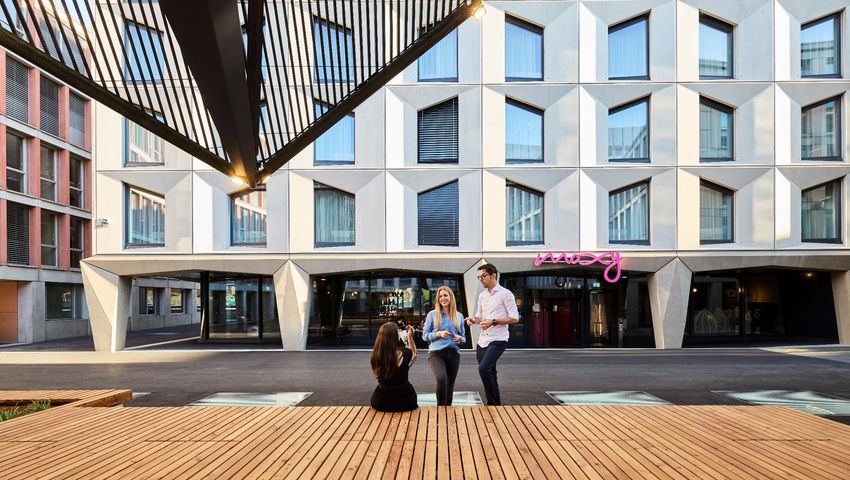
Les Pépinières
 Quartier du Flon, Lausanne

Financial key figures for the first half of 2021
Financial key figures for the first half of 2021

Key income statement figures I

CHF million                                                                                             HY|2018                       HY|2019     HY|2020   HY|2021   Δ y-o-y %

Net rental income                                                                                               45.4                       52.2      52.0      55.9         7.4
Profit on development projects and sale of
trading properties                                                                                                3.9                       2.4       2.7      54.4         nm
Net income from revaluation                                                                                     17.7                       18.8      25.1      19.9       –20.6
Profit on disposal of investment properties                                                                       6.8                       0.0       1.5       0.0     –100.0
Personnel, operating and
administrative expenses1                                                                                      –16.8                       –18.8     –16.3     –16.2        –0.6
EBIT                                                                                                            57.3                       55.4      65.8     115.4        75.2
EBIT excluding revaluation                                                                                      39.6                       36.6      40.8      95.5       134.2
1   Capitalised own-account services are netted against personnel, operating and administrative expenses in the figures presented here.

30.7.2021 | Half-Year Results 2021                                                                                                                                            6
Financial key figures for the first half of 2021

Key income statement figures II

CHF million                                        HY|2018   HY|2019   HY|2020   HY|2021   Δ y-o-y %

Financial result                                     –12.6     –14.1     –14.5     –11.5       –20.7
Tax expense                                           –7.9       1.1      –9.9     –20.5       106.2
Profit attributable to the shareholders of MOH        37.6      43.6      41.7      83.7       100.7
Profit attributable to the shareholders of MOH
excluding revaluation                                 24.4      28.5      21.5      67.3       212.6
Earnings per share (CHF)                              6.04      6.61      6.32     12.69       100.7
Earnings per share (CHF) excl. revaluation            3.92      4.31      3.26     10.19       212.7

30.7.2021 | Half-Year Results 2021                                                                 7
Financial key figures for the first half of 2021
Rental income and vacancy rate
Rental and net rental income
CHF million/%
CHF million/%
64.9
At CHF 55.9 million, net rental income exceeded the
60.9
60.1
previous year’s figure (CHF 52.0 million).
56.4
55.9
54.7
52.2
52.0
The impact of the Covid effect on the half-year result
48.6
45.4
amounted to CHF 1.0 million (prior year: CHF 4.4 million).
The vacancy rate as at 30 June 2021 was below the prior-
5.5 year level at 5.0% (as at 31 December 2020: 5.5%).
5.1 5.0
4.9 Both the gross yield and the net yield were on a par with
4.3
31 December 2020 at 4.5% and 3.5% respectively. Taking
the Covid-19 effect into account, the net yield in the
reporting period was 3.4%.
HY|2017 HY|2018 HY|2019 HY|2020 HY|2021
Rental income
Net rental income
Vacancy rate
30.7.2021 | Half-Year Results 2021 8
Financial key figures for the first half of 2021

Net income from the revaluation of investment properties
Breakdown of income from revaluation
TCHF
                                                                                  Revaluation resulted in net income of CHF 19.9 million

                                                               33,090
                                                                                  (prior year: CHF 25.1 million).
                                                                                  Development properties and investment properties under
                        17,808
     10,723

                                                                                  construction were revalued upwards by CHF 4.1 million

                                                   4,559
                                                                                  overall (prior year: CHF 28.3 million).
                                                                                  The value of investment properties increased by CHF
                                        0

                                                                                  15.8 million (prior year: CHF –3.2 million).

                                                           0
                                            –472
                                 –785

                                                                                  As at 30 June 2021, an average capital-weighted nominal
              –11,919

                                                                        –13,176
                                                                                  discount rate of 3.65% (as at 31 December 2020: 3.73%),
                                                                                  within a range of 2.80% to 5.50% (as at 31 December
                                                                                  2020: 2.85% to 5.65%), was applied to all DCF
 Commercial Residential Development Investment                  Total             valuations.
  properties properties properties properties
                                      under                                       The average capital-weighted capitalisation rate is 3.15%
                                   construction                                   (as at 31 December 2020: 3.23%), within a range from
                                                                                  2.30% to 5.00% (as at 31 December 2020: 2.35% to
¢ ¢ Revaluation                                                                   5.15%).
    Devaluation

30.7.2021 | Half-Year Results 2021                                                                                                            9
Financial key figures for the first half of 2021

Key balance sheet figures

                                                                                                            31.12.2018                 31.12.2019   31.12.2020   30.6.2021   Δ y-o-y %

Equity (CHF million)                                                                                               1,513.5                1,532.3      1,564.8     1,657.6         5.9
Equity ratio                                                                                                         45.0%                 44.2%        43.2%       45.0%
Return on equity1                                                                                                       6.6%                7.1%         6.4%       10.7%
Return on equity excluding revaluation1                                                                                 4.3%                4.2%         4.6%        8.6%
Interest-bearing liabilities (CHF million)                                                                         1,540.7                1,594.4      1,724.9     1,690.7        –2.0
Ø interest rate for the period                                                                                          2.0%                1.8%         1.6%        1.4%
Ø interest rate as at the reporting date                                                                                1.9%                1.7%         1.5%        1.2%
Ø residual maturity as at the reporting date (years)                                                                        6.1               5.3          5.0         5.5         9.0
Net LTV                                                                                                              45.1%                 46.9%        47.3%       45.9%
Interest coverage ratio                                                                                                     3.2               2.9          3.9         7.5        92.3
Net gearing                                                                                                          91.7%                101.1%       101.3%       95.1%
1   Due to annualisation, one-off effects in the profit for the period limit the informative value of the reported return on equity.

30.7.2021 | Half-Year Results 2021                                                                                                                                                  10
Financial key figures for the first half of 2021
Financing
CHF million
Financing structure Residual maturity of financial liabilities
CHF million CHF million
949 1,725
948 1,691
729 1,594
729 1,541
739 1,513
865
812
774
776
742
2017 2018 2019 2020 HY|2021
¢ ¢ Bonds Volume Interest rate Term Maturity
Mortgages CHF 200
Issue of a new bond 0.25% 6 years 19.3.2027
million
30.7.2021 | Half-Year Results 2021 11Moxy Hotel
Quartier du Flon, Lausanne
Real estate portfolio and pipelineReal estate portfolio and pipeline
Performance of the overall portfolio
in CHF million 31.12.2020 30.6.2021 Δ y-o-y % Share in %
The portfolio as a whole recorded net
growth of around CHF 83 million to
Investment properties 2,845 3,018 6.1 88 about CHF 3.4 billion.
Commercial properties1 1,625 1,735 6.8 51 The real estate portfolio comprises 88%
Residential properties 1,220 1,283 5.2 37 investment properties and 12%
development properties.
Development properties 509 418 –17.9 12
Commercial properties (investment)2 149 74 –50.5 2
Residential properties (investment) 110 90 –17.8 3
Commercial properties (trading) 36 36 0.1 1
Residential properties (trading) 214 218 1.9 6
Total value 3,353 3,436 2.5 100
1 Incl. owner-occupied properties, excl. tenant improvements.
2 Excluding right-of-use assets.
30.7.2021 | Half-Year Results 2021 13Real estate portfolio and pipeline
Performance of investment portfolio
Breakdown of investment properties Target rental income for investment Shares of the five biggest
by economic area1 properties by type of use tenants
% % %
5 1
6
4 2
3.8 5.9
8.9 10.6 5.0 3
5
2.8 4
3 6.3 1
34.4 2.6 5
9.3 1 2.4
40.5 4
9.8
3
10.1
37.5 81.3
2 28.8 6
2
1 Zurich 1 Residential 1 Swisscom Group
2 French-speaking Switzerland 2 Office 2 SV Group
3 North-western Switzerland 3 Retail 3 Coop Group
4 Central Switzerland 4 Hotels/catering 4 Senevita AG
5 Eastern Switzerland 5 Industry 5 Rockwell Automation
6 Other use Switzerland
1 Breakdown of fair values/carrying amounts of
properties by economic area (investment properties). 6 Other tenants
30.7.2021 | Half-Year Results 2021 14Real estate portfolio and pipeline
Project pipeline: developments for the company’s own portfolio
Under construction: CHF 110 million (prior year: CHF 90 million) In planning: CHF 370 million (prior year: CHF 490 million)
2021 2022 2023 2024 2021 2022 2023 2024 2025 2026 2027 2028
Lausanne, Rue de Genève 2 – 8
Zurich, Allmendstrasse 90 – 104
(Manegg)
Aarau, Rockwell site
Zurich, Im Tiergarten 7 Lausanne, Avenue d’Ouchy
70/76, Place de la Navigation 2
Lausanne, Rue des
Côtes-de-Montbenon 8 – 14
Geneva, Rue des Etuves 16 – 18 Lausanne, Rue des
Côtes-de-Montbenon 28 – 30
Lausanne, Rue de Lausanne, Avenue d’Ouchy 4 – 6 (Rasude)
Genève 19/21 (Jumeaux)
Lausanne, Place de la Gare 10/Mornex 3
30.7.2021 | Half-Year Results 2021 15Real estate portfolio and pipeline
Overview of Development for Third Parties pipeline
2021 2022 2023 2024 2025 2026
Development for Third Parties: CHF 380 million
(prior year: CHF 560 million)
The Cosmos project in Dübendorf was sold to an investor during the reporting period.
As at 30 June 2021, the Development for Third Parties pipeline comprised six projects, of which one was under
construction and five were in planning.
Of the six projects, three are in the greater Zurich area and three are in the greater Berne area.
30.7.2021 | Half-Year Results 2021 16Real estate portfolio and pipeline
Overview of condominium pipeline
2021 2022 2023 2024 2025 2026 2027
Condominiums under construction: CHF 40 million (prior year: CHF 40 million)
Meggen, Gottliebenrain 5/7
Condominiums in planning: CHF 550 million (prior year: CHF 550 million)
Oberägeri, Lutisbachweg
Horgen, Allmendgütlistrasse 35/39
Köniz/Niederwangen, Ried Ost (Papillon)
Zurich, Katzenbachstrasse 239
Lausanne, Avenue de Beaumont 76
Lausanne, Chemin de Montétan 11;
Avenue de France 66
Maur, Dorfacherstrasse
Arlesheim, Bruggweg 60
Uster, Brauereistrasse
Merlischachen, Chappelmatt-Strasse (Burgmatt)
Langenthal, Kühlhausstrasse 8
30.7.2021 | Half-Year Results 2021 17Real estate portfolio and pipeline
Key sustainability performance figures
108 16
Energy intensity Emissions intensity Standards and
kWh/m2 kg CO2eq/m2 ratings
2019: 152 2019: 25
93 40
Share of renewable Investments in
energy (electricity) renovations
% (reference value kWh) CHF million
Ø 2018 – 2020
BoD-Ranking FuW Proportion of women on
34 Rank
2020: 96 50% BoD
as at 30.3.2021
30.7.2021 | Half-Year Results 2021 18Les Garages
Quartier du Flon, Lausanne
Focus and outlook 2021Focus and outlook 2021
Focus and outlook
Development Realisation
Planning of major condominium projects Realisation of the major Zurich-Manegg project
Speedy progress with approval processes Start of construction on Zurich, Tiergarten, and further
progress on building condominium project in Meggen
Acquisition of new development properties and strengthening
the pipeline Careful management of materials and monitoring of raw
material prices
Real estate portfolio Mobimo as a company
Continual reduction in the vacancy rate Further process optimisation through digitalisation
Covid-19: sticking with solutions based on partnership in the Further development of sustainability strategy and publication
event of further coronavirus-related closures of CO2 reduction roadmap
Purchase of properties with development potential Ongoing optimisation of financing structure and utilisation of
attractive interest rate environment
30.7.2021 | Half-Year Results 2021 20Your contact persons
E-mail: Tel:
ir@mobimo.ch +41 44 397 11 97
Mobimo Management AG
Daniel Ducrey Stefan Hilber
CEO CFO
daniel.ducrey@mobimo.ch stefan.hilber@mobimo.ch @MobimoImmo
@mobimoimmo
30.7.2021 | Half-Year Results 2021 21Financial calendar
11.2.2022 12.4.2022
Publication of 22nd Annual General Meeting
2021 annual results
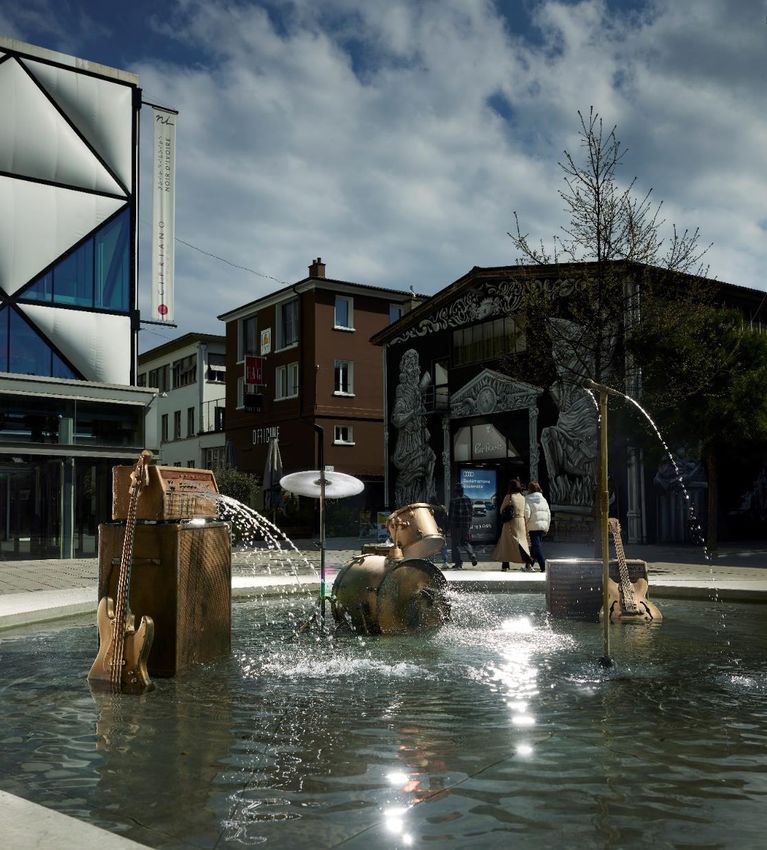
30.7.2021 | Half-Year Results 2021 22Adding symbolic significance to living space
is a key aspect of Mobimo’s commitment to sustainability.
The Mobimo & Art initiative combines art and architecture. An
example is the work “Unplugged” by Vincent Kohler. This bronze
sculpture symbolises the importance that has always been
attached to music in the Quartier du Flon. The musicians appear to
have left the stage, and water flows out of the instruments they
have left behind instead of sound. The work seeks to encapsulate
the identity of this part of town and both stimulate and to entertain
passers-by.Disclaimer The financial data as well as the other information presented herein constitute selected information. The information in this presentation does not constitute an offer or invitation and may not be construed as a recommendation by us to purchase, hold or sell shares of Mobimo Holding AG. This information or any copy thereof may not be sent or taken to or distributed in any jurisdiction in which such transmission or distribution is unlawful. This document may contain certain “forward-looking”. By their nature, forward-looking statements involve risk and uncertainty because they relate to future events and circumstances. Actual outcomes and results may differ materially from any outcomes or results expressed or implied by such forward-looking statements. As a result of rounding, the sums and totals of individual positions may be larger or smaller than the sums and totals arrived at by adding the positions together, or larger or smaller than 100%. The “Definition of Alternative Performance Measures” document, available at www.mobimo.ch > Investors > Investor services > Glossary, includes definitions of key indicators that are not defined under IFRS, EPRA, SIA (Swiss Society of Engineers and Architects) standard D 2013, Corporate Governance Best Practice Recommendations or other standards. 30.7.2021 | Half-Year Results 2021 24
Bronze sculpture “Unplugged”
 Quartier du Flon, Lausanne

Appendix
Appendix

Long-term strategy for growth and stable returns

                                                       Business model
                                     Mobimo pursues its long-term goals based on a clear strategy and
                                                 an established, solid business model.

30.7.2021 | Half-Year Results 2021                                                                      26
Appendix
EPRA key figures
HY|2018 HY|2019 HY|2020 HY|2021 Δ y-o-y %
EPRA profit (CHF million) 24.1 34.4 24.11 30.51 26.3
EPRA earnings per share (CHF) 3.88 5.21 3.651 4.621 26.6
EPRA NAV per share (CHF) 255.09 263.04 276.37 297.07 7.5
EPRA rental growth like for like 0.0% –0.1% 0.2% 0.6%
EPRA net initial yield 4.2% 3.8% 3.8% 3.6%
EPRA “topped-up” net initial yield 4.2% 3.8% 3.8% 3.7%
EPRA vacancy rate 5.1% 4.3% 5.5% 5.0%
1The Earnings per IFRS income statement and the EPRA Earnings for the period under review include rent waivers totalling approximately CHF 1.0 million (HY 2020 CHF 4.4 million) as a result of the coronavirus crisis.
Without these rent waivers and the related tax effect, the EPRA Earnings per Share for the period under review would have been CHF 4.74 (HY 2020 CHF 4.20).
30.7.2021 | Half-Year Results 2021 27Appendix
Long-term maturity profile and diversified tenant structure
Maturity profile of fixed-term rental agreements Cumulative
31.12.2017 31.12.2018 31.12.2019 31.12.2020 30.6.2021
Ø residual maturity of
6.4 years 7.0 years 7.0 years 7.3 years 6.9 years
rental agreements
30.7.2021 | Half-Year Results 2021 28Appendix
Solid foundations for high-quality growth
Equity ratio Interest coverage ratio Net gearing
Equity
% ratio Interest coverage ratio Net
% gearing
% %
< 150%
7.5
45.0
45.0
44.2
43.8
43.2 > 40%
101.1
101.3
95.1
91.7
91.2
3.9
3.8
3.2
2.9
>2
2017 2018 2019 2020 HY|2021 2017 2018 2019 2020 HY|2021 2017 2018 2019 2020 HY|2021
Target
Target of > 40% still met. Target of > 2 clearly exceeded. Significantly below target value of 150%.
Capital base remains solid. High degree of financing leeway.
30.7.2021 | Half-Year Results 2021 29Appendix Profit and earnings per share Profit attributable to the shareholders of MOH Earnings per share including and excluding including and excluding revaluation revaluation CHF million CHF 30.7.2021 | Half-Year Results 2021 30
Appendix

Share figures

                                                                  31.12.2018   31.12.2019   31.12.2020   30.6.2021   Δ y-o-y %

Shares issued (number)                                             6,601,547    6,601,547    6,601,547   6,601,547         0.0
Share capital (CHF million)                                           154.5        154.5          88.5        88.5         0.0
Market capitalisation (CHF million)                                  1,544.8      1,904.5      1,888.0     2,006.9         6.3
NAV per share (CHF)1                                                 228.48       232.26       237.31      251.24          5.9
Stock market price of shares on reporting date
(CHF)                                                                234.00       288.50       286.00      304.00          6.3
1   As at 30 June 2021 the NAV corresponded to the diluted NAV.

30.7.2021 | Half-Year Results 2021                                                                                          31
Appendix
Positive share price performance
Share performance (indexed) compared with SPI and SXI
% The dividend-adjusted share price has increased by some
48% over a five-year period. The Swiss Performance
Index (SPI) and SXI Real Estate Shares Index rose by
77% and 43% respectively over the same period.
Average annual performance (total return) of 6.1% since
180 the initial public offering in June 2005.
160 The share price rose by 6.3% from CHF 286.00 at the
start of the year to CHF 304.00 as at 30 June 2021.
140
As at 30 June 2021 the share price of CHF 304.00 was
120 21.0% above the diluted NAV of CHF 251.24
100
Liquidity remains good:
An average of around 8,928 shares were traded
80
each day (prior year: 14,659 shares).
6.2016 6.2017 6.2018 6.2019 6.2020 6.2021
Turnover of around CHF 322.7 million (prior year:
— Mobimo (dividend-adjusted) — SPI CHF 500.7 million).
— SXI Real Estate Shares
Source: SIX Swiss Exchange.
30.7.2021 | Half-Year Results 2021 32Appendix
Composition of shareholders
in %
Free float as at 30 June 2021: 100% (as per SIX Swiss
Exchange definition).
5 As at 30 June 2021, the following shareholders held 3% or
29.2 1 more of the share capital:
32.0
Credit Suisse Funds AG, 5.50%,
BlackRock, Inc., 3.92%,
3.8 UBS Fund Management (Switzerland) AG, 3.00%,
4
Dimensional Holdings Inc., 3.00%.
15.3 19.7
3 2
1 Pension funds, 3 Individuals
insurers, banks 4 Other companies
2 Foundations, funds 5 Shares pending registration
30.7.2021 | Half-Year Results 2021 33Appendix
Overview of biggest net changes in value
Revaluation Devaluation
Property TCHF Property TCHF
Zurich, Hohlstrasse 481 − 485b;
2,580 Aarau, Torfeld 3 –1,738
Albulastrasse 34 − 40
Lausanne, Avenue Edouard Dapples
2,441 St. Gallen, Wassergasse 50/52 –1,690
9/13/15/15a
Zurich, Im Tiergarten 7 1,790 Lausanne, Rue de Genève 17 –1,364
Zurich, Allmendstrasse 90 − 104 Kreuzlingen, Leubernstrasse 3;
1,747 –1,010
(Manegg) Bottighoferstrasse 1
Zurich, Turbinenstrasse 20 (Mobimo
Lausanne, Rue Voltaire 2 − 12 1,550 –890
Tower Hotel)
30.7.2021 | Half-Year Results 2021 34Appendix
The 15 biggest properties1
Fair value as at 30.6.2021
Address in CHF million Usage
Zurich (Labitzke) Rental apartments/
168.5
Hohlstrasse 481 – 485b; Albulastrasse 34 – 40 commercial property
Lausanne, Horizon 4 – 6; Avenue d’Ouchy 4 – 6 134.3 Commercial property
Retirement/care home,
Affoltern am Albis, Obstgartenstr. 9;
112.6 retirement and rental
Alte Obfelderstr. 27/29, 31 – 35
apartments
Zurich, Mobimo Tower Hotel
107.8 Hotel
Turbinenstrasse 20
1 Total fair value CHF 1,344 million
30.7.2021 | Half-Year Results 2021 35Appendix
The 15 biggest properties1
Fair value as at 30.6.2021
Address in CHF million Usage
Urdorf, In der Fadmatt 1 – 63; Apartments and terraced
102.8
Uitikonerstrasse 22, 24 houses
Lausanne (Petit Mont-Riond)
91.4 Rental apartments
Rue Voltaire 2 – 12
Zurich,
79.4 Rental apartments
Letzigraben 134 – 136
Zurich,
77.2 Commercial property
Friesenbergstrasse 75
1 Total fair value CHF 1,344 million
30.7.2021 | Half-Year Results 2021 36Appendix
The 15 biggest properties1
Fair value as at 30.6.2021
Address in CHF million Usage
Lausanne (Les Merciers)
77.2 Commercial property
Voie du Chariot 4 – 7
Commercial property/
Kriens, Am Mattenhof 12/14 72.8
rental apartments
Lausanne (Ilot du Centre)
68.2 Rental apartments
Rue Beau-Séjour 8
Zurich (Mobimo Tower)
66.2 Commercial property
Hardturmstrasse 3
1 Total fair value CHF 1,344 million
30.7.2021 | Half-Year Results 2021 37Appendix
The 15 biggest properties1
Fair value as at 30.6.2021
Address in CHF million Usage
Regensdorf (Sonnenhof)
64.8 Rental apartments
Schulstrasse 95/97/99/101/103/105
Lausanne, Place de la Gare 10;
63.4 Commercial property
Rue du Petit-Chêne 38
Au (ZH), Alte Landstrasse 93 – 99 57.2 Rental apartments
1 Total fair value CHF 1,344 million
30.7.2021 | Half-Year Results 2021 38You can also read


