CAPITAL MARKETS DAY PROSIEBENSAT.1 MEDIA AG AD SALES - THOMAS EBELING, OCTOBER 5, 2011 - PROSIEBENSAT.1 ...

Page created by Barbara Sullivan
 
CONTINUE READING
CAPITAL MARKETS DAY PROSIEBENSAT.1 MEDIA AG AD SALES - THOMAS EBELING, OCTOBER 5, 2011 - PROSIEBENSAT.1 ...
Capital Markets Day
ProSiebenSat.1 Media AG

Ad Sales
Thomas Ebeling, October 5, 2011

                                  Page 1
CAPITAL MARKETS DAY PROSIEBENSAT.1 MEDIA AG AD SALES - THOMAS EBELING, OCTOBER 5, 2011 - PROSIEBENSAT.1 ...
Strong sustainable position in an attractive market
with significant upside potential

  1   ProSiebenSat.1 with strong sustainable position in attractive market

  2   TV media mix winner as the most effective and indispensable media

  3   We stick to our guidance in 2011 with usual low visibility in Q4

  4   TV rests on solid fundamentals with significant upside potential

                                                                         Page 2
CAPITAL MARKETS DAY PROSIEBENSAT.1 MEDIA AG AD SALES - THOMAS EBELING, OCTOBER 5, 2011 - PROSIEBENSAT.1 ...
7.1M with strong and stable position in TV ad market

           Net Share of Advertising* (estimate)

           44

           42

           40

                2007                                2008       2009   2010   2011

                                                                                    Page 3
* P7S1 excl. N24, 9Live and Sixx; RTL Group excluding RTL II
Source: Own market estimates
CAPITAL MARKETS DAY PROSIEBENSAT.1 MEDIA AG AD SALES - THOMAS EBELING, OCTOBER 5, 2011 - PROSIEBENSAT.1 ...
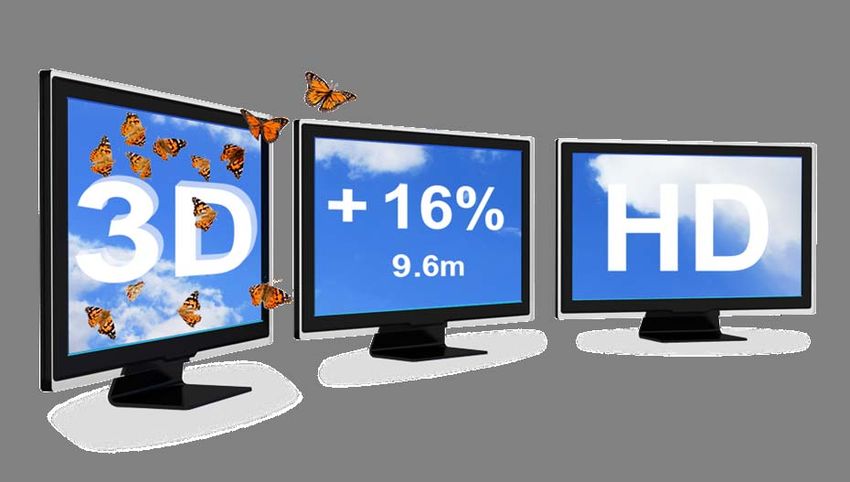
Strong 4 channels with complimentary market positioning …

 Target group structure and audience shares
 14-49, all day, in percent
                                                                       male
                                                                          share 14-49
                                                                          at 14+: 53.4%*

                                                                                           6.0%   11.6%

            share men
            at 14+: 48.4%*
 old                                                              10.6%                                   young

                                                                                                  0.3%

                                                                       female

                                                                                                          Page 4
Source: AGF/GfK Fernsehforschung / TV Scope / Audience Research [BS]
CAPITAL MARKETS DAY PROSIEBENSAT.1 MEDIA AG AD SALES - THOMAS EBELING, OCTOBER 5, 2011 - PROSIEBENSAT.1 ...
… and higher, stable power ratio

           Power Ratio = Net Share of Advertising/Audience Share*

           1.6

           1.5

           1.4

               2007                                2008        2009   2010   2011

                                                                                    Page 5
* P7S1 excl. N24, 9Live and Sixx; RTL Group excluding RTL II
Source: Own market estimates
CAPITAL MARKETS DAY PROSIEBENSAT.1 MEDIA AG AD SALES - THOMAS EBELING, OCTOBER 5, 2011 - PROSIEBENSAT.1 ...
RTL audience share gains mainly in low ad spend slots…

  RTL audience share gain,                                                                     Share of ad spend,
  viewers aged 14-49 years, %pt;                                                               in percent

                                                    0.2
                                     0.1

                    1.4
                                                                     2.1                                                                         100

                                                                                                                                    60

    0.5                                                                                                             21
                                                                                                    9                                    10

 Morning           Noon/   Access/                  Night           Total                      Morning           Noon/   Access/         Night   Total
                 afternoon Prime                                                                               afternoon Prime

                                                                                                                                                       Page 6
* Morning: 3:00-12:00; Noon/Afternoon: 12:00-17.30; Access/Prime: 17:30-23:00; Night: 23:00-3:00 / 1.1.-31.8. 2011 vs. 31.8. 2009, pp
 Source: AGF/GfK-Fernsehforschung, TV Scope / Nielsen Media Research, 1.1.-31.8.2011
CAPITAL MARKETS DAY PROSIEBENSAT.1 MEDIA AG AD SALES - THOMAS EBELING, OCTOBER 5, 2011 - PROSIEBENSAT.1 ...
… and with unattractive target group segments

  Characteristics of RTL afternoon audience
  comparison of structure shares, in %

                              63

                43

                                                                                       31

                                                                                                                          17
                                                                                                                  13
                                                                          8

               High income**                                          Higher education                           Brand consciousness
                RTL scripted reality core audience                      others

                                                                                                                                       Page 7
* Morning: 3:00-12:00; Noon: 12:00-14:00; Afternoon: 14:00-17.30; Access/Prime: 17:30-23:00; Night: 23:00-3:00
**Income>2.000 EUR / Source: AGF/GfK Fernsehforschung, TV Scope / own calculations
CAPITAL MARKETS DAY PROSIEBENSAT.1 MEDIA AG AD SALES - THOMAS EBELING, OCTOBER 5, 2011 - PROSIEBENSAT.1 ...
Strong sustainable position in an attractive market
with significant upside potential

  1   ProSiebenSat.1 with strong sustainable position in attractive market

  2   TV media mix winner as the most effective and indispensable media

  3   We stick to our guidance in 2011 with usual low visibility in Q4

  4   TV rests on solid fundamentals with significant upside potential

                                                                         Page 8
CAPITAL MARKETS DAY PROSIEBENSAT.1 MEDIA AG AD SALES - THOMAS EBELING, OCTOBER 5, 2011 - PROSIEBENSAT.1 ...
TV and Online are the media mix winner

 Development of net advertising share by media in Germany1
 in percent

                                  0.8                                                                                               6.02

                               65.9                                                                                                57.1

                          24.4                                                                                                     26.3

                            2000                                                                                                   2010
                                                                                                                                           Page 9

 Based on ZAW data; excluding direct mail and directories 2 Including display (banner and video), excluding Search and affiliate
Source: ZAW; OVK; Screen Digest; McKinsey
CAPITAL MARKETS DAY PROSIEBENSAT.1 MEDIA AG AD SALES - THOMAS EBELING, OCTOBER 5, 2011 - PROSIEBENSAT.1 ...
TV winner of the last crisis

 TV share in Net Media Mix
 Percentage

                                             100%

                                                    TV increased media-mix-
                                                    share in crisis by 1.3%pt

                             +1.3%

       25.0%                         26.3%

      2009                           2010

                     GDP declined
                       by -3.4%

                                                                                Page 10
Source: ZAW; OVK; McKinsey
TV usage in main target group 14-49 further increasing

   Average daily usage in Germany: viewers 14-49 years
   In minutes

210

180
                                                                                                                  206 min.
150

120

 90
                                                                                                                     78 min.
 60

 30
                                                                                                                    27 min.
  0
          2002                             2004                                   2006              2008   2010

             TV              Print           Online

 Note: Excl. passive Online usage starting from 2008
 (18% of total Online usage)
                                                                                                                     Page 11
 Source: TimeBudget / SevenOne Media / forsa. / GfK ENIGMA / mindline, Basis: 2,021 interviewees.
 Note: Print including Magazines and Newspapers.
Even young viewers keep high TV-usage – no cannibalization

   Average daily usage in Germany: viewers 14-29 years
   In minutes

180
                                                                                                              152min.
150

120
                                                                                                                  120min.
 90

 60

 30
                                                                                                                  21min.
  0
          2002                             2004                                   2006              2008   2010

                         TV               Print          Online

 Note: Excl. passive Online usage starting from 2008
 (18% of total Online usage)
                                                                                                                  Page 12
 Source: TimeBudget / SevenOne Media / forsa. / GfK ENIGMA / mindline, Basis: 2,021 interviewees.
 Note: Print including Magazines and Newspapers.
TV is the most attractive medium

   1   Highest and fastest reach

  2    Strongest emotional impact

  3    Cost efficient compared to other media types

  4    Leading to highest ROI – even indispensable for Internet companies

  5    Delivers value for agencies

                                                                        Page 13
1. Unrivalled daily reach – even kabel eins is above Bild

                        The Power of TV                                                                      ProSiebenSat.1 example

                                                                                                                                      Page 14
Source: AGF/GfK-Fernsehforschung; TV Scope, Fernsehp.(D+EU), weighted by person, time shifted utilization, product related (r,v,z),
01.03.2009-31.03.2009, for Fact viewers: Exposure time: 00:01:00; ma 2009 Presse II
2. TV has strongest emotional impact

Medium for strongest emotions
%

                Other
                                    15
 Internet
                      5
 Radio           4
  Print          4
                                                           72
                                                           TV

                                                                                           Page 15
„Which medium is most emotional, is most likely to make you cry or laugh? Basis: n=1.000
persons 14+ Source: forsa.
3. TV is cost efficient compared to other media types

 Net CPM ranges, in Euro

                                50

                                             40

                                                        25
                         15      15
                                             10

                         5                              0.5

                         TV   Newspapers   Magazines   Online

                                                                Page 16
Source: Solon estimate
4. TV advertising is working superbly with highest ROI

     Stronger brand                                         Higher probability         TV stimulates
      image / power                                            of purchase            online shopping
    Brands with high TV                                    Probability of purchase   73% more consumers
      presence twice                                       is 35% higher two days      if TV and Internet
      as frequently in                                          after TV spot              combined
  consumer’s relevant set

                                                                                                            Page 17
Source: GfK-study „Markenmotor TV“ / AC Nielsen / JupiterResearch Consumer Survey.
4. TV-ROI even higher than search-ROI

              1.53€

                                 1.22€

                                             TV-ROI 25% above
                                            Internet Search ROI

               TV                Internet
                                  Search

                                                                  Page 18
ROI: Based on net CPM pricing.
4. TV is even indispensible for Internet companies

 e-Commerce companies strongly                                                  … and spend 60% of budgets on TV
 increase TV spendings …                                                        Share of media spendings, YTD 2011
 Growth of gross TV ad spendings
                                                                                            Other
   85%
                                                                                                  4%
                                                                                  Print
                  x5                                                                      8%
                  x5

                                                                                          29%             59%
                                                                                       Internet
                                                                                                           TV
                 16%                          30%
                                                            x 12
                                                             2.5%

          2010                                   YTD 2011
     eCommerce              TV market

                                                                                                                     Page 19
Source: Nielsen Media Research, Product group „E-Commerce“, YTD: Jan-Aug 2011
4. TV ads immediately lead to Internet traffic

        Ad Investments and Internet Search Zalando
        T€ and Index

             12,000                                                                                                                                  100

             10,000                                                                                                                                  80
               8,000
                                                                                                                                                     60
               6,000
                                                                                                                                                     40
               4,000
                                                                                                                                                     20
               2,000

                    0                                                                                                                                0
                         Dec 09                           Mar 10                            Jun 10                           Sep 10

                              Ad pressure TV                   Google Searches

              Almost linear correlation between TV ads and Internet Search

                                                                                                                                                          Page 20

Based on gross advertising investments and queries (indexed to the maximum value = 100) Source: Nielsen Media Research, Google Insights for Search
5. TV delivers higher value to agencies

                                     Other                                                                                 Other

                                    Online                                                                                Online

                                     Print                                                                                  Print

                                                                                                                              TV
                                       TV

                        Share of net spendings                                                                 Share of Agency profit
                              (estimate)                                                                            (estimate)
                                                                                                                                        Page 21
 Based on ZAW data; excluding direct mail and directories 2 Including display (banner and video), excluding Search and affiliate
Source: ZAW; OVK; Screen Digest; own estimates
TV ad market in Germany underproportional as % of GDP

Ad intensity: TV Advertising as % of GDP, 2010
                                                                                                0.39

                                                           0.29

                                                                       0.23
                                                                               0.22
                                                                                       0.21
                                                                                                       0.21
                                       0.17
                   0.16

                                     France                Italy       Spain   UK     Western   USA
                                                                                      Europe

                                                                                                         Page 22
Source: Zenith Optimedia Advertising Expenditure Forecasts July 2011
Strength of TV could lead to increasing share in media-mix

                       100                                                                                  100
  Other                11%                                                                                  10%
Online                  6%                                                                                  10%

                                                                                                             51%
   Print                57%

                                                                                                                                  - TV most effective media

                                                                                                                                  - TV underproportional
                                                                                                                                    in Germany
                                                                                                            29%
      TV               26%

                      2011e                                                                                 2015e
                                                                                                                                                                    Page 23
 Based on ZAW data; excluding direct mail and directories 2 Including radio, cinema, outdoor 3 Including display (banner and video), excluding Search and affiliate
Source: ZAW; OVK; Screen Digest; own estimates; outlook based on PWC Entertainment & Media Outlook 2011-2015 and Zenith Advertising Expenditure Forecast 2011-2013
Strong sustainable position in an attractive market
with significant upside potential

  1   ProSiebenSat.1 with strong sustainable position in attractive market

  2   TV media mix winner as the most effective and indispensable media

  3   We stick to our guidance in 2011 with usual low visibility in Q4

  4   TV rests on solid fundamentals with significant upside potential

                                                                         Page 24
Commitment growth 2011 driven by smaller customers

Closed Commitments
2011 vs. 2010, %

     Top 50              Non Top 50              Total

                                                         Page 25
Most industries positive

                                                                                                                                   Nielsen Gross

 TV Spendings Top 10 TV industries EURm (gross) 2011 YTD
 Deviation vs. 2010 YTD in EUR m
                                                                                                         TV spend
                                                      White Line                                         in EUR m
                      Food -89                        -71                                                 1.025

              Cosmetics                                                       4                            799      Food impacted by several
                                                                                                                    different possible transient
    Trade & shipment                                                                              54       520
                                                                                                                     factors (e.g. raw material
                 Services                                                                          61      468             cost increase)
        Motor vehicles                                                                       39            459

              Beverages                                                           9                        423

 Telecommunication                                                   -5                                    373

                  Finance                                                             15                   351

               Pharmacy                                       -17                                          285

             Detergents                                   -25                                              234

                      Total                                                                        158    6.400
                                                                                                                                        Page 26
YTD: Jan-Aug 2011, excl. Media; Television advertising market, gross Source: Nielsen Media
Research/SevenOne Media, Market Intelligence (0180411)
Positive development since Q2

 Revenues 2011 vs. 2010, in percent

                            Q1                                                         Q2                Q3 (estimate)

                                                                        +3-5%               +3-4%       +3-4%       +3-4%

       - 4%                      - 2%                                   Market              7.1M        Market       7.1M
                                                                                            ex N24 in                ex N24 in
                                                                                            2010                     2010

      Market                     7.1M
                                 ex N24 in
                                 2010

                                                                                                                            Page 27
Note: Q1 and Q2 adjusted for N24 disposal in 2010 (deconsolidation on June 30, 2010)
We confirm flattish* outlook for German TV ad revenues

Scenario 1:                                                                                 Scenario 2:
Same on-top bookings as in 2010                                                             Less on-top bookings as in 2010

  Initial yearly/
                                                   +3-4%                                                            +3-4%
  commitments

  On top                                                             9%                                     less than 2010   5-6%
  bookings                                                       as in 2010

  Total
                                                                          +3-4%                                                flat
  revenues

                                                                                                                                      Page 28
* adjusted for N24: German TV ad revenues for P7S1 with slight growth; underlying revenue performance for
German-speaking segment with at least low single digit percent growth
Strong sustainable position in an attractive market
with significant upside potential

  1   ProSiebenSat.1 with strong sustainable position in attractive market

  2   TV media mix winner as the most effective and indispensable media

  3   We stick to our guidance in 2011 with usual low visibility in Q4

  4   TV rests on solid fundamentals with significant upside potential

                                                                         Page 29
Earlier this year: External market research firms expect
growth in German Net TV ad market

 German Net TV ad market Prognosis 2012

                                                                                                               + 4.4%

                                                                                                               + 2.3%

                                                                                                               + 3.5%

                                                                                                                                                                Page 30
Quellen: Zenith Optimedia: Advertising Expenditure Forecasts July 2011, WARC International Ad Forecast July 2011, PWC: Global entertainment and media outlook
2011-2015 | SevenOne Media, Market Intelligence
Future growth potential of TV until 2015

 1. Print cannibalization/media mix

 2. Pricing/ad intensity recovery

 3. Large HD & 3D screens

 4. HbbTV
 5. Combination TV/Online/Mobile

 6. Regional advertising targeting

 7. Ban public sponsoring/advertising

 8. New market segments

                                           Page 31
1. Cannibalization of print as potential key growth driver

 Media usage and net media mix
 %
                       40                         39%

                      30                                                          27%
                                                          26%
                                                                                                                              1pp increase in media
                                                                                                                              mix equals ~150m EUR
                      20
                                                                                                                                for the market and
                                                                                                                               ~ 60m EUR for P7S1
                                                                                                          10%
                      10

                                                                           3%                       2%
                      0
                                                        TV              Newspaper                  Magazine

                                 Share of net media usage 2010                         Share of media spendings 2010

                                                                                                                                             Page 32
Based on ZAW data; excluding direct mail and directories
Source: ZAW, OVK, mindline media, OVK Werbestatistik (Onlineinvestments inkl. Search und Affiliate) / SevenOne Media Market Research
2. Strong recovery of net CPT drives market growth

 Net TV ad market, Net CPT
 EUR m, Index: 2007 = 100

      100                                                                                   99                   102              1pp net CPT increase
                             99                                        95
                                                  90                                                                              equals ~ 40m EUR for
                                                                                                                                     the market and
                                                                                                                                  ~ 16m EUR for P7S1*

       2007                  2008                  2009                 2010                2011e                  2012e
             Net TV ad market             NET CPT

 Ad intensity: Net TV ad market as % of GDP
       0.17                 0.16                  0.15                 0.16                    n/a                   n/a
                                                                                                                                                 Page 33
* Assumption: 50% of price increase leads to market growth, 50% to decrease in sold minutes Basis: All TV-HH, A 14-49, CPT: 9-channel market
Source: AGF/GfK Fernsehforschung, DAP TV Scope, Nielsen Media Research, ZAW, estimate
2. TV with relatively small share of advertised products

                                                                                                          FMCG ONLY
 Total advertised products vs. TV advertised products

                                                                       25%
                                                                       Total = 32,600
                                                                       TV = 8,083
                                                                                             8%
                                                                                             Total = 77,550
                                                                                             TV = 6,318

                                                                            10%
                                                                            Total = 71,709
                                                                            TV = 7,234
                                                                                                     12%
                                        10%                                                          Total = 39,300
                                                                                                     TV = 4,696
                                        Total = 56,400
                                        TV = 5,793

                                                                                                                 Page 34
1 Total number of advertisers and total number of products estimated
Source: IP: Television 2010
2. Thus underproportional ad intensity in German TV market

Ad intensity: TV Advertising as % of GDP, 2010
                                                 0.39

                                                                                  0.01% recovery in ad
                                                                              intensity equals ~250m EUR
                             0.21                                              for the market and ~ 100m
                                                                       0.21      EUR for P7S1; reaching
       0.16
                                                                                European average would
                                                                              mean 1.25bn EUR for the TV
                                                                                        ad market

                          Western                USA
                          Europe

                                                                                                       Page 35
Source: Zenith Optimedia Advertising Expenditure Forecasts July 2011
3. Large HD & 3D screens drive TV and ad impact

                                            We believe:
                 Better screens > more ad impact > higher prices > growing market

                                                                                                                                       Page 36
Television Sales, PC and smartphones are estimated by EITO (European Information Technology Observatory), in cooperation with Bitkom
4. HbbTV convert TV ad into direct sales impact

      • Establish direct response channel to generate additional revenues
      • Drive interaction models (e.g. leads, coupons)

                                                                            Page 37
5. Potential ad impact of combined TV, Online & Mobile
campaigns

                                                                        buy Online

                       coupon
                       identified
                       via GPS                                          buy in store

           TV
      drives reach    +             Online & Mobile drive interaction
                                    and conclude the on/offline sale
                                                                                Page 38
6. Regional TV might attack print budgets

• Regional TV ads specifically attack
  large regional print spend
• Technology now available for regional
  TV over cable
• Primarily focus on tapping advertising
  budget of new clients currently not
  advertising with TV or P7S1
• USP: regionally targeted ads in highly
  attractive national broadcasting

             Upside potential of
          ~100m EUR for market and
              40m EUR for P7S1

                                            Page 39
Source: P7S1 own estimate
7. Significant upside potential through public ad ban

 EUR m
                      ~ 250 market
                      ~ 100 PS71

                                                              Significant upside
                                                              potential through
                                                                public ad ban
                                         ~ 50 market
                                         ~ 20 PS71

                     Ban ads at public   Ban sponsoring
                         stations        at public stations
                                              (2013)
                                                                                   Page 40
Source: P7S1 own estimate
8. New market segments (example betting)

• Ban of TV advertising in online betting
   segments challenged by EU commission

• TV highly attractive for betting companies

                  Additional market potential of > 80m EUR

                                                             Page 41
In summary: German Net TV ad market with significant
upside potential

 EUR m                                                                                           80            5,255
                                                                                300
                                                                  100
                                                     50

                                     375                                                                 1,105 1,350

   ~ 3,900                   450

                                                                                                                3,900

 Net TV ad         Media mix gain Recovery TV ad   Transaction   Regional/TV    Ban Public    New Market      Net TV ad
market 2011         (+3%pt; print    intensity       models                    Sponsoring /    Segments        market
                   cannibalization) (+0.015%)        (Hbbtv,                   advertising*   (e.g.Betting)   potential
                                                     Mobile)                                                    2015

                   With net SoA of 42% increase of >500m EUR for P7S1 possible;
                         conservative approach reflects ~1/3 (>150m EUR)
                                                                                                                        Page 42
Source: P7S1 own estimates
German TV ad market scenarios 2015

  EUR bn       Maximum       Historic    Conservative    Flat 2010    Market
               potential     market        scenario                  downturn

Market size
                 5.3           4.3           4.2           3.9         3.6
   2015

                 1.4
                               0.4           0.3
  Market                                                    0
  growth

                                                                       -0.3
Sales growth    > 0.5                       ~ 0.15
                              ~ 0.2                         0
    P7S1

                                                                     ~ -0.12

                     Conservative 150m EUR growth approach
                   allows for more upsides than downside risks
                                                                               Page 43
TV market risk perception might not materialize at all...

  1.    TV loosing to online

         • Young viewers continue to watch TV
         • Online reach additions limited
         • Online ad more costly than TV; superb ROI doubtful
         • Hybrid TV usage penetration possibly slower than in other key markets

  2.    TV pricing declining
         • Net CPM already below other media CPM

  3.    Economic downturn
         • Germany still a very attractive market

                                                                                   Page 44
... and TV ad market has further potential beyond 2015*

     1.                   Premium pricing for selected target groups through
                          individualized targeted TV ad campaigns

     2.
                          HbbTV is a major success

     3.                   Premium entertainment TV channels for elderly people allow
                          for premium pricing

     4.                   Additional new categories (innovations, prescription
                          pharmaceuticals)

                                                                                       Page 45
* not reflected in revenue potentials
Conservative German ad sales assumptions leave high
upside potential

   • Conservative approach with >150m EUR growth in Germany for P7S1

   • > 50m EUR for P7S1 in Austria/Switzerland

   • Significantly more upsides than downsides until 2015 and beyond

             TV will remain medium leader for reasonable growth

           P7S1 will sustain its strong position in an attractive market

                                                                           Page 46
Disclaimer
This presentation contains "forward looking statements" regarding ProSiebenSat.1 Media AG ("ProSiebenSat.1 AG"), its
subsidiaries/affiliates and/or ProSiebenSat.1 Group as a whole (all hereinafter collectively referred to as “P7S1 Group”),
including opinions, estimates and projections regarding P7S1 Group's financial position, business strategy, plans and
objectives of management and future operations and including opinions, estimates and projections regarding the
markets in which it presently operates or in which it expects to operate in the future. Such forward looking statements
involve known and unknown risks, uncertainties and other important factors that could cause the actual results,
performance or achievements of P7S1 Group to be materially different from future results, performance or achievements
expressed or implied by such forward looking statements. These forward looking statements speak only as of the date of
this presentation and are based on numerous assumptions which may or may not prove to be correct.

No representation or warranty, express or implied, is made by ProSiebenSat.1, its subsidiaries/affiliates or P7S1 Group
as a whole with respect to the fairness, completeness, correctness, reasonableness or accuracy of any information and
opinions contained herein. The information in this presentation is subject to change without notice, it may be incomplete
or condensed, and it may not contain all material information concerning P7S1 Group. ProSiebenSat.1 and its
subsidiaries/affiliates undertake no obligation to publicly update or revise any forward looking statements or other
information stated herein, whether as a result of new information, future events or otherwise.

                                                                                                                    Page 47
You can also read