MI COVID RESPONSE DATA AND MODELING UPDATE - NOTE: All data as of Jan. 16 unless otherwise noted - State of Michigan
←
→
Page content transcription
If your browser does not render page correctly, please read the page content below
MI COVID RESPONSE DATA
 AND MODELING UPDATE
   NOTE: All data as of Jan. 16 unless otherwise noted

                   January 19, 2021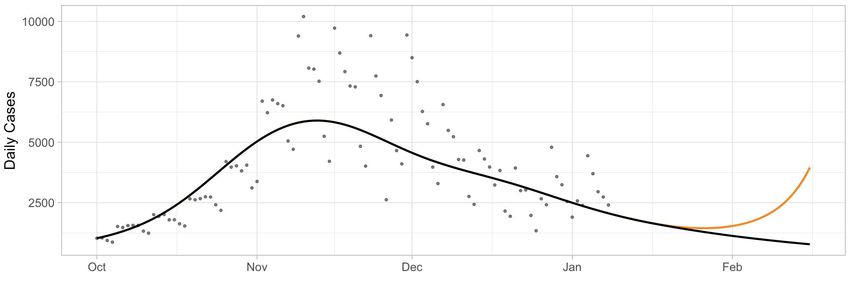
Executive summary
Michigan has the 23rd highest number of cases (↑1) , 14th highest number of deaths (↓6), 46th highest case rate
(↑2), and T23rd highest death rate (↓11) in the last 7 days (source: CDC COVID Data Tracker)

Michigan has the 34th highest hospitalization rate as a percent of total beds (↓1), and 16th highest number of
COVID patients in the ICU (↓2) in last 7 days (source: Becker’s Hospital Review)

Case rates (287.5, ↑21.7) are plateaued for the third week in a row, percent positivity (7.6%, ↓2.2%) is decreasing after
a week of increase, and testing has increased

10.7% of available inpatient beds are filled with COVID patients (↓1.4%) and state trends for COVID hospitalizations
are decreasing

There were 480 deaths (↓55) between Jan 3 and Jan 9, and death rate is 6.9 deaths per million residents

Daily diagnostic tests increased to an average of 41.4K per day (↑7.3K) over the last week and the state rate
is 3,972.9 tests/million/day (↑424.3)

512,906 doses reported to MDHHS of 1/19/21 (increase of 216,318 doses)

Science updates on the B.1.1.7 variant, herd immunity threshold and vaccination, and mobility
Comparison across states: Summary 1/18/21
What we see today:
• 5 states seeing increasing 1 week case trends (down vs. 38 last week)
• 46 states (down vs. 47) with significant outbreaks (high/increasing cases, increasing/high
  positivity increasing/high hospitalizations over 2 weeks (>100 per M))
• Arizona (653/M), Alabama, Georgia, Nevada, California have highest per capita
  hospitalized patient numbers
• Most rapid 1 week case growth: VA, ME, WA, NH, SC
• Midwest:
   –   Wisconsin showing slight drop in hospitalizations (150/M), moderate drop in cases (445/M)
   –   Indiana with slight decline in hospitalizations (354/M), and drop in cases (605/M)
   –   Illinois showing slow decline in hospitalizations (264/M), cases dropping (460/M)
   –   Ohio with declining hospitalizations (322/M) and slow drop in cases (620/M)
   –   Michigan showing continued decline in hospitalizations (191/M) and decline in cases (275/M)

                                                                                                     3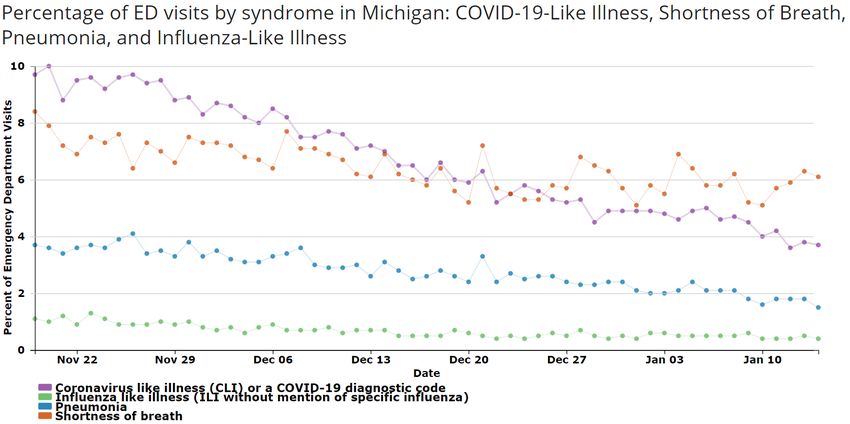
COVID-19 Spread Positivity has decreased to 7.6%, while testing has increased • Seven MERC regions now below 10% • Seven MERC regions have a decrease in positivity over the previous week Case rates are plateaued – note that CDC trend indicator showing declines, but this indicator is fluctuating Plateaus are seen among most age groups, races, and ethnicities 0-29 age group may be increasing Nearly a third of cases have race and ethnicity missing Number of active outbreaks is down 12% from previous week Number of reported school outbreaks decreased again since last week (50 to 40) with only outbreaks in high schools having an increase
Confirmed and probable case indicators                                            Risk levels
Table Date: 1/16/2021 (7 days from date table was produced: 1/9/2021)   Low   A   B       C     D   E

 Cases                                             Positivity
                                                                                                        5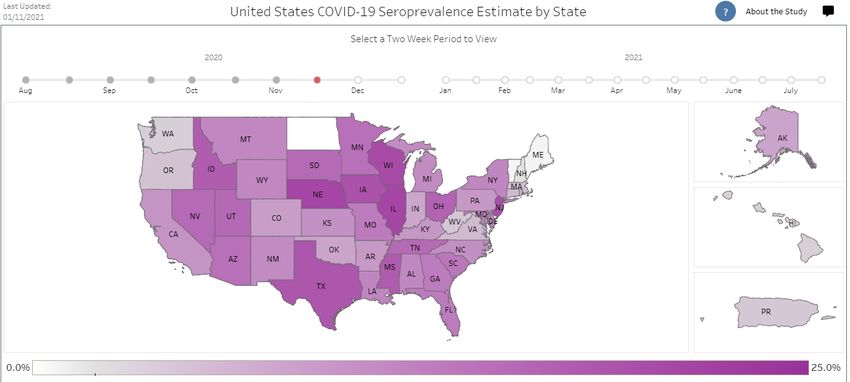
Recent statewide trends

     Statewide trends                                                                                                   Regional breakdown: Cases, hospitalization rate, and
                                                                                                                        positivity
                                         7-day average      Daily values                                                                               Positivity: 7-day average positivity, %
                                                                                                                                                       Cases: 7-day average cases per million
                            20.0%
                                                                                                                                                       Hosp. rate: 7-day average hospitalization rate, %

                            15.0%

Positivity, %               10.0%
                                                                                                     Current: 7.6%                                                               Positivity: 3.8%
                             5.0%                                                                                                                                                Cases: 281.7
                                                                                                                                                                                 Hosp. rate: 7.1%
                             0.0%
                                 10/19      11/2    11/16      11/30       12/14    12/28    1/11

                            1000

                             800
                                                                                                                         Positivity: 8.0%
                             600                                                                                         Cases: 281.7
Daily cases                  400
                                                                                                                         Hosp. rate: 6.2%

per million
                             200
                                                                                                      Current: 287.5
                                                                                                                                    Positivity: 8.2%
                                0                                                                                                                                                      Positivity: 8.0%
                                                                                                                                    Cases: 310.8
                                 10/19     11/2    11/16      11/30    12/14       12/28    1/11                                                                                       Cases: 321.5
                                                                                                                                    Hosp. rate: 9.8%
                                                                                                                                                                                       Hosp. rate: 12.5%

                            20%                                                                                                   Positivity: 8.0%
                                                                                                                                  Cases: 306.6
                            15%
Daily                                                                                                                             Hosp. rate: 14.2%
                                                                                                                                                                                        Positivity: 7.5%
hospitalization             10%                                                                        Current: 10.7%
                                                                                                                                                                                        Cases: 255.5
rate, %                      5%                                                                                                 Positivity: 8.6%                                        Hosp. rate: 10.6%
                                                                                                                                Cases: 347.5
                             0%                                                                                                 Hosp. rate: 12.2%
                                                                                                                                                                                         Positivity: 10.9%
                               10/19       11/2     11/16     11/30        12/14    12/28     1/11                                                                                       Cases: 444.3
                                                                                                                                                                                         Hosp. rate: 13.5%
  Source: https://mistartmap.info/
                                                                                                                                                                                                    6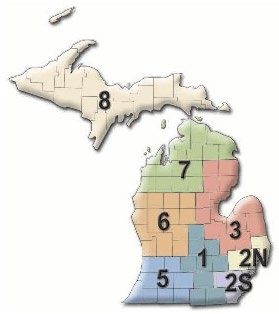
Positivity by county, 1/8-1/14
                                                 Average            # of counties
                                                 positivity per day
                                                                                            This week
                                                       =20%           1
                                                                        3

                                                 Updates since last week:
                                                 21 of 83 counties saw double digit positivity
                                                 in the last week (25 county decrease)

                                                                                                          7
 Source: SEOC Testing Results – Excluding MDOC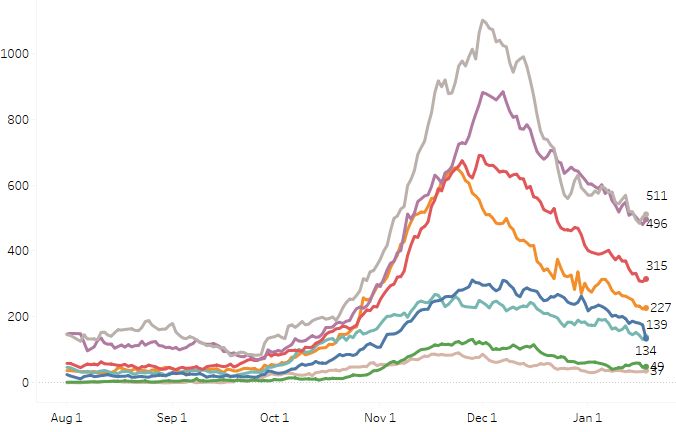
Confirmed COVID-19 cases by report date: State of Michigan

Confirmed cases reported on prior day (7-day rolling average)
    10,000
                                                                                                                                       Number of cases
      9,000
                                                                                                                                       7 day rolling average

      8,000

      7,000
                                                                                                                                       The number of weekly
      6,000                                                                                                                            reported cases to
                                                                                                                                       public health is
      5,000                                                                                                                            remaining about the
                                                                                                                                       same
      4,000

                                                                                                                       2,694           In the last week,
      3,000
                                                                                                                                       14,502 cases reported
      2,000                                                                                                                    1,738

      1,000

           0
            10/21         10/28        11/4        11/11   11/18   11/25   12/2   12/9   12/16   12/23   12/30   1/6    1/13

Source: MDHHS – Michigan Disease Surveillance System                                                                                                           8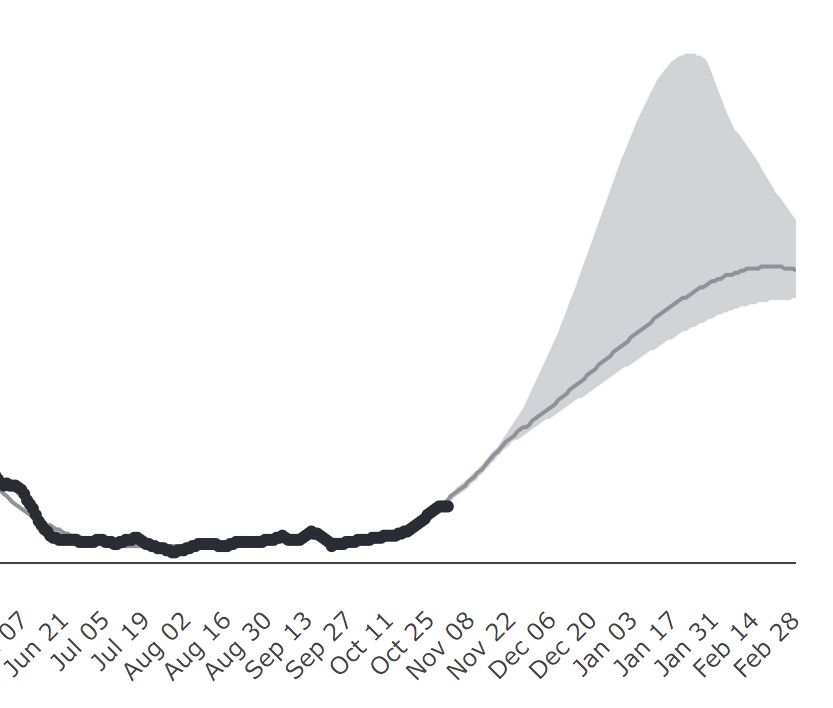
COVID-19 cases by onset date: State of Michigan

            Cumulative confirmed and probable cases , by date of                                                                New confirmed and probable cases , by date of
            onset of symptoms                                                                                                   onset of symptoms
              600000                                                                                                             11000
                                                                                                                                 10000
              500000                                                                                                              9000
                                                                                                                                  8000
              400000
                                                                                                                                  7000
                                                                                                                                  6000
              300000
                                                                                                                                  5000
                                                                                                                                  4000
              200000
                                                                                                                                  3000
              100000                                                                                                              2000
                                                                                                                                  1000
                      0                                                                                                                 0
                          3/1    4/1     5/1      6/1     7/1      8/1     9/1    10/1 11/1 12/1            1/1                             3/1    4/1     5/1      6/1      7/1     8/1      9/1     10/1 11/1 12/1             1/1

Updates since last week:
•     Cases are now at a plateau
•     Current statewide daily case rate remains more than 1.5x the highest risk level (risk level E is 150 cases/million)
•     More than half of regional case rates are 2x the risk level E threshold

                                                                                                                                                                                                                                       9
Note: Cases information sourced from MDHHS and reflects date of onset of symptoms (refers to lab-confirmed cases). Case spike on 5/12 is a result of batch of test results, not all of which have onset date of symptoms completed
Source: MDHHS – Michigan Disease Surveillance System
Age group: average new daily cases
Daily new confirmed and probable cases per million by age group (7-day rolling average)
1000
0-29 50-69
30-49 70+
800
600
400
200
0
3/1 3/15 3/29 4/12 4/26 5/10 5/24 6/7 6/21 7/5 7/19 8/2 8/16 8/30 9/13 9/27 10/11 10/25 11/8 11/22 12/6 12/20 1/3
• 30-49 age group continues to have the highest cases per million
• 0-29 age group has continued to increase (200 to 275) while other age groups have plateaued or are decreasing
10
Note: Cases information sourced from MDHHS and reflects date of onset of symptoms
Source: MDHHS – Michigan Disease Surveillance SystemAverage daily new cases per million people by race
Daily new confirmed and probable cases per million (7 day rolling average) by race category
600
American Indian/Alaska Native Black/African American
Asian/Pacific Islander White
500
400
300
200
100
0
3/1 3/15 3/29 4/12 4/26 5/10 5/24 6/7 6/21 7/5 7/19 8/2 8/16 8/30 9/13 9/27 10/11 10/25 11/8 11/22 12/6 12/20 1/3
• Cases per million continue plateau for most racial groups
• 30% of all cases represent unknown, multiple, or other races
Note: Cases information sourced from MDHHS and reflects date of onset of symptoms; note that Multiple Races, Other, and Unknown race/ethnicity are not included in calculations
Source: MDHHS – Michigan Disease Surveillance System 11Average daily new cases per million people by ethnicity
Daily new confirmed and probable cases per million (7 day rolling average) by ethnicity category
700
Hispanic or Latino Not Hispanic or Latino
600
500
400
300
200
100
0
3/1 3/15 3/29 4/12 4/26 5/10 5/24 6/7 6/21 7/5 7/19 8/2 8/16 8/30 9/13 9/27 10/11 10/25 11/8 11/22 12/6 12/20 1/3
• Cases per million are plateauing for both Hispanic/Latinos and non-Hispanic/Latinos
• 26% of all cases have an unknown ethnicity reported
Note: Cases information sourced from MDHHS and reflects date of onset of symptoms; note that Multiple Races, Other, and Unknown race/ethnicity are not included in calculations
Source: MDHHS – Michigan Disease Surveillance System 12Number of outbreak investigations by site type, week ending Jan 14
Easier to identify outbreak
Pre-decisional, for discussion only Draft Harder to identify outbreak
Site type Outbreaks by ongoing/new classification, # Visibility1 Total number of active
Ongoing New Total outbreaks is down 12% from
previous week
SNF/LTC/OTHER ASSISTED LIVING 394 37 431
MANUFACTURING, CONSTRUCTION 87 23 110
*RETAIL 55 15 70 Following LTCs, the greatest
HEALTHCARE 56 11 67 number of new outbreaks were
K-12 SCHOOL 32 8 40 reported in manufacturing/
OFFICE SETTING 28 4 32 construction (23), retail (15),
*SOCIAL GATHERING 20 9 29 healthcare (11), religious
CORRECTIONS 25 1 26 services (9), social gatherings
COLLEGE/UNIVERSITY 19 1 20 (9) and K-12 schools (8).
*RELIGIOUS SERVICES 11 9 20
OTHER 12 2 14 LHDs reported new outbreaks
CHILDCARE/YOUTH PROGRAM 9 5 14 in all settings except
AGRICULTURAL/FOOD PROCESSING 12 0 12 agriculture/food processing,
*RESTAURANTS AND BARS 6 1 7 shelters, and outdoor
*SHELTERS 70 7 community exposure
*PERSONAL SERVICES 1 1 2
*COMMUNITY EXPOSURE - INDOOR 0 1 1
*COMMUNITY EXPOSURE - OUTDOOR 00 0
TOTAL 774 128 902
1. Based on a setting’s level of control and the extent of time patrons/residents spend in the particular setting, different settings have differing levels of ability to ascertain whether a case derived from that setting
NOTE: Many factors, including the lack of ability to conduct effective contact tracing in certain settings, may result in significant underreporting of outbreaks. This chart does not provide a complete picture of
outbreaks in Michigan and the absence of identified outbreaks in a particular setting in no way provides evidence that, in fact, that setting is not having outbreaks. 13
Source: LHD Weekly SitrepsK-12 school outbreaks, recent and ongoing, week ending Jan 14
Number of reported outbreaks decreased since last week (50 to 40) including reductions in Middle/Jr High (12 to 7),
Pre K-Elementary (22 to 19), and Administrative (6 to 3). Only High Schools saw an increase in the number of reported outbreaks (10 to 12).
Number of Range of cases
Region Number of reported cases, # # Ongoing - Excluding New # New outbreaks per outbreak
Region 1 33 15 6 4-12
Region 2n 4 0 1 4-4
Region 2s 8 2 2 2-8
Region 3 125 21 17 5-19
Region 5 6 10 2 6-10
Region 6 84 5 10 2-16
Region 7 0 2 1 2-2
Region 8 5 0 1 5-5
Total 265 55 40 2-19
Number of Range of cases
Grade level Number of reported cases, # # Ongoing - Excluding New # New outbreaks per outbreak
Pre-school - elem. 110 23 19 4-19
Jr. high/middle school 69 4 7 1-16
High school 73 28 12 10-17
Administrative 15 0 2 3-7
Total 267 55 40 3-19
Many factors, including the lack of ability to conduct effective contact tracing in certain settings, may result in significant underreporting of outbreaks. This chart does not provide a complete picture
of outbreaks in Michigan and the absence of identified outbreaks in a particular setting in no way provides evidence that, in fact, that setting is not having outbreaks.
Source: LHD Weekly Sitreps 14COVID-19 and Healthcare Capacity and COVID Severity Hospitalizations and ICU utilization are decreasing COVID-like illness (CLI) continues with downward trend Hospitalizations down 52% since December 1st peak ICU occupancy declined 7% over last week All regions at or below 20% of Adult ICU beds with patients positive for COVID-19 Current deaths are a lagging indicator of cases, but the number of deaths have declined for fourth consecutive week Decreases in deaths seen among most ages, ethnicities, and races
Michigan Trends in Emergency Department Visits for COVID-19-Like
Illness (CLI)

                                            Source: https://covid.cdc.gov/covid-data-tracker/#ed-visits
Statewide Hospitalization Trends: Total COVID+ Census
This week, total COVID+ census in hospitals
Hospitalization Trends 7/1/2020 – 1/18/2021
is down 12% from the previous week and
Confirmed Positive
52% down from the December 1 peak.
Hospitalized COVID Positive Long
Term Trend (beginning March)
Confirmed Positive
PUI
17Statewide Hospitalization Trends: Regional COVID+ Census
Most regions are showing decreasing or flat
Hospitalization Trends 8/1/2020 – 1/18/2021
trends in COVID+ hospital census.
Confirmed Positive by Region
Regions 7 and 8 are up slightly this week,
though total volume hospitalized in these
regions remains very low.
Region Trend from Last COVID+
Week Hospitalizations /
MM
Region 2N Region 1 -33% 124/M
Region 2S
Region 2N -8% 230/M
Region 3 Region 2S -8% 223/M
Region 6 Region 3 -15% 278/M
Region 1 Region 5 -14% 145/M
Region 5
Region 7
Region 6 -14% 155/M
Region 8 Region 7 9% 98/M
Region 8 3% 119/M
18Statewide Hospitalization Trends: ICU COVID+ Census
The census of COVID+ patients in ICUs have declined
Hospitalization Trends 8/1/2020 – 1/18/2021 over the past week by 7% from the previous week.
Confirmed Positive in ICUs
Regions 2N, 7, 8 saw some increases in ICU census
this week although total census in regions 7+8 is low.
No regions have >20% of ICU beds occupied by
COVID+ patients.
Region Adult COVID+ in Adult ICU % of Adult ICU
ICU (% Δ from Occupancy beds COVID+
last week)
Region 1 33 (-28%) 91% 17%
Region 2N 92 (+19%) 80% 16%
Region 2S 117 (-19%) 80% 15%
Confirmed Positive in ICU
Region 3 72 (-4%) 88% 20%
Region 5 16 (-27%) 78% 11%
Region 6 60 (-10%) 64% 17%
Region 7 31 (+15%) 72% 17%
Region 8 11 (+57%) 72% 19%
Hospital bed capacity updated as of 1/15
19Pre-decisional, for discussion only
Draft
COVID-19 deaths by date of death: State of Michigan
Cumulative confirmed and probable deaths , by date of New confirmed and probable deaths , by date of
death death
15000 200
180
12000 160
140
9000 120
100
6000 80
60
3000 40
20
0 0
3/1 4/1 5/1 6/1 7/1 8/1 9/1 10/1 11/1 12/1 1/1 3/1 4/1 5/1 6/1 7/1 8/1 9/1 10/1 11/1 12/1 1/1
Updates since last week:
Although deaths are a lagging indicator of cases, the number of deaths have declined for four weeks
The current number of deaths is more than 5x the number of deaths in early October
20
Note: Death information sourced from MDHHS and reflects date of death of confirmed and probable cases.
Source: MDHHS – Michigan Disease Surveillance SystemPre-decisional, for discussion only
Average and total new deaths, by age group
Daily new confirmed and probable deaths per million Total new confirmed and probable deaths by age
by age group (7 day rolling average) group (past 30 days, ending 1/9/2021)
175
0-19 40-49 70-79 1,139
20-29 50-59 80+
150 30-39 60-69
8% of deaths below age sixty
125
100
591
75
50 334
25
108
7 18 38
0 1-5
10/1 10/15 10/29 11/12 11/26 12/10 12/24 1/7
0-19 20-29 30-39 40-49 50-59 60-69 70-79 80+
Note: Death information sourced from MDHHS and reflects date of death of confirmed and probable cases.
Source: MDHHS – Michigan Disease Surveillance System 21Pre-decisional, for discussion only
Average daily new deaths per million people by race
16
American Indian/Alaska Native Black/African American
14 Asian/Pacific Islander White
12
10
8
6
4
2
0
7/1 7/8 7/15 7/22 7/29 8/5 8/12 8/19 8/26 9/2 9/9 9/16 9/23 9/30 10/7 10/14 10/21 10/28 11/4 11/11 11/18 11/25 12/2 12/9 12/16 12/23 12/30 1/6 1/13
• Deaths per million continue to decrease among racial groups
• Whites have the most reported deaths per capita
• The large fluctuation seen among American Indian/Alaskan Native is due to small population size
Note: Multiple Races, Other, and Unknown race/ethnicity are not included in calculations
Source: MDHHS – Michigan Disease Surveillance System
22Pre-decisional, for discussion only
Average daily new deaths per million people by ethnicity
16
Hispanic or Latino Not Hispanic or Latino
14
12
10
8
6
4
2
0
7/1 7/8 7/15 7/22 7/29 8/5 8/12 8/19 8/26 9/2 9/9 9/16 9/23 9/30 10/7 10/14 10/21 10/28 11/4 11/11 11/18 11/25 12/2 12/9 12/16 12/23 12/30 1/6 1/13
• Deaths are a lagging indicator of cases
• Deaths per million continue to decrease for Hispanic/Latino and non-Hispanic/Latino
• There are fewer Hispanic/Latino deaths per million than non-Hispanic/Latino but these are not adjusted for confounders
Note: Multiple Races, Other, and Unknown race/ethnicity are not included in calculations
Source: MDHHS – Michigan Disease Surveillance System
23Pre-decisional, for discussion only
Michigan’s National Ranking for Deaths per 100,000
Including DC and NYC
50
Fewer deaths
45 compared to
40
other states
35
30
Ranking
25
20
15
10
More deaths
compared to
5
other states
0
3/24 4/7 4/21 5/5 5/19 6/2 6/16 6/30 7/14 7/28 8/11 8/25 9/8 9/22 10/6 10/20 11/3 11/17 12/1 12/15 12/29 1/12
Source: CDC COVID data tracker and U.S. CensusHow is public health capacity?
Testing volume has increased slightly from last week to 49,466
• 14.9% are antigen tests
• Testing by county ranges from 900 to 11,000 daily tests per million residents
Case investigations improving after the holiday dip
• Consistent proportion of cases interviewed have a source of known infection (indicating community spread)
• Among those cases interviewed, there continues to be a low proportion of those quarantining when their symptoms
begin`
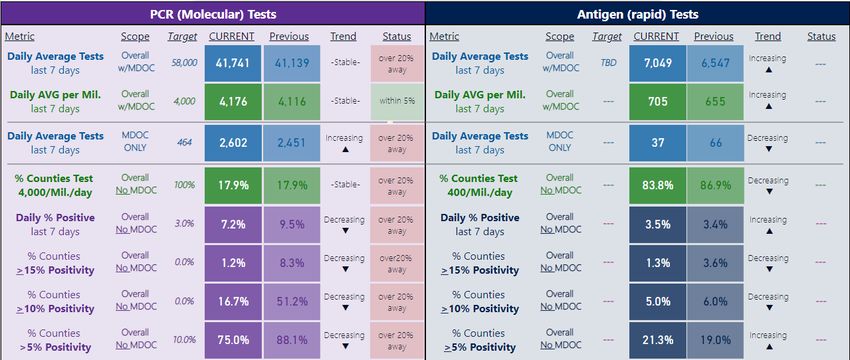
Testing Overview
49,466
(↑11,875)
Rolling 7-day average
daily diagnostic tests
reported to MDHHS
14.9% are antigen
tests over the past
week
- 3.5% positivity in
antigen tests
26
Source: MDSS/Michigan Medical Advantage Group, MDHHS, testing labs`
Daily diagnostic tests, by message date
Last 90 Days Tests By Test Type and Message Date
100,000
90,000
80,000
70,000
49,466
60,000 (↑11,875)
Rolling 7-day average
50,000 daily diagnostic tests
reported to MDHHS
40,000
30,000 14.9% are antigen
tests over the past
20,000 week
10,000
- 3.5% positivity in
- antigen tests
Total Diagnostic Tests Total Antigen Tests 7 day moving average, diag. tests
27
Source: MDSS/Michigan Medical Advantage Group, MDHHS, testing labsNew Case Investigation Metrics
New Communicable Disease metrics slightly increased since last week:
• 43% of investigated cases having a known source (42% last week, 46% week prior)
• 26% of investigated cases noting that they were quarantining before symptoms (28% last week)
01/02-01/08 Case report form information 01/09-01/15 Case report form information
21,374
Yes No Not answered
10,893
10,481 10,481 12,050
24% 14%
2,903 9,147 9,147
10,481
34% 58% 45% 33%
(49%)
9,147
(76%) 14% 42%
42%
28% 43% 26%
Case investigation complete? Known source of infection? Already quarantining at time Case investigation complete? Known source of infection? Already quarantining at time
of symptom onset? of symptom onset?
28
Source: MDHHS – Michigan Disease Surveillance SystemCOVID-19 Vaccination and Serology Seroprevalence of COVID in Michigan is 8.8% • On Monday, January 11, CDC published national data (through November 2020) • Michigan faired relatively better than neighboring states of Wisconsin, Illinois, and Ohio • More individuals have likely been infected than have been identified through disease surveillance and reporting • Individuals not identified were possibly asymptomatic or never received medical care for COVID-19 • Younger age is associated with a higher likelihood of seroprevalence COVID-19 Vaccination • 5.4% of Michiganders have first dose of vaccine (up from 3.2 last week) • 512,906 doses reported to MDHHS, including 437,027 first doses and 75,879 second doses
Nationwide Commercial Laboratory Seroprevalence Survey

                                                                  •   The estimated prevalence,
                                                                      or proportion of
                                                                      individuals who have ever
                                                                      been infected with SARS-
                                                                      CoV-2, as measured by
                                                                      antibodies in the blood
                                                                  •   Current CDC data through
                                                                      the end of November
                                                                      2020
                                                                  •   Despite the surge of cases
                                                                      in Michigan during the
                                                                      early months of the
                                                                      epidemic, Michigan has
                                                                      faired relatively better
                                                                      than neighboring states

                                  Source: https://covid.cdc.gov/covid-data-tracker/#national-lab
Michigan Commercial Laboratory Seroprevalence Survey
10%
8%
6%
4%
2%
0%
August November
Source: https://covid.cdc.gov/covid-data-tracker/#national-labMichigan Commercial Laboratory Seroprevalence Survey – Age and Sex Distributions
Doses Shipped and Administered

Data as of :     17-Jan-21    19-Jan-21                 18-Jan-21                 18-Jan-21
                 Enrolled      Doses         Total Doses
                 Providers    Shipped       Administered 1st dose 2nd dose 1st dose Coverage, 16+

Michigan              1,615       844,125         512,906 437,027    75,879         5.4%
Federal LTC
Program                           245,100
Total with LTC
Distribution                    1,089,225
Graphic based on 1/18/21
Long Term Care Federal Partnership

             Federal Long-Term Care Facility (LTCF) Pharmacy Partnership Program Data as of 1/16/21
                                                                                                   Additional
                                                                                       Total         Clinics
                                                    Facilities     First   % First   Vaccines     Scheduled
                                       Activation
                                                    Assigned      Clinic   Clinic  Administered       Over
                                         Date
                                                                 Complete Complete (Residents &   Next 7 Days
                                                                                      Staff)       (includes
Pharmacy Phase                                                                                       today)
CVS Part A (Skilled Nursing)           12/28/2020     269          269      100%      23317             0
CVS Part B (Other LTCF)                01/04/2021     717          331       46%      14781            210
Walgreens Part A (Skilled Nursing)     12/28/2020     146          126       86%      11396             22
Walgreens Part B (Other LTCF)          01/04/2021     3852         251        7%       7290            422
                              Totals                  4984         977                56784            654
Science Round Up MDHHS Bureau of Laboratories has identified B.1.1.7 variant in sample from Washtenaw County, expected to be elsewhere in Michigan • B.1.1.7 Variant is not expected to impact effectiveness of COVID-19 vaccines • Masking, social distancing and hand washing continue to be crucial • B.1.1.7 Variant transmits between humans more easily, so case rates may increase Safely achieving herd immunity through vaccination can reduce or eliminate spread of disease from person to person • A more transmissible B.1.1.7 variant means a higher herd immunity threshold is likely Mobility Update • Most recent data shows some return toward baseline mobility patterns, particularly for non-essential visits
SARS-CoV-2 Genetics • Viruses infect • B1.1.7 variant first
human cells identified in UK and
because they lack has now been found
the ability to in most US states;
RNA replicate including Michigan
(Genetic themselves in order
material/ to survive • The B.1.1.7 variant
Nucleic Acid)
does not give
RNA polymerase
• When the virus current indication of
(replication
impacting
machinery) replicates it can be vaccination or
error prone and treatment options
introduce mutations • Does lead to
increased ability to
transmit between
• Most mutations people
1. RNA tells proteins to form
will not affect the
2. Proteins fold and make things happen in a cell
virus due to: • Mitigation
• Minimal change in strategies of masks,
3. Damaged proteins can be bad for the virus or for hand washing,
protein
the human
• Virus is no longer distancing are all
viable due to effective at
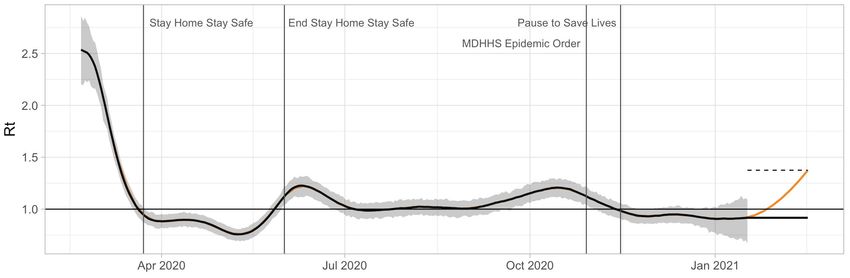
damaged proteins preventionProjecting the impact of the B.1.1.7 variant
• Rt over time in
Michigan—recent data
has been ~0.9
• UK data suggests Rt for
B.1.1.7 variant is 1.5x
higher (dashed line)
• Project impact of
B.1.1.7 assuming we
move to 1.5x Rt over 1
month (orange)
Data Sources: rt.live, MDSS data, Vöhringer et al.COVID-SIM projected vs. actual daily deaths
• November COVID-
Pause to
Save Lives
Pause to
Save Lives
SIM projection
(assumes conditions
stay the same) vs.
actual daily deaths
• Peak projected daily
deaths range ~125-
250
• Actual peak daily
deaths ~150
Source: MDSS data, COVID-SIMChange in average mobility
Unacast mobility
patterns in MI
Change in non-essential visits
Most recent data shows
some return toward
baseline mobility
patterns, particularly for
non-essential visits
(data through 1/14/21)
Difference in encounter density
unacast social distancing
scoreboard
https://www.unacast.com/co
vid19/social-distancing-
scoreboardQUESTIONS? Michigan.gov/Coronavirus
You can also read