Sustainability obstacles of free bike-sharing model - IOPscience
←
→
Page content transcription
If your browser does not render page correctly, please read the page content below
IOP Conference Series: Materials Science and Engineering

PAPER • OPEN ACCESS

Sustainability obstacles of free bike-sharing model
To cite this article: A Kocianova and L Slebodnik 2021 IOP Conf. Ser.: Mater. Sci. Eng. 1015 012104

View the article online for updates and enhancements.

                               This content was downloaded from IP address 46.4.80.155 on 25/04/2021 at 09:57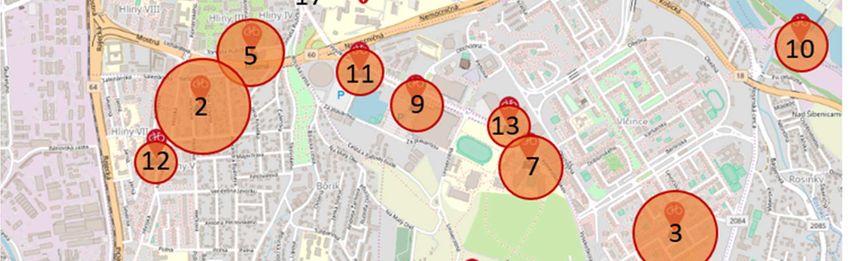
XXIX R-P-S Seminar 2020                                                                                                  IOP Publishing
IOP Conf. Series: Materials Science and Engineering              1015 (2021) 012104           doi:10.1088/1757-899X/1015/1/012104

Sustainability obstacles of free bike-sharing model

                     A Kocianova1 and L Slebodnik2
                     1
                       Department of Highway Engineering, Faculty of Civil Engineering, University of
                     Žilina, Univerzitná 8215/1, Žilina, 010 26, Slovakia
                     2
                       Municipality of Žilina, Nám. Obetí komunizmu 1, Žilina, 011 31, Slovakia

                     E-mail address: andrea.kocianova@uniza.sk

                     Abstract. Cycling is one of the options for sustainable urban mobility. Although this transport
                     mode is not so widely used in Slovak cities, the bike-sharing project in Žilina with 80 thousand
                     inhabitants has been remarkably successful. The system comprises of 120 shared bikes and 20
                     bike stations located mainly in the city core and wider centre to cover important transport
                     destinations. During the first-year usage, a great interest of citizens has been recorded also
                     thanks to the one-hour-free-of-charge service. That leads to an average rental number of 35
                     thousand bicycles per month (with a maximum of 47 thousand) and a high usage rate of the
                     system (on average, 9.5 rides per bike per day). A more detailed analysis, including the Covid-
                     19 pandemic’s impact on reducing bicycle rental, is presented in the article. In addition to the
                     positive experience with the bike-sharing system, the disadvantages of the one-hour-free
                     service model are discussed. In addition to the reduced service availability for citizens with real
                     transport needs or higher users’ disrespect to the system, the technical operation costs are about
                     40 % higher due to an excessive wear system, poorer technical condition, and shorter lifespan
                     of bicycles, or increase in a certain form of vandalism due to the bicycle joyriding. Ultimately,
                     the overall loss is much higher because of no income, which threatens the sustainability of this
                     system.

1. Introduction
There are several options to ensure sustainable urban mobility and to reduce the environmental impact
and energy consumption related to the mobility of citizens. One of them is the creation of
infrastructure and conditions for cycling, for instance, a bicycle sharing system. Bike-sharing service
provides an opportunity for residents as well as visitors to use other alternative modes of urban
transport in the city. This mode ensures relatively fast, flexible, and especially emission-free transport.
Furthermore, this also motivates people to move, which improves health as can be seen from the
conclusions of twelve major bike-sharing systems in Europe [1]. In addition, bike-sharing can be
motivational for the use of a bicycle as a commonly available mode of transport in the city on a private
basis. Also, preferring a bicycle over a car improves public space and the quality of the urban
environment, and reduces demands on the parking spaces. A well-designed and operated bike-sharing
system can brings also economic benefits. Individual benefits and public good benefits in an economic
context are demonstrated for example on the Dublin bike-share scheme [2]. However, for a successful
and long-term sustainable bike-sharing system in the city, it is important to have a well-established
service pricing policy.
    The article describes the bike-sharing system in the Slovak city of Žilina with 80 thousand
inhabitants and its enormous usage of this system. One of the main reasons for its widespread use is

              Content from this work may be used under the terms of the Creative Commons Attribution 3.0 licence. Any further distribution
              of this work must maintain attribution to the author(s) and the title of the work, journal citation and DOI.
Published under licence by IOP Publishing Ltd                          1
XXIX R-P-S Seminar 2020 IOP Publishing
IOP Conf. Series: Materials Science and Engineering 1015 (2021) 012104 doi:10.1088/1757-899X/1015/1/012104
the fact that the service is free-of-charge for up to one hour. The effects of this free service model on
the sustainability of the bike-sharing system are discussed in this article.
2. Brief description of the bike-sharing system in Žilina
The bike-sharing system in Žilina (BikeKIA) has started at the end of March 2019. It is a part of the
international bike-sharing system Nextbike operated by ARRIVA Slovakia. This system comprises of
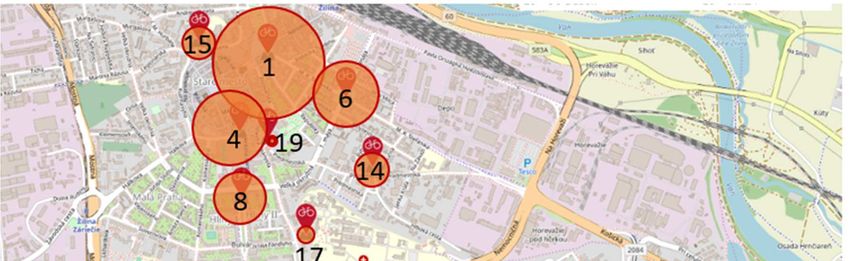
120 shared bikes and 20 bike-sharing stations located mainly in the city centre and wider central parts
of the city to cover the important strategic points, such as centres of residential areas, university area,
university dormitories, or health and shopping centres (see figure 1). The maximum distance between
stations is 4.5 km, most are within 500 meters. Except for two stations (No. 18 and 20), they are all on
a flat plane terrain.
The bike-sharing station network is connected via the Internet. Each bicycle is equipped with a
SMART Lock, GPS locator, and GSM communication. Renting a bicycle is based on a registration
system with payment card verification. This registration is possible via the web or an application, and
then the user opens the bicycle from the stand using a smartphone. Visitors and residents of Žilina can
rent a bike free of charge for one hour, without a registration fee or deposit. It is possible thanks to the
support of the non-profit Kia Motors Slovakia Foundation and the City of Žilina. Based on the
memorandum, they will finance the operation of the service for 5 years without any revenue from the
system.
A pricing scheme for the BikeKIA system is quite simple. It contains only basic tariff (for the first
60 minutes for free), service fee, and technical fees as shown in table 1.
Table 1. The pricing scheme for the BikeKIA system.
The bike must be returned to an official bike station within 1 hour of
Basic the first 60 min
biking FOR FREE. Then it is possible to rent another bike straight away
tariff FOR FREE
– for 1 hour FOR FREE again.
Service 20 EUR The fee for every additional hour if the bike is not returned within 1 hour.
fee 100 EUR 24 hours max.
75 EUR The bike was stolen because of negligence.
75 EUR The damage was done to the bike / rental station / bike stand.
Technical The bike was not returned to an official station and returned or locked
fee 25 EUR
incorrectly.
The use of the bike does not comply with the General Terms and
10 EUR
Conditions.
3. Utilization of the BikeKIA system
The analysis of bike-sharing utilization in this contribution is conducted based on the raw data from
the BikeKIA system supplied by the operator (start time, end time, duration, rental place, return place,
and bike number). The period analyzed in this paper is the first-year operation between April to
November 2019.
The location and utilization of bike-sharing stations are shown in figure 1. The size of the circle
represents the number of bike rentals from a given station. The most frequently used stations are in the
city centre and wider city centre (No. 1, 4, 5, 6 and 8), next to the university dormitories (No. 2 and 7),
inside the largest residential area (No. 3), next to the shopping centres (No. 9, 11 and 13), and Žilina
reservoir (No. 10) with several opportunities for sports and relaxation. The least frequently used
stations are on the hill at the university area and the forest park (No. 18 and 20) and also in the city
center near frequently used stations (No. 17 and 19).
The difference between the number of bicycle rentals and returns on frequented bike-sharing
stations is between 1-7% (see figure 1, right), which indicates a sufficient redistribution of shared
bikes and variety of bike-share rides during a day.
2XXIX R-P-S Seminar 2020 IOP Publishing
IOP Conf. Series: Materials Science and Engineering 1015 (2021) 012104 doi:10.1088/1757-899X/1015/1/012104
20
19 Utilization of stations
18
17 Rental Return
16
15
14
13
No. of bike-sharing station
12
11
10
9
8
7
6
5
4
3
2
1
- 10 000 20 000 30 000
Total number of rentals / returns
Figure 1. Utilization of rental stations.
The usage of the BikeKIA system is shown in the chart in figure 2. The total number of bicycle
rentals (bike-share rides) was about 280 thousand over the period with an average of about 35
thousand per month. The highest number of bicycle rentals was achieved in the first month of full
operation, the lowest in November due to the weather. A lower number of rentals were also recorded
during the summer holidays and in September when there are fewer university students in the city.
To demonstrate the BikeKIA system utilization, the usage rate of the system (an average bike-share
rides per day per bicycle) was determined. It ranges from 6 to 13 rides per day per bike depending on
the month with an average value of almost 9.5 (see figure 2). On some days in the first period of the
service operation, the usage rate reached the value of 20 rides per day per bicycle.
50 000 13.1 14
Average number of rides per bike per
Number of bicycle rentals per month
2019
45 000 11.3 12
40 000 10.4
9.1 9.2
35 000 8.7 8.4 10
30 000 8
day
25 000 5.9
20 000 6
15 000 4
10 000
2
5 000
0 0
04 05 06 07 08 09 10 11
Month
Usage of the system Usage rate of the system
Figure 2. Utilization of the BikeKIA system.
Covid-19 pandemic’s impact on reducing the usage of the system is presented in figure 3. The first
two months, March and April, are omitted because the system was not in operation at that time due to
coronavirus and state of emergency with strong restrictions in Slovakia. In May 2020, when several
companies had a home-office mode, and the university, all schools, and many shops were closed, there
3XXIX R-P-S Seminar 2020 IOP Publishing
IOP Conf. Series: Materials Science and Engineering 1015 (2021) 012104 doi:10.1088/1757-899X/1015/1/012104
was a decrease in the total number of bike-share rentals in comparison with 2019 of about 60 %. In
June 2020, when the university and most of the schools were closed, there was a decrease of about
40%. In July 2020, during the summer holidays and the standard mode without more significant
restrictions due to coronavirus, there was a decrease of only about 14%.
45 000 10 11 12
Average number of rentals per bike
Nnumber of bicycle rentals
- 14 %
40 000
- 37 %
9 10
35 000
8
30 000 - 60 % 7 8
25 000
per day
6
20 000 4
15 000 4
10 000
2
5 000
0 0
05 06 07
Month
Rentals 2019 Rentals 2020 Usage rate 2019 Usage rate 2020
Figure 3. Covid-19 pandemic’s impact on the usage of the BikeKIA system.
Presented data indicate a huge usage of shared bicycles in the city of Žilina. This can be confirmed
in comparison with systems in some selected Slovak and Czech cities (see table 2). It is possible to see
up to 3-4 times higher usage rate of the BikeKIA system compared to other systems.
A high utilization rate of the BikeKIA system is also evident in comparison with the average number
of rides per day per bike of bike-sharing systems in large cities such as Barcelona (6.5), Washington
DC (3.8), Miami Beach (3.2) or Melbourne (0.7) [3].
Table 2. Comparison of usage rates of bike-sharing systems (2019) a
Number of inhabitants Number of Number of Average number Usage rate of
City
in thousand stations bicycles of rentals per day the system
Žilina 81.1 20 120 1 142 9.5
Bratislava 424.4 74 400 1 020 2.6
Kladno 69.0 50 100 180 1.8
Ostrava 289.6 210 600 1 893 3.2
Prostějov 43.7 37 100 212 2.1
Havířov 72.1 20 80 265 3.3
a
Source: processed based on data in [5, 6, 7]
The main factors influencing a high utilization of the BikeKIA system include:
• free-of-charge bicycle rental for up to one hour, even several times a day,
• easy registration without any registration fee or deposit,
• inhabitants with a relatively low average age (36 years), quite a lot of young people - students
and university students,
• flat plane terrain (just only two stations are on the hill),
• optimal allocation of bike-sharing stations mainly in the city core and wider center with
covering strategic points,
• sufficient variety of bike-share rides ensuring natural redistribution of the shared bicycles
during a day,
• existing cycle routes, which are relatively safe,
4XXIX R-P-S Seminar 2020 IOP Publishing
IOP Conf. Series: Materials Science and Engineering 1015 (2021) 012104 doi:10.1088/1757-899X/1015/1/012104
• short distances between stations,
• reliable and simple system,
• good quality of operational service,
• good marketing.
4. Rental duration analysis
Since the BikeKIA system is free for 60 minutes, the bicycle rental duration was also analyzed. The
results in figure 4 show that most rentals take less than 20 minutes (73.1 % to 86.5 % by month, with
an average of 78.0 %). The proportion of rentals exceeding an hour is only 0.4 %, which is related to
the fact of free-of-charge rental for one hour. The proportion of rentals exceeding 20 minutes (20-60
minutes) is more than 20 %. The average rental duration is around 16 minutes.
50 000 20
Average duration of rental
Average duration of rentals [min]
17
Number of rentals per month
45 000 17 17 16 18 (2019)
15 15
40 000 15 16
14 0.4%
35 000 14
30 000 12
12.1%
25 000 10 9.5%
20 000 8 78.0%
15 000 6
10 000 4
73,1 %
78,6 %
74,7 %
75,5 %
76,5 %
76,5 %
84,5 %
86,5 %
< 20 min 0.…20-30 min
9.…
5 000 2 1…
30-60 min 7…
> 60 min
0 0
04 05 06 07 08 09 10 11
Month
Figure 4. The average duration of bicycle rentals.
A more detailed analysis of raw data has been revealed, that too long free-of-charge rental time
supports an unnecessary prolongation of rentals and usage of shared bikes for non-transport purposes
instead of effective interstation rides. These too long rentals mainly include “too long rides” (extended
or interrupted rides because they are free) and “rental rides” (rental station and return station is the
same). Experience has shown that these “rental rides” often include the usage of shared bikes mainly
by young users for fun (usage for joyrides).
The proportion of “rental rides” from all bike rentals during the observed period of 2019 is
represented by an average value of 11.6 % (7.1 % - 15.3 % depending on the month). Most “rental
rides” were recorded at the Žilina reservoir station (No. 10; about 42 %), and at the most frequently
used stations (No. 1, 2, and 3; about 15 %).
To determine the proportion of unnecessary long rides, the rental-return matrix of rental duration
limits was determined. For the setting of these limits, average travel times (depending on distance and
average speed 10 km/h) and the Modes of a set of data (rental durations) for all trips between stations
were calculated. As an example, processed data for the two most frequently used trips are shown in
figure 5. Rental duration limits have always been set higher than the mode of rental duration and
average travel time (by about 30 % higher than the average travel time depending on distance and
longitudinal slope). Rental durations exceeding the set limits were considered as “too long rides”.
5XXIX R-P-S Seminar 2020 IOP Publishing
IOP Conf. Series: Materials Science and Engineering 1015 (2021) 012104 doi:10.1088/1757-899X/1015/1/012104
From station 1 to station 2 From station 1 to station 3
350 350
distance = 3.1 km
Number of rentals
300
distance = 1.9 km 300
Number of rentals
average travel time = 11.4 min average travel time = 18.6 min
250 250 the Mode =16 min
the Mode =10 min
200 200
150 150
100 100
50 50
0 0
1 5 9 13 17 21 25 29 33 37 41 45 49 53 57 1 5 9 13 17 21 25 29 33 37 41 45 49 53 57
Duration in minutes Duration in minutes
Figure 5. Processed data of rental durations for two most frequently used trips.
Results for the observed period of 2019 show that only 65 % of all rentals were carried out for
travel purposes from the origin (rental station) to the destination (return station) without unnecessary
delays (effective interstation rides). The remaining percentage means using the shared bike for
purposes other than just effectively moving from point A to point B (too long rides and rental rides).
Further analysis revealed that these rentals are much longer than rentals for effective interstation rides.
More than half of these rentals exceed 20 minutes (see table 3).
11.6%
Effective interstation rides
23.5%
Too long rides
64.9%
Rental rides
Figure 6. The proportion of bicycle rentals by type of rides.
Table 3. Comparison of rental durations by type of bike-share ride.
Rental The proportion of the rentals in %
duration Effective interstation rides Too long rides Rental rides
< 20 min 96.6 42.4 47.7
20-30 min 3.2 24.6 14.0
30-60 min 0.2 32.1 37.0
> 60 min 0.0 0.9 1.2
Total 100.0 100.0 100.0
5. Effects of the free-of-charge service of the BikeKIA system
Excessive usage of the BikeKIA system thanks to the free-of-charge service model up to an hour
significantly affects the sustainability of this system, especially in two areas:
• quality of the service for users,
6XXIX R-P-S Seminar 2020 IOP Publishing
IOP Conf. Series: Materials Science and Engineering 1015 (2021) 012104 doi:10.1088/1757-899X/1015/1/012104
• financial sustainability of the system.
They are threatened mainly by:
• excessive wear of the system,
• worse technical condition and shorter lifespan of bicycles,
• increased requirements for redistribution,
• increased number of unnecessarily long rentals,
• increased certain form of vandalism and careless handling of bicycles due to their usage
mainly by young users for fun (usage for joyrides),
• higher users’ disrespect to the system.
In terms of the service quality, these aspects have the effect of reducing the functionality and
reliability of the system, user safety as well as the availability of this service for users with real
transport needs. Availability of the service is given by the availability of bicycles, which is reduced
due to more frequent repairs and charging bicycles, or using bicycles for joyrides mainly by young
users, unnecessary rides, or too long rides.
In terms of the financial sustainability of the system, the above-mentioned aspects result in higher
requirements for repairing, maintenance, and cleaning of bicycles which is associated with an
increased need and amount of work and materials (spare parts). For such an excessive used system,
material costs have proved to be almost double and the need for additional working time for
technicians almost 30 % higher compared to the standard used system. These increase the technical
operating costs of the system by up to 40 %.
6. Conclusions
The article presents a successful bike-sharing project in Žilina with data demonstrating the enormous
usage of this system. One of the most important reasons for such a large usage of the system is the
free-of-charge service - for up an hour, several times a day, and without registration fees or deposit.
This aspect, together with a well-designed and operating system thus offers a new opportunity for free
and ecological mobility of residents and visitors to the city. On the other hand, this threatens its long-
term sustainability, especially in two areas: quality of the service for users and the financial
sustainability of the system. In terms of the service quality, there are effects of reducing the
functionality and reliability of the system, user safety as well as the availability of this service for
users with real transport needs. In terms of the financial sustainability of the system, there are impacts
on higher technical operating costs of the system, which can be up to 40 %. Ultimately, the overall
loss is much higher because of no income.
The data analysis in the BikeKIA system shows that too long rental time for free unacceptably
supports an unnecessary prolongation of rentals and the use of shared bikes mainly by young users for
joyrides instead of an effective interstation rides This results not only in reducing the availability of
bicycles but also increased financial demands due to a certain form of vandalism and careless handling
of bicycles.
To ensure the use of a bike-sharing system for effective transport, while enabling free rental
service, it is necessary to change the rental conditions to eliminate as much as possible undesirable
rentals. One of the options is a significant reduction in rental time for free and the collection of a
registration fee or deposit. The rental time for free should be considered based on detailed data and
financial analysis. Another contribution to reducing vandalism and negligent treatment of bicycles can
be an increase in the fine, improving the intelligent monitoring of bicycles and rental stations, and the
support for other users in this monitoring.
Acknowledgments
The presented results were partially obtained under the grant Vega No. 1/0428/19, Implementation of
structural variables in the calculation of the modal split in the transport forecast (Implementácia
štrukturálnych veličín pri výpočte deľby prepravnej práce v prognóze dopravy)
7XXIX R-P-S Seminar 2020 IOP Publishing
IOP Conf. Series: Materials Science and Engineering 1015 (2021) 012104 doi:10.1088/1757-899X/1015/1/012104
References
[1] Otero I, Nieuwenhuijsen M J and Rojas-Rueda D 2018 Health impacts of bike sharing
systems in Europe Environment International 115 pp 387-94
[2] Bullock C H, Brereton F and Bailey S 2017 The economic contribution of public bike-
share to the sustainability and efficient functioning of cities Sustainable Cities and
Society 28 pp 76-87
[3] Fishman E, Washington S and Haworth N 2013 Bike share: a synthesis of the literature
Transport Reviews 33 pp 148-65
[4] Petru J and Krivda V 2017 Utilization filled spandrel bridge structure for interchange
cycle transport 17th International multidisciplinary scientific geoconference SGEM
2017 Geoinformatics Albena Bulgaria 06/07 2017 pp 867-74
[5] www.cyklodoprava.sk/wp-content/uploads/2019/10/slovnaftbajk.pdf
[6] www.akademiemobility.cz/aktuality/1112/predstavujeme-system-sdileni-kol-nextbike
[7] https://nasregion.cz/kladensko/sdilena-kola-se-kladenakum-libi/
8You can also read