December 2018 Southwest Florida Regional Economic Indicators - Regional Economic Research Institute
←
→
Page content transcription
If your browser does not render page correctly, please read the page content below
Southwest Florida
         Regional Economic
             Indicators

           December 2018
              VOLUME XII NUMBER 12

                              Lutgert College Of Business
Regional Economic             10501 FGCU Blvd. South
                              Fort Myers, FL 33965
Research Institute            Phone 239-590-7090
                              www.fgcu.edu/cob/reri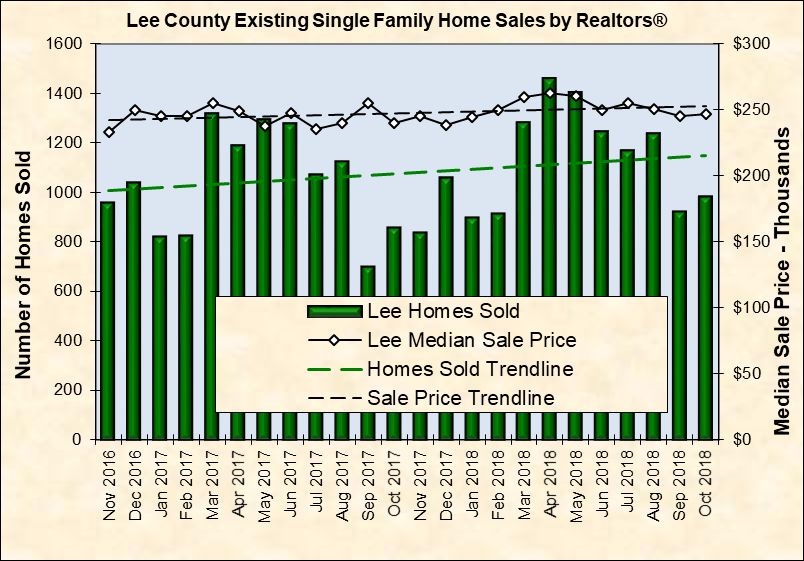
Table of Contents

Introduction: Regional and National Background ........................................................................................................4
Airport Passenger Activity .............................................................................................................................................5
    Chart 1: SW Florida International Passenger Activity...............................................................................................5
    Chart 2: Punta Gorda Airport Passenger Activity .....................................................................................................6
    Chart 3: Sarasota Airport Passenger Activity ............................................................................................................6
Tourist Tax Revenues .....................................................................................................................................................7
    Chart 4: Tourist Tax Revenues for the Coastal Counties ..........................................................................................7
    Chart 5: Coastal County Tourist Tax Revenues .........................................................................................................8
Taxable Sales .................................................................................................................................................................8
    Chart 6: Taxable Sales for 5 County Region ..............................................................................................................9
    Chart 7: Taxable Sales for Coastal Counties .............................................................................................................9
    Chart 8: Taxable Sales for Inland Counties .............................................................................................................10
Workforce – Labor Force, Employment and Unemployment......................................................................................10
    Chart 9: Lee County Labor Force and Unemployment ...........................................................................................11
    Chart 10: Collier County Labor Force and Unemployment ....................................................................................11
    Chart 11: Charlotte County Labor Force and Unemployment................................................................................12
    Chart 12: Hendry County Labor Force and Unemployment ...................................................................................12
    Chart 13: Glades County Labor Force and Unemployment ....................................................................................13
Single-Family Building Permits ....................................................................................................................................13
    Chart 14: Single-Family Building Permits for Lee County ........................................................................................14
    Chart 15: Single-Family Building Permits for Collier County ..................................................................................14
    Chart 16: Single-Family Building Permits for Charlotte County .............................................................................15
Existing Single–Family Home Sales and Median Prices ...............................................................................................15
    Chart 17: Existing Single-Family Home Sales for Lee County .................................................................................16
    Chart 18: Existing Single-Family Home Sales for Collier County .............................................................................16
    Chart 19: Existing Single-Family Home Sales for Charlotte County .........................................................................17

                                                                                       2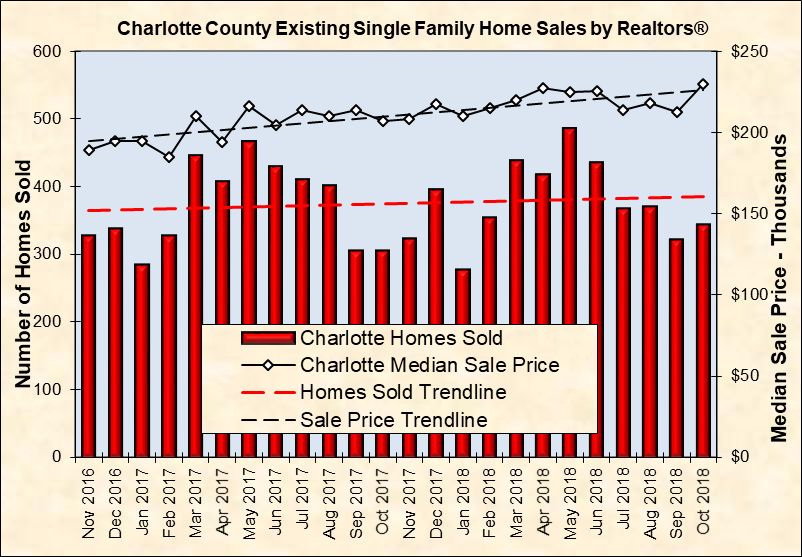
Consumer Sentiment Index .........................................................................................................................................17
    Chart 20: U.S. Index of Consumer Sentiment .........................................................................................................18
    Chart 21: Florida Consumer Sentiment Index .........................................................................................................18
Consumer Price Index ..................................................................................................................................................19
    Chart 22: CPI Annual Percentage Change...............................................................................................................19
    Chart 23: Miami-Fort Lauderdale CPI Component Percentage Change .................................................................20
Appendix ......................................................................................................................................................................20
    Chart A1: Coastal Counties Population, 1990 to 2045 ...........................................................................................21
    Chart A2: Inland Counties Population, 1990 to 2045 .............................................................................................21
    Chart A3: Historic and Projected GDP Growth, 2007 to Long Run .........................................................................22
    Chart A4: Historic and Projected Unemployment, 2006 to Long Run ....................................................................23
    Chart A5: Industry Diversification Index, 2000 to 2018 ..........................................................................................24

Regional Economic Indicators is published monthly by the staff and students of the Regional Economic
Research Institute at Florida Gulf Coast University.

                              Dr. Chris Westley, Director, Regional Economic Research Institute
                                      Phone: 239-590-7090 Email: cwestley@fgcu.edu
                         Mr. Steven Scheff, Business Analyst, Regional Economic Research Institute
                                       Phone: 239-590-7315 Email: sscheff@fgcu.edu
                         Mr. Jim Breitbach, Technical Support, Regional Economic Research Institute
                                                  Email: jbreitba@fgcu.edu
                         Mr. John Shannon, Economic Analyst, Regional Economic Research Institute
                                     Phone: 239-590-1430 Email: jmshannon@fgcu.edu

                                                          Copyright © 2018 FGCU - All rights reserved.

                                                                                        3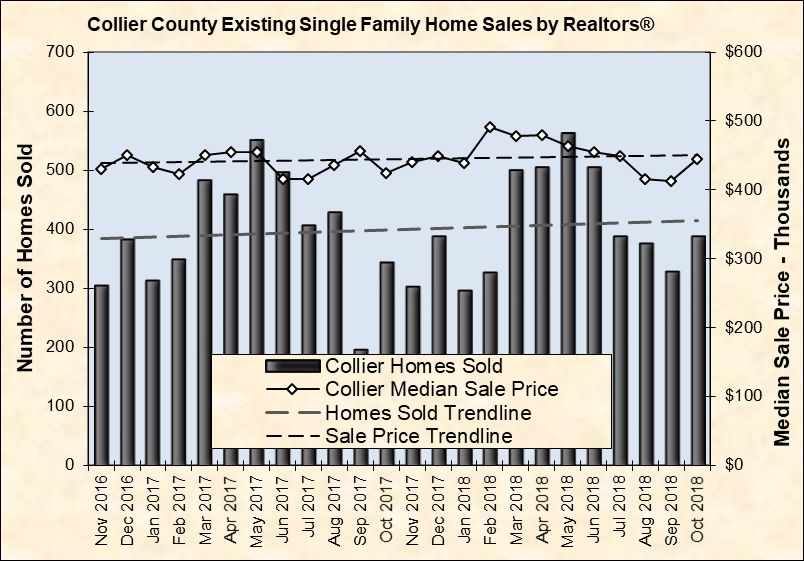
Introduction: Regional and National Background
Southwest Florida’s economy continues to display signs of robust growth. Improvements include a 31-
percent increase in total airport passenger activity between Irma-affected September 2017 and
September 2018, a 22-percent increase in taxable sales for September 2018 versus September 2017, and
a 14-percent increase in single-family home sales for the coastal counties from October 2017 to October
2018.
Southwest Florida’s seasonally-adjusted unemployment rate inched up to 3.1 percent in October 2018
from 3.0 percent in September 2018. Despite the increase, this represents an improvement of 0.6
percentage points from October 2017, and remains below Florida’s 3.4 percent and the nation’s 3.7
percent.
Other highlights in the report include:
Tourist tax revenues in September 2018 rose 5 percent over August 2018, but fell by 4 percent
from September 2017, possibly reflecting the continuing effects of red tide and algae blooms
in the region;
The region’s coastal counties issued 14 percent more single-family building permits in
October 2018 compared to October 2017; and
Median home prices for Charlotte County were up 11 percent from October 2017 to October
2018, while Collier and Lee counties reported also had modest increases of 5 and 6 percent,
respectively, during the same period.
The RERI staff extends its sincere thanks and appreciation to the dedicated individuals and organizations
who make this report possible. They include FGCU student workers affiliated with the RERI, the Southwest
Florida Regional Planning Council, the individual economic development organizations in Charlotte, Collier,
and Lee counties, the convention and visitors bureaus in Charlotte, Collier and Lee counties, the regional
airport authorities, the Realtors® of Collier, Lee, and Charlotte counties, the University of Florida Survey
Research Center, and the county and city permit offices.
4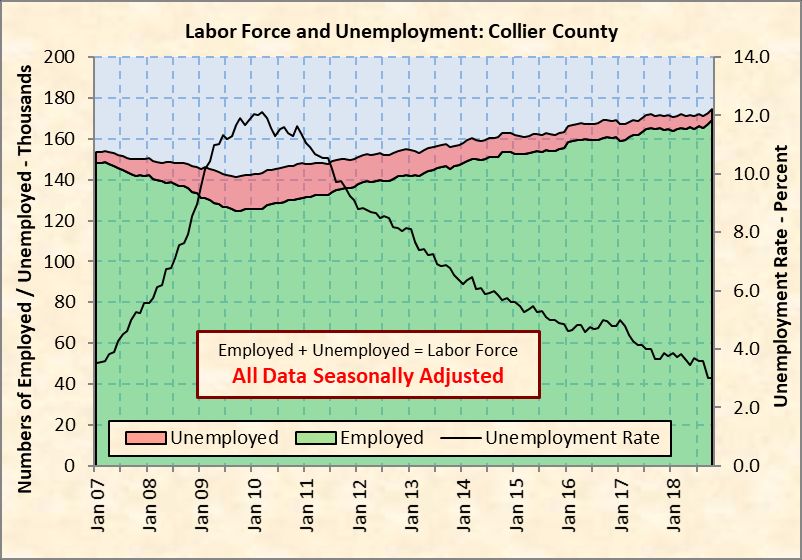
Airport Passenger Activity
Airport passenger activity is the sum of arrivals and departures for Southwest Florida International (RSW),
Sarasota Bradenton International (SRQ), and Punta Gorda (PGD) airports. Peak seasonal activity occurs in
February, March, and April, with significantly lower activity in the summer months. Charts 1, 2, and 3
illustrate this seasonality as well as the changes from year to year.

Passenger traffic for all three major airports during September 2018 increased 31 percent compared to
September 2017, a month which was negatively impacted by Hurricane Irma. As usual, passenger activity
seasonally declined, by 19 percent from August 2018. RSW showed a 28-percent increase in September
2018 over September 2017; the seasonal decrease from August 2018 was 17 percent (see Chart 1). PGD’s
activity in September 2018 increased 43 percent over September 2017, while seasonally declining 33
percent from August 2018 (see Chart 2). September 2018 passenger activity for Sarasota Bradenton was
36 percent higher than September 2017, and 16 percent lower than August 2018 (see Chart 3).

                                                        Chart 1: SW Florida International Passenger Activity
                                                                    SW Florida International Airport (RSW) Passenger Activity
                                                1,500

                                                                                                                                2015

                                                1,300                                                                           2016
         Arrivals plus Departures - Thousands

                                                                                                                                2017
                                                                                                                                2018
                                                1,100

                                                 900

                                                 700

                                                 500

                                                 300
                                                          Jan     Feb      Mar      Apr   May   Jun   Jul   Aug   Sep   Oct   Nov   Dec

                                                Source: Local Airport Authorities

                                                                                                 5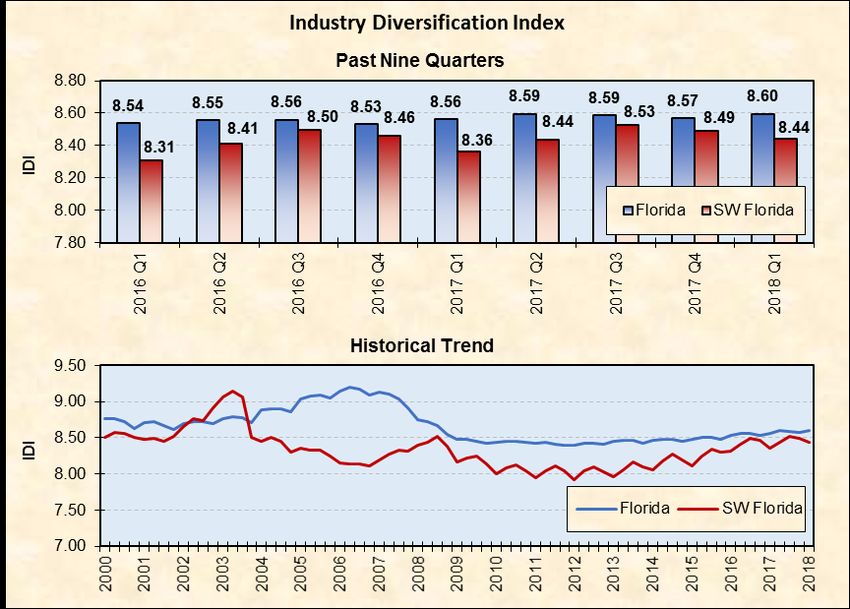
Chart 2: Punta Gorda Airport Passenger Activity
                                                                  Punta Gorda Airport (PGD) Passenger Activity
                                                  200

  Arrivals plus Departures - Thousands            180

                                                  160

                                                  140   2018

                                                  120              2017

                                                  100

                                                   80
                                                                          2015
                                                   60

                                                   40

                                                   20

                                                    0
                                                         Jan      Feb     Mar     Apr    May    Jun     Jul     Aug     Sep     Oct     Nov        Dec

Source: Local Airport Authorities

                                                         Chart 3: Sarasota Airport Passenger Activity
                                                               Sarasota Bradenton Int'l Airport (SRQ) Passenger Activity

                                                  175

                                                                                                                                            2015
           Arrivals plus Departures - Thousands

                                                                                                                                            2016
                                                  150
                                                                                                                                            2017
                                                                                                                                            2018

                                                  125

                                                  100

                                                   75

                                                   50
                                                        Jan     Feb     Mar      Apr    May    Jun    Jul     Aug     Sep     Oct     Nov     Dec
   Source: Local Airport Authorities

                                                                                                6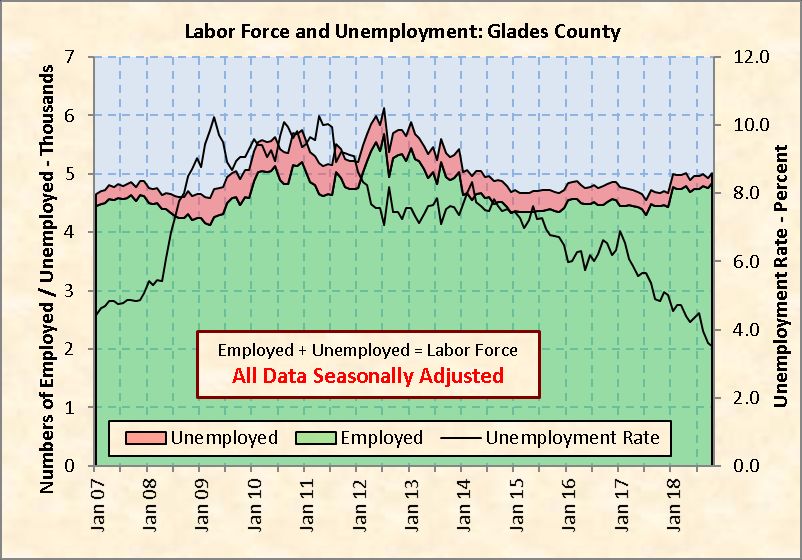
Tourist Tax Revenues
Seasonally-adjusted tourist tax revenues, shown in Charts 4 and 5, are based on month of occupancy. Total
revenues for the three coastal counties in September 2018 equaled $5,624,583—5 percent above August
2018, but 4 percent below September 2017.

Seasonally-adjusted tourist tax revenues for Lee County were $3,078,449 in September 2018, an increase
of 9 percent from August 2018, albeit 12 percent below September 2017. Collier County’s tourist tax
revenues were $2,270,067 in September 2018, fractionally higher than August 2018 and 15 percent above
the September 2017 figure. Seasonally-adjusted tourist tax revenues in Charlotte County were $312,302 in
September 2018, down 9 percent from August 2018 and 15 percent below the September 2017 figure.

                                                    Chart 4: Tourist Tax Revenues for the Coastal Counties
                                                         Tourist Tax Revenue 2013 to Present: 3 Coastal Counties Total
                                                    18
                                                              Unadjusted Data
                                                    16
            Monthly Tourst Tax Revenue - Millions

                                                              Seasonally Adjusted (SA) Data

                                                    14

                                                    12

                                                    10

                                                    8

                                                    6

                                                    4

                                                    2

                                                    0
                                                    Jan-13     Jan-14       Jan-15         Jan-16   Jan-17    Jan-18

         Source: Local County Tourism, Tax, and Economic Development Reports

                                                                                       7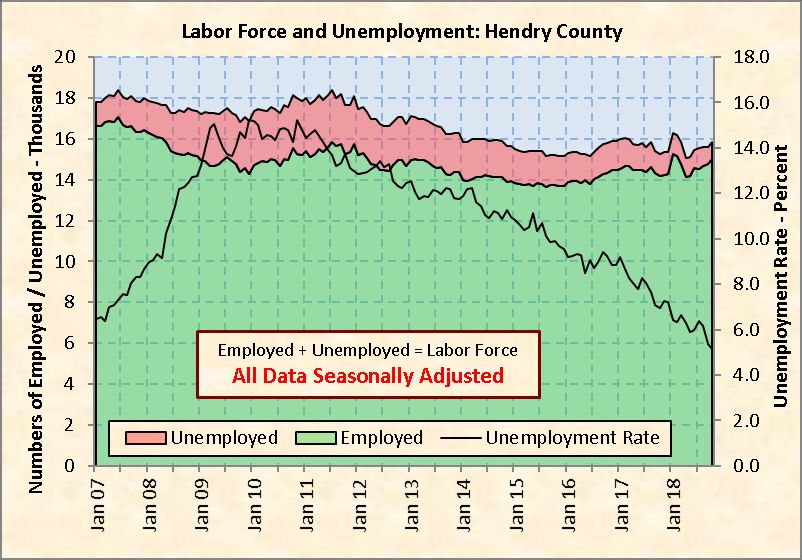
Chart 5: Coastal County Tourist Tax Revenues
                                                                   County Tourist Tax Revenue - 2013 to present
                                                      4.5

           Monthly Tourist Tax Revenue - $ Millions   4.0

                                                      3.5

                                                      3.0            Lee

                                                      2.5

                                                      2.0           Collier

                                                      1.5

                                                      1.0
                                                                      Charlotte
                                                      0.5

                                                      0.0
                                                        Jan-13       Jan-14       Jan-15       Jan-16   Jan-17    Jan-18
              Source: Local County Tourism, Tax, and Economic Development Reports and seasonal adjustment by RERI

Taxable Sales
Taxable sales data track consumer spending based on the latest month of merchant collections. Data lags
one month behind the Florida Department of Revenue’s reporting month and are now available through
September 2018.

Seasonally-adjusted taxable sales for the region totaled $2.428 billion in September 2018, a fractional
decrease from August 2018, and a 22-percent increase from September 2017 (see Chart 6).

Charts 7 and 8 show seasonally-adjusted taxable sales for the coastal and inland counties, respectively.
Lee County’s taxable sales totaled $1.298 billion in September 2018, down 1 percent from August 2018,
but 18 percent higher than September 2017. Collier County taxable sales grew to $830.3 million in
September 2018, an increase of 2 percent over August 2018, and 31 percent higher than September 2017.
Taxable sales in Charlotte County also showed a year-to-year gain, rising to $263.2 million in September
2018, up 17 percent from September 2017, albeit 1 percent less than August 2018.

Taxable sales in Hendry County amounted to $34.2 million in September 2018, compared to $29.1 million
in September 2017, an increase of 17 percent. Glades County taxable sales also increased from the prior
year to $4.4 million in September 2018, up 16 percent from September 2017. All cited data are seasonally-
adjusted.

                                                                                           8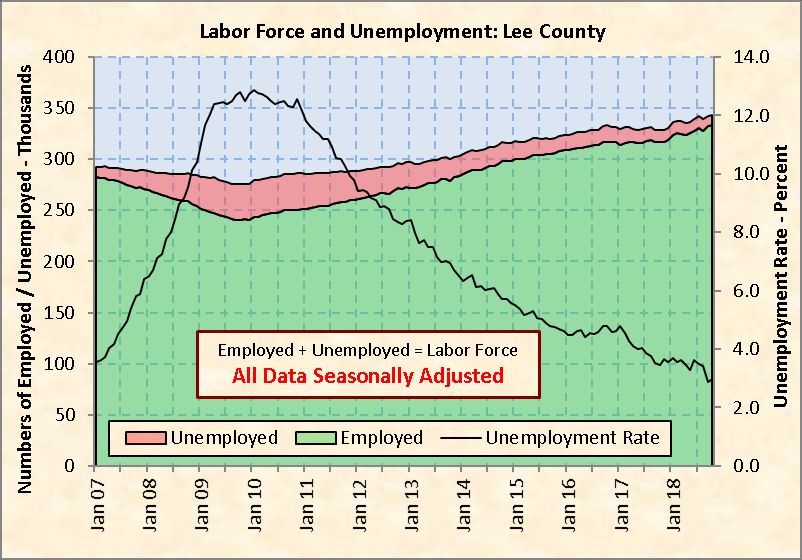
Chart 6: Taxable Sales for 5 County Region
                                                                         Taxable Sales 2013 to Present - 5 County Region
                                                        3.5

                   Monthly Taxable Sales - $ Billons
                                                        3.0

                                                        2.5

                                                        2.0

                                                        1.5

                                                        1.0
                                                                                     Unadjusted Data
                                                                                     Seasonally Adjusted (SA) Data
                                                        0.5

                                                        0.0
                                                           Jan-13       Jan-14      Jan-15       Jan-16       Jan-17       Jan-18

                       Source: Florida Department of Revenue, Office of Tax Research

                                                                    Chart 7: Taxable Sales for Coastal Counties
                                                                      Coastal County Taxable Sales - 2013 to Present
                         1,400

                         1,200
Monthly Taxabkle Sales - $ Millions

                                                                       Lee
                         1,000

                                                       800
                                                                        Collier
                                                       600

                                                       400                                         All Data Seasonally Adjusted
                                                                       Charlotte
                                                       200

                                                         0
                                                          Jan-13        Jan-14     Jan-15        Jan-16      Jan-17        Jan-18
        Source: Florida Department of Revenue, Office of Tax Research

                                                                                             9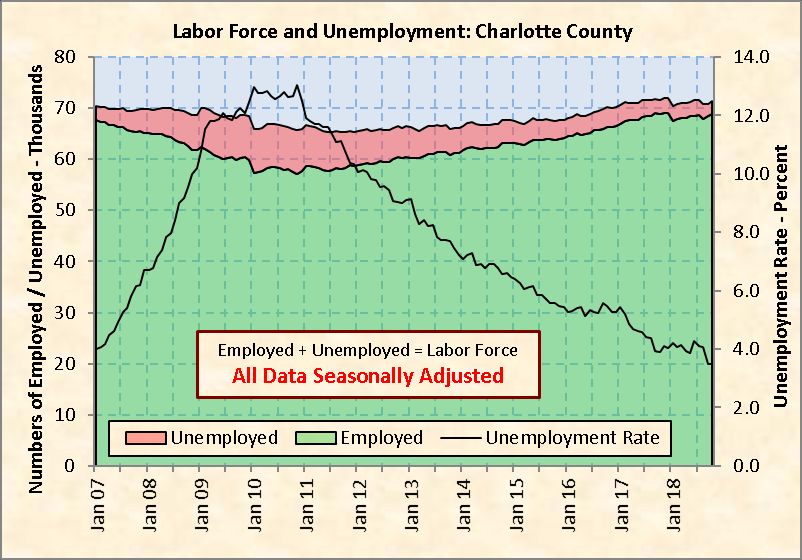
Chart 8: Taxable Sales for Inland Counties
                                                              Inland County Taxable Sales - 2013 to Present
                                                 40

            Monthly Taxable Sales - $ Millions   35

                                                 30            Hendry

                                                 25

                                                 20
                                                                                        All Data Seasonally Adjusted
                                                 15

                                                 10

                                                              Glades
                                                  5

                                                  0
                                                   Jan-13      Jan-14     Jan-15        Jan-16      Jan-17      Jan-18

            Source: Florida Department of Revenue, Office of Tax Research

Workforce – Labor Force, Employment and Unemployment
Charts 9-13 show total persons employed and unemployed, and the unemployment rate, all seasonally
adjusted by the RERI, for each county from January 2007 through October 2018. The number of employed
persons in Southwest Florida increased by 3,243 from September to October 2018, while the number of
unemployed also increased by 463. As a result, the region’s October unemployment rate edged up to 3.1
percent from 3.0 percent in September 2018, still well below the 3.7 percent figure observed in October
2017.

Lee County’s seasonally-adjusted unemployment rate was 3.0 percent in October 2018, up from 2.9
percent in September 2018 and 0.4 percentage points below October 2017, as depicted in Chart 9. The
Collier County unemployment rate held at 3.0 percent in October 2018, down 0.7 points from October
2017 (Chart 10). The unemployment rate in Charlotte County remained at 3.5 percent in October 2018,
down from 3.9 percent in October 2017 (Chart 11).

The inland counties experienced decreases in their unemployment rates. Hendry County’s
unemployment rate dropped to 5.1 percent in October 2018, down from both the previous month (5.4
percent) and the previous year (7.0 percent) (Chart 12). The October 2018 unemployment rate for Glades
County fell to 3.5 percent from 3.6 percent in September 2018, and from 4.8 percent in October 2017
(Chart 13).

The state of Florida continued to show a downward trend in unemployment. The unemployment rate for
Florida dipped to 3.4 percent in October 2018, down from 3.5 percent in September 2018, as well as 3.9
percent in September 2017. These results continue to compare favorably with the United States, which

                                                                                   10
reported an unemployment rate of 3.7 percent in October 2018. While the nation’s unemployment rate
remained the same from the previous month (3.7 percent), it fell 0.4 percentage points from October
2017.
Chart 9: Lee County Labor Force and Unemployment
Source: Florida Department of Economic Opportunity and seasonal adjustment by RERI
Chart 10: Collier County Labor Force and Unemployment
Source: Florida Department of Economic Opportunity and seasonal adjustment by RERI
11Chart 11: Charlotte County Labor Force and Unemployment
Source: Florida Department of Economic Opportunity and seasonal adjustment by RERI
Chart 12: Hendry County Labor Force and Unemployment
Source: Florida Department of Economic Opportunity and seasonal adjustment by RERI
12Chart 13: Glades County Labor Force and Unemployment
Source: Florida Department of Economic Opportunity and seasonal adjustment by RERI
Single-Family Building Permits
The three coastal counties again reported strong year-to-year growth in single-family building permits for
October 2018. A total of 890 permits were issued by the three counties in October 2018, an increase of
108 (14 percent) over October 2017, and 61 more (7 percent) than September 2018. Lee County issued
510 permits in October 2018, an increase of 48 (10 percent) from October 2017, and 81 more than
September 2018 (Chart 14). In Collier County, 213 permits were issued in October 2018, an increase of 11
from October 2017, but 10 fewer than September 2018 (Chart 15). During October 2018, Charlotte County
issued 167 permits, 49 (42 percent) more than October 2017, and 10 fewer than September 2018 (as
depicted in Chart 16).
Through October 2018, Hendry County issued 148 single-family building permits, more than double the 68
issued during the same ten-month period last year.
13Chart 14: Single-Family Building Permits for Lee County
Single Family Permits Issued - Lee County
2008-2017 Monthly Averages; Most Recent 13 Months Data and Trend
700
650
600
550
500
450
Permits Issued
400
350
300
250
200 Permits
150
Linear Trend
100
50
0
Oct 2017
Apr 2018
Oct 2018
Feb 2018
Mar 2018
May 2018
Jul 2018
2008 Av
2009 Av
2010 Av
2011 Av
2012 Av
2013 Av
2014 Av
2015 Av
2016 Av
2017 Av
Nov 2017
Dec 2017
Jan 2018
Jun 2018
Aug 2018
Sep 2018
Source: Local Building and Zoning Departments, including Fort Myers, Cape Coral, and Unincorporated Lee County,
Bonita Springs, Estero, and Fort Myers Beach permits
Chart 15: Single-Family Building Permits for Collier County
Single Family Permits Issued - Collier County
2008 - 2017 Monthly Averages; Most Recent 13 Months Data and Trend
400
350
300
250
Permits Issued
200
150
100
Permits
50 Linear Trend
0
Oct 2017
Apr 2018
Oct 2018
Feb 2018
Mar 2018
May 2018
Jul 2018
Nov 2017
Dec 2017
Jan 2018
Jun 2018
2008 Av
2009 Av
2010 Av
2011 Av
2012 Av
2013 Av
2014 Av
2015 Av
2016 Av
2017 Av
Aug 2018
Sep 2018
Source: Local Building and Zoning Departments, includes unincorporated Collier County permits only
14Chart 16: Single-Family Building Permits for Charlotte County
Single Family Permits Issued - Charlotte County
2008-2017 Monthly Averages; Most Recent 13 Months Data and Trend
220
200
180
160
Permits Issued
140
120
100
80
60
Permits
40
Linear Trend
20
0 Oct 2017
Apr 2018
Oct 2018
Feb 2018
Mar 2018
May 2018
Jul 2018
2008 Av
2009 Av
2010 Av
2011 Av
2012 Av
2013 Av
2014 Av
2015 Av
2016 Av
2017 Av
Nov 2017
Dec 2017
Jan 2018
Jun 2018
Aug 2018
Sep 2018
Source: Local Building and Zoning Departments, includes unincorporated Charlotte County permits only
Existing Single–Family Home Sales and Median Prices
Charts 17-19 summarize existing single-family home sales by a Realtor® for Lee, Collier, and Charlotte
Counties. The solid lines represent median prices plotted against the scale on the right side, and the bars
represent the number of homes sold with the scale on the left side. The broken lines show the trends in
numbers of homes sold and median prices.
Total Realtor® sales of single-family homes in the three counties improved to 1,714 units in October 2018,
an increase of 14 percent (206 units) over October 2017, and 9 percent (140 units) higher than September
2018.
There were 982 single-family home sales in Lee County in October 2018, up 15 percent from October 2017,
while the median price increased from $240,000 to $246,995 (Chart 17). Collier County single-family home
sales were 388 units in October 2018, up 12 percent from October 2017, notwithstanding an increase in
the median price from $425,000 to $444,413 in this period (Chart 18). In October 2018, Charlotte County
had 344 single-family home sales, a 12-percent improvement from October 2017. Charlotte’s median price
was $230,000 in October 2018, up $23,000 from the prior October (Chart 19).
15Chart 17: Existing Single-Family Home Sales for Lee County
Source: Realtor® Association of Greater Fort Myers and the Beach, Inc.
Chart 18: Existing Single-Family Home Sales for Collier County
Source: Florida Realtors® Naples-Immokalee-Marco Island, Florida MSA
16Chart 19: Existing Single-Family Home Sales for Charlotte County
Source: Florida Realtors® Punta Gorda, Florida MSA
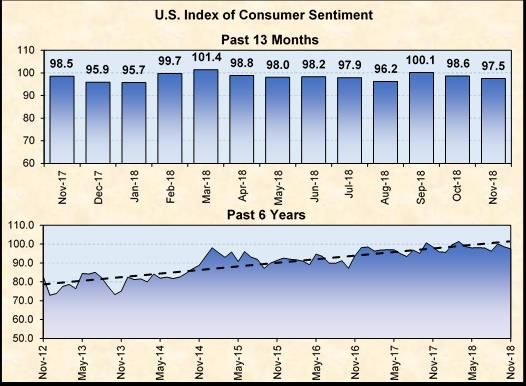
Consumer Sentiment Index
Charts 20 and 21 shows monthly data and linear trend lines over the last six years for both the Florida
Consumer Sentiment Index (“CSI”) reported by the University of Florida Bureau of Economic and Business
Research (BEBR) and for the United States Index of Consumer Sentiment (“ICS”) reported by Thomson
Reuters/University of Michigan.
The U.S. Index of Consumer Sentiment dipped to 97.5 in November 2018, down 1.1 points from October
2018, and 1 point below November 2017. The November 2018 issue of Survey of Consumers noted,
“Consumer sentiment has remained largely unchanged at very favorable levels during 2018, with the
November reading nearly at the center of the eleven month range from 95.7 to 101.4.”
The Consumer Sentiment Index for Florida was not available at the deadline. However, the index fell for
the third consecutive month in October 2018, declining to 97.8. The index decreased three-tenths of a
point from the September 2018 figure, but remained three points above the October 2017 index. “Despite
the slight decrease in October, consumer sentiment continues to be high in Florida. Floridians’ opinions as
to whether now is a good time to buy a major household item increased with October’s reading to its
second-highest level of 2018,” Hector H. Sandoval, director of the Economic Analysis Program at the
University of Florida’s Bureau of Economic and Business Research, said in the October 30, 2018 edition of
Florida Consumer Sentiment Index. “In addition, unemployment levels in Florida are currently at their
lowest since February 2007. All of these indicators are positive signs for retailers who can expect increased
spending during the holiday shopping season.”
17Chart 20: U.S. Index of Consumer Sentiment
Source: Thomson Reuters/University of Michigan
Chart 21: Florida Consumer Sentiment Index
Source: Bureau of Economic and Business Research, University of Florida
18Consumer Price Index
Chart 22 shows year-to-year changes in consumer price indices (CPI) through October 2018. The Chart
depicts noticeable increases in consumer price inflation compared to the previous six years. The October
2018 Miami/Ft. Lauderdale CPI showed an increase of 3.4 percent from October 2017, compared to 2.7
percent from October 2016 to October 2017. CPI growth in the US South Region was 2.1 percent from
October 2017 to October 2018, slightly higher than the 2.0 percent recorded from October 2016 to October
2017. Nationally, the CPI rose to 2.5 percent from October 2017 to October 2018, compared to 2.0 percent
from October 2016 to October 2017.
Chart 22: CPI Annual Percentage Change
Consumer Price Index - Percentage Change From Year Earlier
8%
Miami / Ft. Lauderdale
6%
Change From Year Earlier
US South Region
4% US National
2%
0%
-2%
-4%
-6%
Oct-09 Oct-10 Oct-11 Oct-12 Oct-13 Oct-14 Oct-15 Oct-16 Oct-17 Oct-18
Source: U.S. Bureau of Labor Statistics
Components of the Miami-Fort Lauderdale Consumer Price Index for the 12 months ending October 2018
are shown in Chart 23. Increases in medical care and transportation costs continued to be the principal
drivers behind the rise in CPI inflation.
19Chart 23: Miami-Fort Lauderdale CPI Component Percentage Change
Miami - Fort Lauderdale CPI Components
12 month change ending October 2018
Medical care +10.3%
Transportation +6.8%
Other goods and services * +3.0%
Housing +2.9%
Recreation +1.2% * Other goods and
services:
Education and communication +0.5% Tobacco and smoking
products, personal care
products and services, and
Food and beverages +0.2%
miscellaneous personal
Apparel -0.9%
-14% -12% -10% -8% -6% -4% -2% 0% 2% 4% 6% 8% 10% 12% 14%
12 Month Percentage Change
Source: U.S. Bureau of Labor Statistics
Appendix
The data presented in this appendix are not released on a monthly basis. The first two charts, Charts A1
and A2, show historic population growth through 2017, as well as projections updated annually by the
state of Florida’s Office of Economic and Demographic Research, working in conjunction with the University
of Florida’s Bureau of Economic and Business Research. The second two charts, Charts A3 and A4, depict
historic measures of U.S. GDP growth rates and unemployment as well as projections by the Federal
Reserve’s Federal Open Market Committee, while Chart A5 depicts the FGCU Industry Diversification Index
for Southwest Florida and the state. Charts A3, A4, and A5 are updated quarterly.
Regional Population
From 1990 to 2017, regional population growth compounded average was 2.6 percent per year. The
compound average annual rate of growth for 1990 to 2017 was 2.8 percent in Lee County, 3.2 percent in
Collier County, 1.7 percent in Charlotte County, 2.0 percent in Glades County, and 1.6 percent in Hendry
County. The right-hand sections of Charts A1 and A2 show projected population increases from 2018 to
2045. All projected rates of increase are substantially lower than the aforementioned historic growth rates
of 1990 to 2017. Projected growth for the five-county region averages 1.3 percent per year, resulting in a
population increase of 41.8 percent from 2018 to 2045, adding over 547,000 residents and bringing the
total to 1,857,272. Lee County’s population is projected to grow an average of 1.6 percent per year, Collier
County at 1.3 percent, and Charlotte County at 0.8 percent. Hendry County’s population is projected to
grow at an average of 0.5 percent per year and Glades County at 0.6 percent per year.
20Chart A1: Coastal Counties Population, 1990 to 2045
Historic and Projected Population
Charlotte, Collier, and Lee Counties
1200
1000 Historic Projected
Population - Thousands
2045
800 2017 1,060
698
Lee 2045
600 517
1990 2017
335 357
400 Collier 2045
1990 220
2017
152 173
200
1990 Charlotte
111
0
1990 1995 2000 2005 2010 2015 2020 2025 2030 2035 2040 2045
Source: Office of Economic and Demographic Research
Chart A2: Inland Counties Population, 1990 to 2045
Historic and Projected Population
Glades and Hendry Counties
50
45 2017
39.1
40 Hendry 2045
45.2
Population - Thousands
35
30 Historic Projected
25
1990
2045
20 25.8 2017 15.5
13.1
15 1990
7.6
10
5 Glades
0
1990 1995 2000 2005 2010 2015 2020 2025 2030 2035 2040 2045
Source: Office of Economic and Demographic Research
21National GDP and Unemployment
Charts A3 and A4 depict both historical trends and the Federal Open Market Committee’s projections for
national Gross Domestic Product (“GDP”) and Unemployment. The FOMC’s projections are released
quarterly and reflect the assessments of the Federal Reserve Board of Governors and of Federal Reserve
District Bank presidents, with the most recent figures shown in the following charts. The dotted lines depict
the highest and lowest projections—or the range of all projections—while the darker blue area within the
dotted lines depict the central tendency forecast within those projections.
Chart A3 shows the recovery in GDP growth following the most recent recession, and current projections
close to the normal long-run trend (“LR”). Real GDP growth rates are based on the change from the fourth
quarter of one year to the fourth quarter of the next year.
GDP growth for 2017 measured 2.25 percent (rounded up to 2.3 percent below), which is an increase from
the 1.5 measured in 2016, but a decline from 2.9 measured in 2015. The overall high and low projections
(shown as ranges below and denoted by the dotted lines) for 2018, 2019, 2020, 2021 and the long run,
were almost unchanged when compared to the projections made in June 2018, including sentiment that
the economy will slow in 2020. If the central tendency projection of economic growth at 3.2 percent for
2018 proves correct, it will mark the first annual reading of U.S. GDP above 3 percent since 2005. Although
growth projections fall thereafter, they show slightly more optimism for 2019 in the current report than it
did in the June report. Long-run growth rates of 3 percent GDP are generally associated with an economy
operating with a full employment of resources.
The current economic expansion recently became the second-longest recorded in the last 150 years. If it
continues past the summer of 2019, then the current expansion will be the longest one observed over that
time period.
Chart A3: Historic and Projected GDP Growth, 2007 to Long Run
U.S. Growth of Real GDP
4.0
2.9
3.0 2.5 2.6
2.2 2.3
1.8 1.7
2.0 1.6 1.5
1.0
Percentage
0.0 -0.3
-1.0
-2.0
-2.8 Range
-3.0
Central Tendency
-4.0
Source: Historical data obtained from Bureau of Economic Analysis. Projected data obtained from Federal Reserve Open
Market Committee Meeting Statement, September 26, 2018.
22Chart A4 depicts the decline in unemployment following the 2008 recession to levels, beginning in 2016,
more closely associated with natural rates of unemployment. Compared to these national numbers,
unemployment rates in Florida and Southwest Florida tend to be more volatile, falling lower when national
unemployment is falling and rising higher when national unemployment is rising.
As projected in previous quarters, the September 2018 forecast suggests a range that falls slightly through
2019 and then starts to rise, although below the 4 percent unemployment level through 2020. The average
central tendency forecasts through 2021 equal 3.6 percent, signifying no change from the previous
quarter’s average. The projected increases in unemployment after 2021 may reflect the mainstream
consensus that the economy will be slowing or otherwise in the midst of a market correction around that
time.
Chart A4: Historic and Projected Unemployment, 2006 to Long Run
U.S. Unemployment Rate
11.0
Range
9.6 Central Tendency
10.0
9.3
9.0 8.7
8.1
8.0
Percentage
7.3
7.0 6.9
6.2
5.8
6.0
5.3
4.9
5.0
4.4
4.0
3.0
Source: Historical data obtained from Bureau of Economic Analysis. Projected data obtained from Federal Reserve Open
Market Committee Meeting Statement, September 26, 2018.
The next quarterly release of projections for GDP and Unemployment will be released following the FOMC
meeting scheduled in December 2018. These projections will be updated in the January 2019 edition of
Regional Economic Indicators.
Industry Diversification Index
The FGCU Industry Diversification Index (IDI) measures the degree to which a region’s workforce is
concentrated in few industries or dispersed into many. The IDI is computed quarterly by the Regional
Economic Research Institute’s Industry Diversification Project, which tracks industry diversification by
Metropolitan Statistical Area, workforce region, and state. (For more details, please go to
lutgert.fgcu.edu/IDI).
23The IDI can be between 0 and 10, with a higher index denoting a more diverse workforce and a lower one
denoting a less diverse workforce. Industry diversification is an important factor explaining our state and
region’s tendency to overheat during expansions in the business cycle and overcorrect during contractions
in the business cycle.
Chart A5 shows the industry diversification index for the Southwest Florida workforce region and the state
of Florida. Southwest Florida shows an increase in industry diversification from the fourth quarter of 2006
to the 3rd quarter of 2008. After 2008, the Southwest Florida workforce region exhibits a seasonal trend,
mainly due to the stronger influence of tourism and seasonal residents that visit Southwest Florida during
the winter season, increasing the demand for retail trade and accommodation and food service jobs.
During the first quarter of 2018, the IDI for Southwest Florida measured at 8.44, ranking it as the 9th most
industrially diverse workforce region in the state of Florida (out of 24). Meanwhile, the state of Florida had
an IDI of 8.60, ranking Florida as the 20th highest state in the nation in industry diversification, although
below the national average of 8.64.
Chart A5: Industry Diversification Index, 2000 to 2018
Source: lutgert.fgcu.edu/IDP
24You can also read