What's next for the commodities stories? - First State Investments

Page created by Sarah Chandler
 
CONTINUE READING
What's next for the commodities stories? - First State Investments
What’s next for the commodities stories?

                        Joanne Warner     Head of Global Resources
                        Renzo Casarotto   Senior Portfolio Manager
What's next for the commodities stories? - First State Investments
What’s happened in resources
What's next for the commodities stories? - First State Investments
Is it over for resources?

Source: http://www.theaustralian.com.au/business/markets/stocks-down-as-resources-companies-tumble/story-e6frg916-1226623371985
http://money.msn.com/investing/commodities-crash-recession-looms
http://finance.ninemsn.com.au/newsbusiness/motley/8644071/asx-climbs-but-leaves-resources-behind
http://www.news.com.au/business/markets/resources-companies-to-weigh-on-asx/story-e6frfm30-1226620458088
http://economictimes.indiatimes.com/markets/commodities/copper-weakens-in-futures-trade-global-cues-subdued-demand/articleshow/19675158.cms   3
What's next for the commodities stories? - First State Investments
Is this the GFC - Mark II?

MSCI sector performance YTD (Rebased to 100)

  120

  110

  100

    90

    80

    70
     Dec 12        Jan 13         Jan 13    Feb 13      Feb 13     Mar 13   Mar 13     Apr 13       Apr 13      May 13   May 13
                         MSCI World Index                                    MSCI World Energy Sector Index
                         MSCI World Metals & Mining Index                    MSCI World Health Care Index
                         MSCI World Financials Index                         MSCI World Information Technology Index
                         MSCI World Consumer Discretionary Index             MSCI World Consumer Staples Index
                         MSCI World Telecom Service Sector Index

Source: Bloomberg. 31 May 2013.                                                                                                   4
What's next for the commodities stories? - First State Investments
Chinese GDP - it’s the absolute numbers that count

   GDP growth year              on year
              13.0%
              12.0%
              11.0%
              10.0%
               9.0%
               8.0%
               7.0%
               6.0%
               5.0%
                      1998 1999 2000 2001 2002 2003 2004 2005 2006 2007 2008 2009 2010 2011 2012

   GDP ($US              bn)
              9,000
              8,000
              7,000
              6,000
      $Usbn

              5,000
              4,000
              3,000
              2,000
              1,000
                  -
                        1998 1999 2000 2001 2002 2003 2004 2005 2006 2007 2008 2009 2010 2011 2012

Source: Bloomberg , May 2013 & CLSA April 2013.                                                      5
What's next for the commodities stories? - First State Investments
It’s the absolute numbers that count

              Chinese oil consumption (million bbls/d)
                           12.0
                           11.0
                           10.0
                            9.0
                            8.0
                            7.0
                            6.0
                              Jan-07   Jan-08    Jan-09       Jan-10         Jan-11     Jan-12     Jan-13

              Crude oil processed + net product imports
                              m bpd
                           11.0
                           10.0                                                                                Note the continual
                            9.0                                                                                increase y-y,
                            8.0                                                                                despite a notional
                            7.0                                                                                slow down in
                            6.0                                                                                growth rates
                            5.0
                                Jan Feb    Mar   Apr    May   Jun      Jul    Aug     Sep   Oct    Nov   Dec
                                          2009         2010     2011            2012        2013

Source: CLSA April 2013.                                                                                                            6
What's next for the commodities stories? - First State Investments
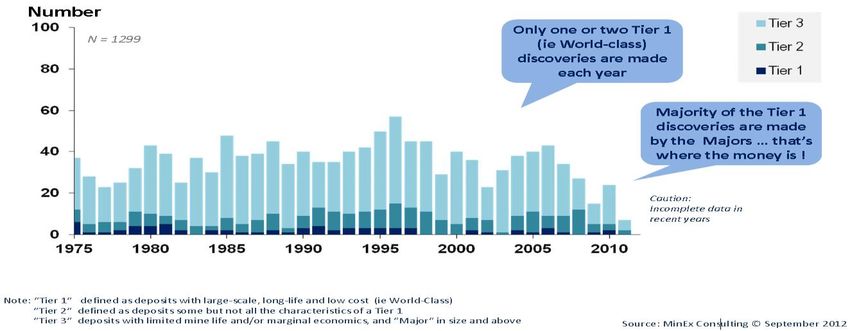
China’s current five year plan requires more infrastructure

    80

    70

    60

    50

    40

    30

    20

    10

      0
                      Railway                             Highway               Oil/Gas Pipe          Airports
                  (thousand km)                     (ten of thousand km)       (thousand km)        (number of)
                                               Previous five year plan     Current five year plan

Source: Standard Chartered Resources, April 2013.                                                                 7
What's next for the commodities stories? - First State Investments
US Housing construction ‘upside’

                                                                                                    Listed for sale homes per house hold
 • Housing inventories at long term lows
 • Vacancy rates nearing 2003 levels
 • Construction jobs steady but hours up

          Homeowner vacancy rate (%)                                                                US rental vacancy rate (%)

Source: Bloomberg; US Census Bureau; Stifel Nicolaus report, financial institutions, housing economics
market commentary. As at December 19, 2012.                                                                                                8
What's next for the commodities stories? - First State Investments
A progressive dividend policy, scope to increase

BHP - Annual dividend (1990-2012), 11.4% CAGR                                                                             BHP - Dividend Payout Ratio (1990-2012)
 1.4
                                                                                                                           3.0
 1.2
                                                                                                                           2.5
 1.0
                                                                                                                           2.0
 0.8
 0.6                                                                                                                       1.5
 0.4                                                                                                                       1.0
 0.2                                                                                                                       0.5
 0.0                                                                                                                       0.0
       Jan-90

                Jan-92

                         Jan-94

                                  Jan-96

                                           Jan-98

                                                    Jan-00

                                                             Jan-02

                                                                      Jan-04

                                                                               Jan-06

                                                                                        Jan-08

                                                                                                 Jan-10

                                                                                                          Jan-12

                                                                                                                                 Jan-90

                                                                                                                                          Jan-92

                                                                                                                                                   Jan-94

                                                                                                                                                            Jan-96

                                                                                                                                                                      Jan-98

                                                                                                                                                                               Jan-00

                                                                                                                                                                                        Jan-02

                                                                                                                                                                                                 Jan-04

                                                                                                                                                                                                            Jan-06

                                                                                                                                                                                                                     Jan-08

                                                                                                                                                                                                                              Jan-10

                                                                                                                                                                                                                                       Jan-12
                                                         DPS                                                                                                         average                     payout

 RIO - Annual dividend (1996-2012), 7.4% CAGR                                                                              RIO - Dividend Payout Ratio (1996-2012)
 2.5                                                                                                                       0.7
 2.0                                                                                                                       0.6
                                                                                                                           0.5
 1.5                                                                                                                       0.4
 1.0                                                                                                                       0.3
                                                                                                                           0.2
 0.5                                                                                                                       0.1
 0.0                                                                                                                         0

                                                                                                                                 Apr-00

                                                                                                                                 Apr-05

                                                                                                                                 Apr-10
                                                                                                                                 Oct-97

                                                                                                                                 Feb-01

                                                                                                                                 Oct-02

                                                                                                                                 Feb-06

                                                                                                                                 Oct-07

                                                                                                                                 Feb-11

                                                                                                                                 Oct-12
                                                                                                                                 Dec-96

                                                                                                                                 Aug-98

                                                                                                                                 Dec-01

                                                                                                                                 Aug-03

                                                                                                                                 Dec-06

                                                                                                                                 Aug-08

                                                                                                                                 Dec-11
                                                                                                                                 Jun-99

                                                                                                                                 Jun-04

                                                                                                                                 Jun-09
       Oct-98

       Apr-04

       Oct-09
       May-03
        Jul-01

       Mar-05
       Feb-06

        Jul-12
       Dec-96
       Nov-97

       Sep-99
       Aug-00

       Dec-07
       Nov-08

       Sep-10
       Aug-11
       Jun-02

       Jan-07

                                                                                                                                                                     ave payout                           payout
                                                       DPS
                                                                                                                   Prior to 1995, Rio was operating as two independent businesses CRA and RTZ.
                                                                                                                   In 2005 a $1.45ps ($1.15ps adjusted) special dividend was declared.
                                                                                                                   In 2009 no interim dividend was declared.
Source; Goldman Sachs.                                                                                                                                                                                                                          9
What's next for the commodities stories? - First State Investments
Where to from here?
Iron ore – is the world too bearish?

                                                                             China's Iron Ore Imports vs Spot Iron Ore Price

                                                                        80                                                        250
                                                                        70
                                                                                                                                  200
                                                                        60

                                                       Million tonnes

                                                                                                                                        US$/tonne
                                                                        50                                                        150
                                                                        40
                                                                        30                                                        100

                                                                        20
                                                                                                                                  50
                                                                        10
                                                                         0                                        0
                                                                          2006 2007 2008 2009 2010 2011 2012 2013
                                                                             China's Iron Ore Imports, Mt      Spot Iron Ore, US$/t (RHS)

Source: Morgan Stanley Research, CRU. February 2013.                    Source: Source: Bloomberg. May 2013.                                        11
Iron ore – why would BHP and RIO talk the price down?

                                          140

                                          120
    cash cost of production (US$/t fob)

                                          100

                                                                                                                          China
                                           80
                                                                   Australia

                                                                                                  Brazil
                                           60

                                           40

                                           20

                                            0
                                                0          300                 600              900               1,200             1,500        1,800

                                                                                     cumulative production (Mt)
                                                    2013 cash cost curve               50th centile                       75th centile
                                                    90th centile                       spot (fines) 3-Jun-13              LT (incentive) price

Source: Metalytics. June 2013.                                                                                                                           12
So where’s the supply?

  Exploration spend by commodity: 1998-2012                                               Number of deposits found – by quality

    Copper: most of the metal in a handful of deposits

                                                                                      • Exploration spend has increased dramatically
                                                                                        • But why do we keep looking for gold??

                                                                                      • Success rates have declined

                                                                                      • More than half of deposits are being found in high-
                                                                                        political risk locations
                                                                                      • On average it takes 12-18 years from discovery to
                                                                                        first production
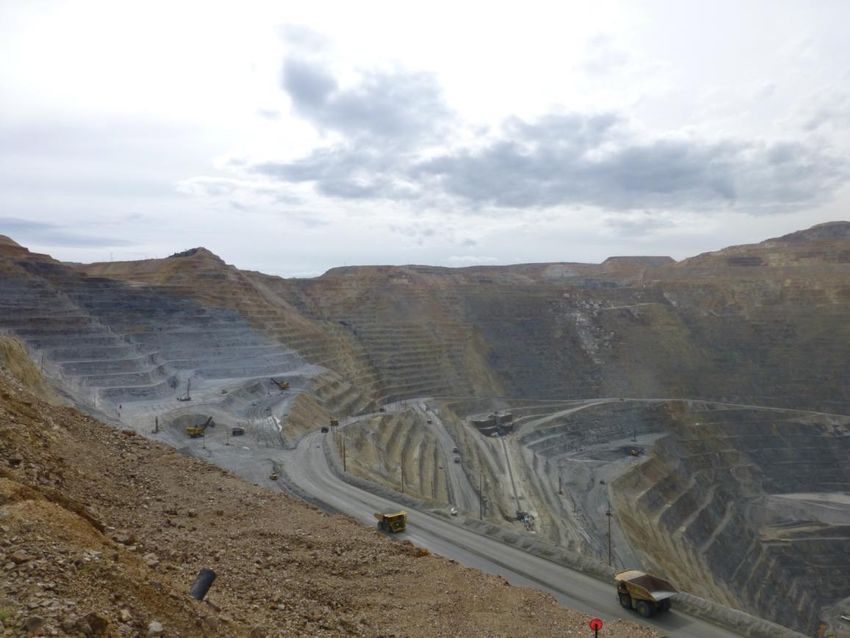
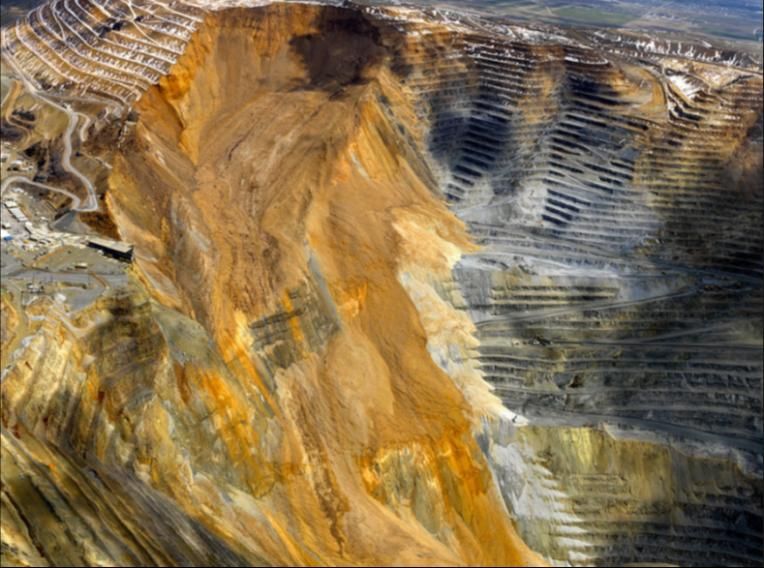
Source: MinEx Consulting – presentation to BBY Resources Conference, November 2012.                                                           13
Copper: Bingham Canyon – before the pit-wall failure…

Source: First State Investment, as at September 2012.   14
And after the pit wall failure April 10, 2013

 • Still unknown how much production will be
   lost, but early estimates are 100-150kt Cu
     • NB: pre-incident estimates were for an
       over-supply in the Cu market of ~150kt
       this year

 • Cost? Equipment alone could be $100m

Source: First State Investments. Rio Tinto May 2013.   15
Valuations – but is it cheap?
Mining vs MSCI World (P/E 2013 F1)

                                                                           P/E FY1
30.0

                                                        HSBC Mining                  MSCI World (MXWO Index)
25.0

20.0

15.0

10.0

 5.0

 0.0
   Jun-02        Jun-03        Jun-04        Jun-05           Jun-06      Jun-07        Jun-08      Jun-09     Jun-10   Jun-11   Jun-12

                                         Historical and Mean P/E FY1 Ratio (Index 1/Index 2) Relative Valuation

1.80                                                          Mean +/- 1.96 Standard Deviations

1.60
1.40
1.20
1.00
0.80
0.60
0.40
0.20
0.00
   Jun-02        Jun-03        Jun-04        Jun-05           Jun-06      Jun-07        Jun-08      Jun-09     Jun-10   Jun-11   Jun-12
Source: Nomura Custom Products Group – data to 31 May 2013.                                                                               16
Valuations – but is it cheap?
Energy vs MSCI World (P/E 2013 F1)

                                                                      P/E FY1
25.0
                                                     MSCI Energy (MXWO0EN Index)              MSCI World (MXWO Index)
20.0

15.0

10.0

 5.0

 0.0
   Jun-02      Jun-03        Jun-04       Jun-05        Jun-06        Jun-07        Jun-08        Jun-09       Jun-10    Jun-11    Jun-12

                                           Historical and Mean P/E FY1 Ratio (Index 1/Index 2) Relative Valuation
                                                              Mean +/- 1.96 Standard Deviations
 1.20

 1.00

 0.80

 0.60

 0.40

 0.20

 0.00
    Jun-02       Jun-03       Jun-04       Jun-05        Jun-06        Jun-07        Jun-08        Jun-09       Jun-10    Jun-11    Jun-12
Source: Nomura Custom Products Group – data to 31 May 2013.                                                                                  17
The resources cycle

                         Phase 1
                         Demand rises
                         Inventories decline
                         Supply response lags = higher prices
                         Governments attempt to raise taxes

                                                                Phase 2
     Phase 3                                                    High prices encourage new projects
                                                                Supply response = demand
     Supply is curtailed
                                                                Inventories rise = prices fall
     Demand normalises
                                                                Capital expenditure is reduced
     Producers benefit from recovery

                                                                                                     18
What about agribusiness?
Agriculture: hitting the headlines

http://news.nationalgeographic.com/news/2013/13/130412-drought-great-plains-weather-environment/
http://www.reuters.com/article/2012/11/29/usa-drought-idUSL1E8MT5H220121129
http://www.merredinmercury.com.au/story/1433588/hundreds-of-people-gather-for-agriculture-crisis-meeting-in-merredin/?cs=1478
http://www.treehugger.com/climate-change/us-drought-going-get-worse.html
http://www.agriculture.com/news/crops/wld-crop-wear-wries-abound_2-ar31103                                                      20
Strong EM wages growth to drive consumption

                                    China wages growth                                                                   Brazil wages growth

                                                                                     Brazil average monthly wage (BRL)
                           45,000

                           40,000
China average wage (RMB)

                           35,000

                           30,000

                           25,000

                           20,000

                           15,000

                           10,000

                            5,000

                               0

Source: Ministry of Human Resources and Social Security, Nomura, data to Dec 2011.
Bloomberg, CEIC, Nomura, data to 31 May 2012.                                                                                                  21
Growing demand for soft commodities

            GROWING POPULATION &                                  CONVERGING DIETS                     INCREASED MEAT
            URBANISATION
            6.5bn to 9bn by 2050
                                                    +              40kg to 52kg by 2050
                                                                                                   =   CONSUMPTION
                                                                                                       260mt to 470mt by 2050
            70% urbanised by 2050

Source: FAO How to feed the world in 2050 report, UN World Urbanization Prospects 2009 revision.                                22
What does this mean for grain demand?

                     In 2050                     Mt meat required                    Conversion ratio   Mt grain required

                     Chicken                               274                              2                 549
                     Beef                                   70                              7                 487
                     Pork                                  101                              4                 402
                     Sheep                                  25                              4                 102
                     TOTAL                                 470                                               1,540

                mt

                                                                              +85%

Source: OECD-FAO Agricultural Outlook 2012-2021, FAO how to feed the world in 2050
report. Consumption split is 58% chicken, 15% beef, 22% pork, 5% sheep.                                                     23
Middle East, Africa, and Asia consumption rising rapidly

  World’s Food Surpluses and Deficits
  Net trade (Million tonnes)

Source: The Economist, * Cereals, rice, meals, oils and fed equivalent of meat.   24
The global food challenge…

The task:
 • Increase global food production by 70%
 • Which requires $US80 billion per annum of investment

The challenges:
 • Resource constraints (land/water)
 • Environmental pressures
 • Natural disasters
 • Productivity growth declining

Source: FAO, How to feed the world 2050 Report.           25
How can investors participate in the solution?

The solution:                           Better agronomic practises
• Increased yields                      Balanced fertilizer application
• Increased crop intensity              Improvements in innovation (i.e. seeds)
• Increased animal intensity            Infrastructure investment
• Added acreage                         Farm economies of scale

                                                                              26
Agricultural value chain

         Inputs                         Farming/                       Handling/                                       Food            Supermarkets/
                                                                                                     Processors
                                        plantation                      traders                                      companies          consumers
    •   seed                        •    farm                      •    storage                      •    oilseed    •   Nestle         •   Tesco
                                                                   •                                     crushing    •   Kellogg’s      •   Walmart
    •   fertiliser                  •    forestry/pulp                  handling
                                                                   •                                 •   biofuels    •   Kraft          •   Sainsbury
    •   machinery                   •    palm oil                       trading
                                                                   •    marketing                    •   livestock                      •   Waitrose
                                                                                                     •   paper

                     Upstream                                                      Midstream                                     Downstream

   • We invest in the upstream and midstream portion of the agricultural value chain
   • Upstream resource owners tend to make the highest margins

Reference to specific securities (if any) is included for the purpose of illustration only and should not be
construed as a recommendation to buy or sell the same.                                                                                                  27
Agricultural equity returns versus
agricultural commodity price returns

300

250
                                                                                                                                      +125%

200

150

100
                                                                                                                                      -18%

  50

   0

                              DAXglobal Agribusiness Index                         Rogers International Commodity Agriculture Index

Source: First State Investments, Bloomberg, USD from June 2005 to 30 April 2013;
standardised as at 30 June 2005.                                                                                                             28
Valuations – agriculture
Agriculture vs MSCI World (P/E 2013 F1)

Source: Nomura Custom Products Group – data to 30 April 2013.   29
Valuations – forestry
Forestry vs MSCI World (P/E 2013 F1)

  40.0

  35.0

  30.0

  25.0

  20.0

  15.0

  10.0
                            S&P Timber                MSCI World (MXWO Index)
   5.0

   0.0
     Jun-02        Jun-03       Jun-04       Jun-05           Jun-06   Jun-07   Jun-08   Jun-09   Jun-10   Jun-11   Jun-12

 2.50

 2.00

 1.50

 1.00

 0.50

 0.00
    Jun-02        Jun-03       Jun-04        Jun-05       Jun-06       Jun-07   Jun-08   Jun-09   Jun-10   Jun-11   Jun-12

Source: Nomura Custom Products Group – data to 31 May 2013.                                                                  30
Returns and volatility by equity sector

         18.0%

         16.0%

         14.0%                                                                                                                       China
                                                                                  Soft Commodity Equities
         12.0%
                                                    Consumer Staples                                                   Emerging Markets
         10.0%                                                                                                                                         Global Mining
Return

         8.0%                                            Health Care                                                     Materials
                                                                                  Consumer Discr
                                                                                                          Energy
         6.0%                                                                               Industrials
                                                     Utilities   Telecom Svc
         4.0%                  Global Bond                                             Information Tech

         2.0%                                                            Global Equities

         0.0%                                                                                                      Financials

         -2.0%
              5.0%                   10.0%                   15.0%                  20.0%                    25.0%                   30.0%                   35.0%
                                                                                    Risk
                     Global Mining                       Soft Commodity Equities            Global Equities                     Energy
                     Materials                           Industrials                        Consumer Discr                      Consumer Staples
                     Health Care                         Financials                         Information Tech                    Telecom Svc
                     Utilities                           Emerging Markets                   China                               Global Bond
Source: Data used from 01 January 2005 to 31 March 2013 in USD. Rimes; First State Investments; Global Mining: HSBC Global Mining Accumulation Index; Energy: MSCI
AC World Energy Index; Materials: MSCI AC World Materials Index; Global Equities: MSCI AC World Index; Global Agribusiness: 75% DAX Global Agribusiness Index & 25%
S&P Global Forestry & Timber Index; Emerging Markets: MSCI Emerging Markets Index. Past performance is no indication of future performance.

                                                                                                                                                                      31
Look beyond the headlines

Source: http://www.theaustralian.com.au/business/markets/stocks-down-as-resources-companies-tumble/story-e6frg916-1226623371985
http://money.msn.com/investing/commodities-crash-recession-looms
http://finance.ninemsn.com.au/newsbusiness/motley/8644071/asx-climbs-but-leaves-resources-behind
http://www.news.com.au/business/markets/resources-companies-to-weigh-on-asx/story-e6frfm30-1226620458088                                      32
http://economictimes.indiatimes.com/markets/commodities/copper-weakens-in-futures-trade-global-cues-subdued-demand/articleshow/19675158.cms
Disclaimer

Before making any investment decision based upon the information contained in this presentation, you should assess your own
position, and if appropriate, seek the assistance of a financial adviser.
The information contained within this presentation has been obtained from sources that First State Investments (“FSI”) believes to
be reliable and accurate at the time of issue but no representation or warranty, expressed or implied, is made as to the fairness,
accuracy, completeness or correctness of the information. Neither FSI, nor any of its associates, nor any director, officer or
employee accepts any liability whatsoever for any loss arising directly or indirectly from any use of this. It does not constitute
investment advice and should not be used as the basis of any investment decision, nor should it be treated as a recommendation for
any investment. The information in this presentation may not be reproduced in whole or in part without the prior consent of FSI.
This document shall only be used and/or received in accordance with the applicable laws in the relevant jurisdiction.
Please remember that the value of investments and the income from them may go down as well as up and that you may not get
back your original investment. Investment involves risks, past performance is not necessarily a guide to future performance. Due to
the nature of the funds, short-term volatility is expected and your investment should be viewed as long-term. Please refer to the
offering documents for details, including the risk factors.
Reference to specific securities (if any) is included for the purpose of illustration only and should not be construed as a
recommendation to buy or sell the same. All securities mentioned herein may or may not form part of the holdings of First State
Investments’ portfolios at a certain point in time, and the holdings may change over time.
This presentation is issued by First State Investments (Hong Kong) Limited and has not been reviewed by the Securities and
Futures Commission in Hong Kong.

                                                                                                                                  33
You can also read