Kathrein Online-Outlook - Equity investments in turbulent times Vienna, 14th of October 2020 - Kathrein Privatbank

Page created by Zachary Tyler
 
CONTINUE READING
Kathrein Online-Outlook - Equity investments in turbulent times Vienna, 14th of October 2020 - Kathrein Privatbank
Kathrein Online-Outlook
Equity investments in turbulent times

                                        Vienna, 14th of October 2020

                                                                       1
Kathrein Online-Outlook - Equity investments in turbulent times Vienna, 14th of October 2020 - Kathrein Privatbank
2
Kathrein Online-Outlook - Equity investments in turbulent times Vienna, 14th of October 2020 - Kathrein Privatbank
Market Review

                33
Kathrein Online-Outlook - Equity investments in turbulent times Vienna, 14th of October 2020 - Kathrein Privatbank
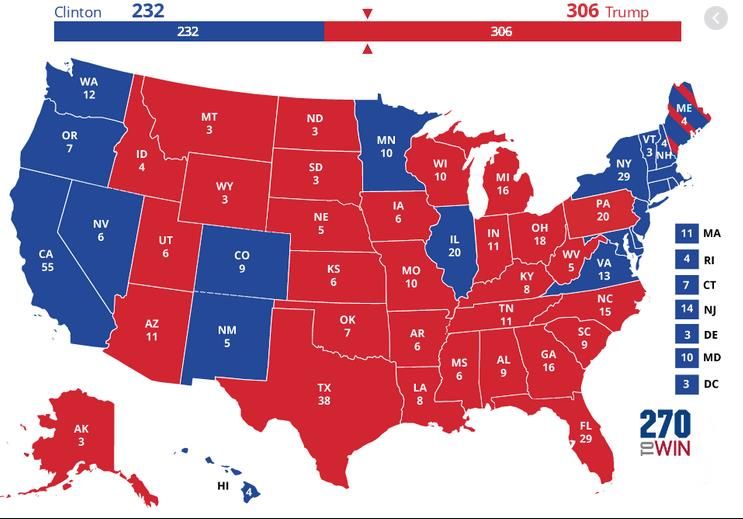
Market Development of Global Equities (in EUR)

Past performance is not a reliable indicator for future returns.

Source: Bloomberg L.P., Kathrein Privatbank                        4
Kathrein Online-Outlook - Equity investments in turbulent times Vienna, 14th of October 2020 - Kathrein Privatbank
Market Development – Bond Review

▪   Typical risk-on investments such as EUR high-yield                                           -4,1%
    bonds or EUR corporate bonds were able to achieve                  US Treasuries                                                     4,2%
    the best performance. In the search for yield, investors                                                                  1,6%
                                                                     EUR Sovereigns         Q3
    are once again increasingly switching to lower-rated but                                                                           3,7%
    higher-yielding securities, as almost 40 % of euro                                      YTD
                                                                                                                           0,4%
    government bonds currently have negative yields.         German Government Bond                                               2,7%
▪   Nevertheless, the typical risk-off investments such as
                                                                    Global Sovereigns                        -0,7%
    EUR government bonds and also German                                                                                      1,7%
    government bonds were able to post price gains
    again.                                                           EUR Corporates                                             2,0%
                                                                                                                             0,8%
▪   US government bonds recorded the largest decline in
                                                                                                                              1,6%
    euro terms. However, this was mainly due to currency EUR Inflation Linked Bonds                                    0,0%
    developments, which also affected the performance of
    USD high-yield bonds, which were only able to                      EM Corporates                       -1,7%
                                                                                                              -0,9%
    generate a marginally positive performance for euro
    investors. The USD lost around 4 % against the EUR.           EUR HY Corporates                                               2,6%
                                                                                                     -2,7%
▪   Emerging market local currency bonds posted a
    decline of around 2.5 %, with concerns about Covid 19         USD HY Corporates                                        0,2%
                                                                                                   -3,7%
    developments in developing countries weighing on the
    EM currencies, which posted a loss of 1.5 % against            EM Local Currency       -5,8%      -2,5%
    the euro.
                                                                                    -10%           -5%                0%               5%       10%
                                                              in EUR

Source: Bloomberg, Kathrein Privatbank, Data per 30.09.2020                                                                                     5
Kathrein Online-Outlook - Equity investments in turbulent times Vienna, 14th of October 2020 - Kathrein Privatbank
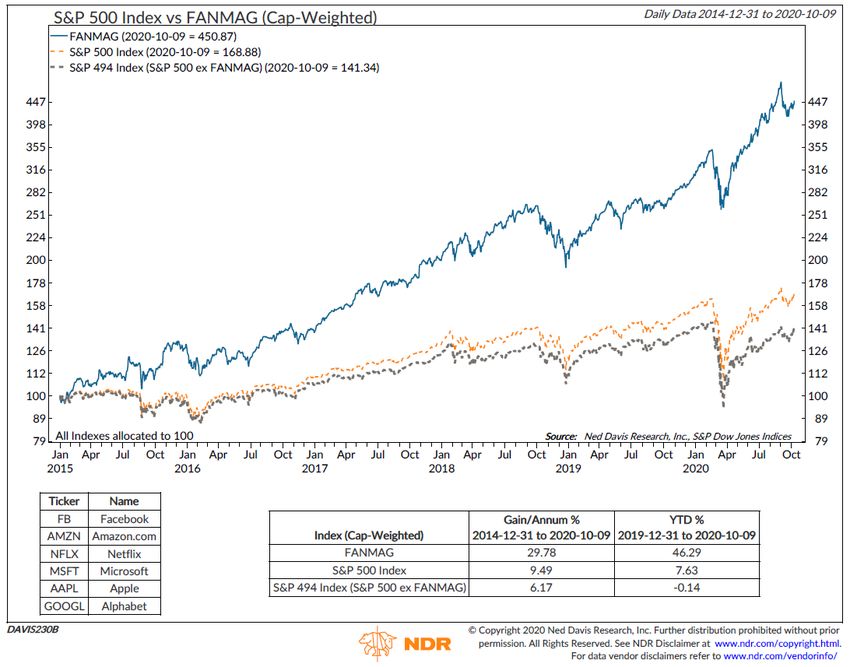
Market Development – Currencies – Review: EUR/USD

Source: Bloomberg, Kathrein Privatbank              6
Kathrein Online-Outlook - Equity investments in turbulent times Vienna, 14th of October 2020 - Kathrein Privatbank
Asset Allocation Desicions Q4 2019 – Q2 2020
Jan. 20                 Sale of US Small Caps (10 % of the US stock weighting).
Jan. 20                 Due to the dissolution of the Pfandbrief+, the weighting is shifted to the Yield+.
Mar. 20                 Sharp reduction of the equity exposure and shift to the dynamic part, due to the spread of
                        the coronavirus in Europe and the resulting risk of recession. Increase of the Global Enterprise
                        weighting within the equity quota, because more defensive stocks should perform better than the     1. Quarter 2020
                        overall market in a correction phase.
Mar. 20                 Merger of Euro Core Government Bond Fund and Euro Inflation Linked Bond Fund with Euro
                        Bond Fund.
Mar. 20                 Sell all EUR and US high yield bonds and reduce the weighting of EM government bonds in
                        local currency (-5 %) and shift into Euro government bonds, global government bonds and Euro
                        corporate bonds in order to reduce risk in the bond segment due to expected recession.

May 20                  Increase the equity component to neutral weighting and reduce the dynamic component.
                        Reduce the Global Enterprise weighting within the equity component.
                                                                                                                            2. Quarter 2020

Aug. 20                 Shift from IG corporate bonds (-8%) and EM local currency bonds (-1%) to EUR government
                        bonds (+6%), EUR HY bonds (+2%) and EM corporate bonds (+1%).
Aug. 20                 5% of the bond weighting shifted from the SPDR Bloomberg Barclays Emerging Markets Local            3. Quarter 2020
                        Bond Fund to the Kathrein Sustainable EM Local Currency Bond Fund.
Sep. 20                 10% of the equity weighting shifted into the Kathrein Sustainable Global Equity Fund, half of the
                        corporate bond weighting shifted from the Kathrein Corporate Bond Fund into the Kathrein
                        Sustainable Bond Select Fund.

Source: Kathrein Privatbank                                                                                                              7
Kathrein Online-Outlook - Equity investments in turbulent times Vienna, 14th of October 2020 - Kathrein Privatbank
Market Outlook
-   US-Election
-   Value Stocks

                   88
Kathrein Online-Outlook - Equity investments in turbulent times Vienna, 14th of October 2020 - Kathrein Privatbank
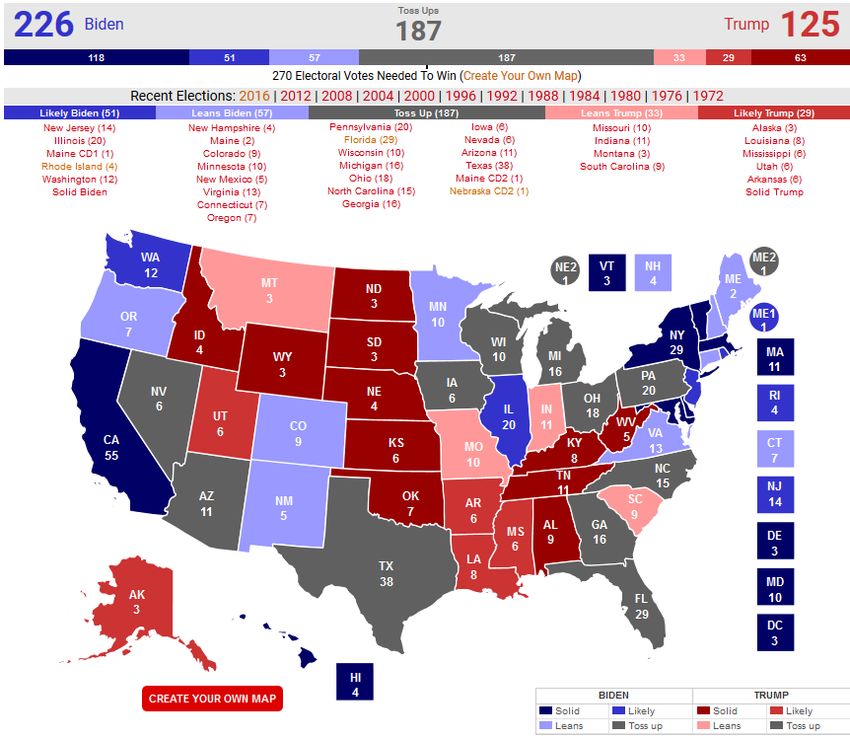
US Presidential Election: General Election Poll

 Source: realclearpolitics.com, Kathrein Privatbank   9
Kathrein Online-Outlook - Equity investments in turbulent times Vienna, 14th of October 2020 - Kathrein Privatbank
US Presidential Election: Not a popular vote election

 Source: realclearpolitics.com, Kathrein Privatbank     10
US Presidential Election: Electoral College (2016)

 Source: realclearpolitics.com, Kathrein Privatbank   11
US Presidential Election: Electoral College (2020)

 Source: realclearpolitics.com, Kathrein Privatbank   12
US Presidential Election: Electoral College (2020)
No Toss Ups

 Source: realclearpolitics.com, Kathrein Privatbank   13
US Presidential Election: Yes, but Hillary was also leading in
the polls. True, but Biden is leading by more

 Source: realclearpolitics.com, Kathrein Privatbank              14
US Presidential Election: But in battle ground states Biden
lead is smaller than Clintons

 Source: realclearpolitics.com, Kathrein Privatbank           15
US Presidential Election: Nevertheless the lead is significant,
and pollsters have indicated they have improved their methods

 Source: realclearpolitics.com, Kathrein Privatbank               16
US Presidential Election: Electoral College (2020)
Trump Wins
                                  Trump wins TX, OH, IA and swing States FL, NC, AZ (270 to win),
                                        but still needs either PA (6.3 %) or MI(-6.2%) to win

 Source: realclearpolitics.com, Kathrein Privatbank                                                 17
US Senate Election: 1/3 of Senators up for re-election every
two years

Source: realclearpolitics.com, Kathrein Privatbank             18
US House Election: Entire House is elected every
two years

                                                      232   197

 Source: realclearpolitics.com, Kathrein Privatbank               19
Thank you very much for your attention!
Questions?

                                          20
Development of Value Stocks

                               21
                              21
Russell 1000 Value vs. Russell 1000

           Russell 1000                                                                                                                              Value stocks are
                                                                                                                                                     attractively valued
           Russell 1000 Value                                                                                                                        companies, i.e. stocks
                                                                                                                                                     with an attractive
                                                                                                                                                     price/book value ratio.

                                                                                                                                                     The 1000 largest US
                                                                                                                                                     stocks last had a
                                                                                                                                                     comparably high
       Log-Scaled                                                                                                                                    relative performance
                                                                                                                                                     (=outperformance) to
                    Relative Performance Russell 1000 Value vs. Russell 1000                                                                         value stocks in 2000.
                             Value stocks better in downward phases
            Russell 1000 Value/Russell 1000                                                                                                          The main reason is the
                                                                                                                                                     performance of a
                                                                                                                                                     handful of mega-cap
                                                                                                                                                     growth stocks.

The Russell 1000 Index consists of the largest 1000 companies in the Russell 3000 Index. The Russell 1000 Value Index measures the performance of those Russell 1000 companies
with lower price-to-book ratios and lower forecasted growth values.

Source: Bloomberg, Kathrein Privatbank                                                                                                                                           22
US Equities - Concentration

                                                   The share of the S&P 500
                        S&P 500 Index              market capitalization of the
                                                   top 20 companies increased
                                                   from 28% to 38% in the last
                                                   5 years.

                                                   Weak growth and flat/inverse
                                                   yield curves advantageous
                                                   for growth stocks.
          Market share of top 20 stocks as %
          of total S&P 500 market capitalisation   Growth stocks are stocks
                                                   where above-average
                                                   growth rates in sales,
                                                   profits and investments are
                                                   expected.

Source: Bloomberg, Kathrein Privatbank                                            23
US Equities - Concentration
                                                              Facebook
          FANMAG market capitalization on the
          total S&P 500 market capitalization
                                                              Apple
                                                              Netflix
                                                              Microsoft
                                                              Amazon
                                                              Google (Alphabet)
           Share of FANMAG profits in total S&P 500 profits   The share of the S&P 500
                                                              market capitalization of
                                                              the FANMAG companies
                                                              increased from about 5%
                                                              to almost 20% in the last
                                                              10 years.

                                                              The share of profits of the
                                                              large FANMAG titles is also
                                                              increasing steadily.

Source: Bloomberg, Kathrein Privatbank                                                      24
US Equities Performance and Movement

                                                                    FANMAG

                                                                        S&P 500 Index

                                                  S&P 500 exkl. FANMAG

      Index (marketcap weighted)            Performance p.a.       Performance % year to date   Without FANMAG
                                         31.12.2014 – 09.10.2020                                companies, the S&P 500
      FANMAG                                    29.79 %                     46.29 %             would have been in the
      S&P 500 Index                              9.49 %                     7.63 %              red since the beginning
      S&P 500 exkl. FANMAG                       6.17 %                     -0.14 %             of the year

Source: Bloomberg, Kathrein Privatbank                                                                                    25
US Equities Performance and Movement

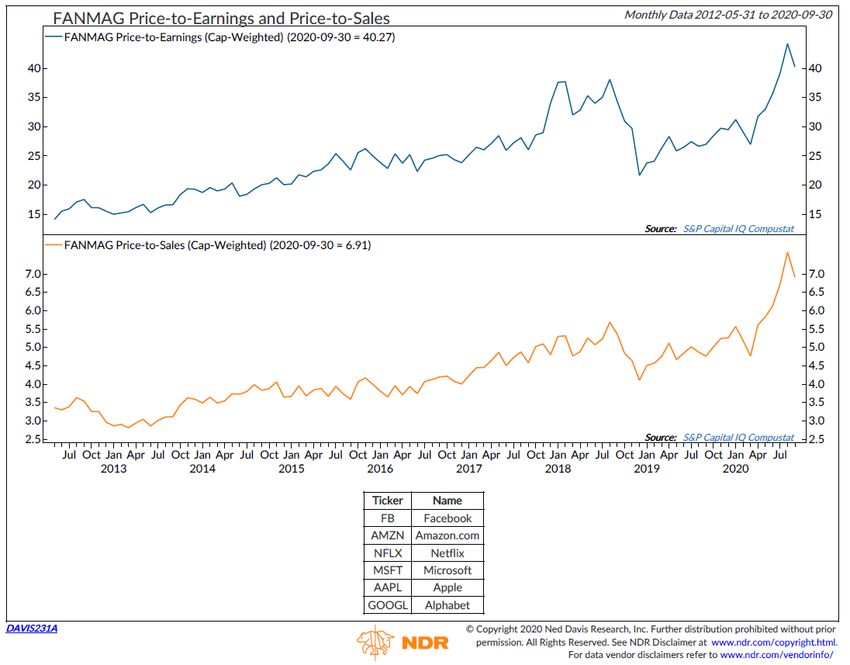
                        FANMAG Price-Earnings-Ratio
                                                                    Strong increase in
                                                                    valuation ratios (more
                                                                    expensive than ever
                                                                    before).

                                                                    Comparison history is,
                                         FANMAG Price-Sales-Ratio
                                                                    however, short.

Source: Bloomberg, Kathrein Privatbank                                                       26
Russell 1000 Value vs. Russell 1000
 Periods in which Value performed better and worse.
                                                                                                                       Value worse than market                  29
                                                                                                                       Value better than market                 28
                                                                                                                       Max. Duration of Outperformance          30
                                                                                                                       Max. Duration of Underperformance        38
                                                                                                                       Avg. Duration of Outperformance           7
                                                                                                                       Avg. Duration of Underperformance        10
                                                                               Similar development as in 2000, Value
                                                                               had clearly outperformed in the years
                                                                                            after 2000.                Value worse than market                  12
                                                                                                                       Value better than market                 11
                                                                                                                       Max. Duration of Outperformance          84
                                                                                                                       Max. Duration of Underperformance        63
                                                                                                                       Avg. Duration of Outperformance          17
                                                                                                                       Avg. Duration of Underperformance        23

                                                                                                                       Value worse than market                  12
                                                                                                                       Value better than market                 11
                                                                                                                       Max. Duration of Outperformance          95
                                                                                                                       Max. Duration of Underperformance        86
                                                                                                                       Avg. Duration of Outperformance          14
                                                                                                                       Avg. Duration of Underperformance        24

Data: Performance over rolling 12, 36, 60 month periods, Source: Bloomberg, Kathrein Privatbank                                                            27
Sector weight in value and market capitalization index

                                                                    MSCI World Value Index   MSCI World Index   Differenz
                                           Information Technology                   7.68%             22.10%     -14.42%
                                           Consumer Discretionary                   8.17%             11.83%      -3.66%
                                           Communication Services                   7.15%              8.85%      -1.70%
                                           Health Care                             12.70%             13.75%      -1.05%
                                           Real Estate                              3.91%              2.80%       1.11%
                                           Materials                                5.59%              4.47%       1.12%
                                           Consumer Staples                         9.69%              8.22%       1.47%
                                           Industrials                             12.35%             10.38%       1.97%
                                           Energy                                   5.05%              2.48%       2.57%
                                           Utilities                                6.62%              3.25%       3.37%
                                           Financials                              21.09%             11.86%       9.23%

Source: MSCI, Kathrein Privatbank per 30.9.2020                                                                             28
Divdend payers cheap vs. Non-Payers

                                                   ▪ So-called "bond proxies" also
                                                     tend towards value. E.g.
                                                     Utilities, Real Estate and
                                                     Consumer Staples.
                                                   ▪ As interest rates are likely to
                                                     remain low, investors are
                                                     turning to dividend stocks as
                                                     yield alternatives. Bond
                                                     proxies could be a bright spot

                                           Cheap
                                                     within the value universe as the
                                                     bull market matures.

                                   2000-
                                   2002

Source: NDR, Kathrein Privatbank                                                        29
Kathrein Global Enterprise: Fund Concept and Goals

T: AT0000A0Y0Z3
A: AT0000A0Y0Y6

▪ Investment in globally attractively valued companies, which are selected according to predefined
  criteria.
▪ The selection approach is based on portfolio management theory and the long-term research of
  Benjamin Graham and David Dodd (Value Investing).Titles with a poor DEFEX score are excluded.
▪ In the course of the ongoing selection and optimization process, those stocks are selected which
  show the least fluctuation in portfolio optimization.
▪ Due to the long-term investment approach, shifts within the portfolio are kept low, thus reducing
  costs (transaction costs).

                                                                                                      30
Investment Process and Implementation

                  ▪ Investment universe: world                      ▪ Selection of leading global companies from a universe
                     stocks (around 1600 titles)                      of around 1600 stocks
                                                                    ▪ Selection of companies using the following selection
               DEFEX                                    DPS           criteria:
                                EPS                  Last 10 Yrs.
                              Last 10 Yrs.                                −   Sustainable generation of profits over the last 10 years
                                                                              (EPS)

                              Interest                                    −   Continuous dividend payments over the last 10 years
                               cover                                          (DPS)
                                current

                                                                          −   Attractive ratio between operating profit and interest
                                             1. Selection step                expenses (interest coverage ratio)

                                                                          −   Attractive DEFEX Score
            Valuation of selected shares based
                     on intrinsic value                             ▪ Evaluation of the relative attractiveness of all
                                             2. Selection step        companies selected in the first step based on their
                                                                      intrinsic value.

                Selection and Optimisation of                       ▪ 30 of the most attractive companies are selected and
                      about 30 Equities                               optimized for the fund in a final step. The aim of the
                    (Minimum Variance Portfolio)                      optimization is to reduce the risk of fluctuation.

Source: Kathrein Privatbank                                                                                                              31
Performance GEP vs. Global Equities

                                                                                         Value stocks (shown here in the form of the
                                                                                         World Value Index and the Societé General
                                                                                         (SG) Quality Index) have underperformed the
                                                                                         broader market in recent years.

                                                                                         The difference in performance between the
                                                                                         World Value Index and the World Index is at its
                                                                                         highest level since the fund was launched.

                                                                                         In the medium term we expect the two indices
                                                                                         to converge again and outperform Value
                                                                                         Shares vs. the World stocks.

       Performance Difference: Kathrein Global Enterprise – Global Equities

                                                                                         Maximum temp. losses:
       Performance Difference: Kathrein Global Enterprise – Global Equities              World equities:                      -33.6%
                                                                                         World equities Value:                -36.4%
                                                                                         Global Quallity Income:              -33.6%
                                                                                         Kathrein Global Enterprise:          -25.9%
Source: Bloomberg, Kathrein Privatbank. Daily Data from 15.3.2013 to 9.10.2020 in EUR.                                                  32
Kathrein Global Enterprise in Loss Phases

                                                                                            The equity portfolio has
                                                                                            historically been more stable
                                                                                            than global equities in
                                                                                            corrections (< -10%) and bear
                                                                                            markets (
GEP Valuation

                                                                                              Price-book ratio
        Kathrein Globale Enterprise                                        World stocks

                                        World stocks                              Kathrein Globale Enterprise

                                   Price-earnings ratio                          The dividend yield of the Kathrein Global
                    World stocks
                                                                                 Enterprise Fund is significantly higher than that of
                                                                                 the world share index.

                 Kathrein Globale Enterprise                                     Valuations (price-book ratio and price-earnings
                                                                                 ratio - P/E ratio) of the Kathrein Global Enterprise
                                                                                 Fund are continuously more attractive than those of
                                                                                 world stocks.

Source: Wilshire. Kathrein Privatbank. Data from 31.12.2013 to 22.9.2020                                                                34
Summary

▪ The market development is still liquidity driven.
▪ No interest rate increases have been priced into the market for the coming years.
▪ The valuations of value stocks (P/E, P/B, dividends) have remained stable, while the key figures of the MSCI
  World are currently above pre-crisis levels.
▪ Valuation differences between value stocks and the global stock market, as in the current market situation, have
  always been balanced in the past.
▪ The relative performance/valuation differences are currently at about the same level as in 2000.
▪ As a rule, investors flocked to stable growth stocks when the earnings growth of the S&P 500 was slower than a year
  ago.
▪ Value tended to outperform growth when economic growth accelerated.
▪ As earnings recover from their COVID collapse, conditions for Value should be favorable. However, the recovery
  should be long-term.
▪ Continued low interest rates make "bond proxies" within Value stocks appear attractive.

                                                                                                                        35
Thank you very much for your attention!
Questions?

                                          36
Disclaimer
Diese Unterlage ist eine Marketingmitteilung im Sinne des Wertpapieraufsichtsgesetzes (WAG) und dient ausschließlich Ihrer Information. Diese Information unterliegt daher nicht den Vorschriften des
Wertpapieraufsichtsgesetzes, die für die Verbreitung von Finanzanalysen vorgesehen sind.

Obwohl wir der Meinung sind, dass die für diese Mitteilung herangezogenen Quellen von dritten Anbietern verlässlich sind, können wir keine Haftung für Vollständigkeit, Richtigkeit und Aktualität der hier wieder
gegebenen Informationen übernehmen.

Die Analysen und Schlussfolgerungen sind genereller Natur und berücksichtigen daher nicht die individuellen Bedürfnisse der Anleger hinsichtlich der Ertragsziele und der Risikobereitschaft. Der Inhalt dieser
Unterlage ist nicht rechtsverbindlich und stellt keine Handlungsempfehlung und kein Angebot zum Kauf oder Verkauf von Wertpapieren oder sonstigen Finanzinstrumenten dar. Eine Investitionsentscheidung
bezüglich aller Wertpapiere oder sonstiger Finanzinstrumente sollte nur auf Grundlage eines Beratungsgespräches und nicht allein auf Basis dieser Marketingmitteilung erfolgen.

Performance-Hinweis
Die Wertentwicklung der Vergangenheit lässt keine verlässlichen Rückschlüsse auf die zukünftige Entwicklung einer Veranlagung zu. Sämtliche dargestellte Performancezahlen nach OeKB-Methode entsprechen
einer Nettoperformance, d.h. Kosten wie Verwaltungs-Gebühren oder sonstige dem Fondsvermögen angelastete Kosten werden bereits berücksichtigt. Nicht berücksichtigt wird ein möglicher Ausgabeaufschlag oder
Rücknahmeabschlag oder Steuerabgaben wie Kapitalertragssteuer oder Quellensteuern. Diese wirken sich bei Berücksichtigung in Abhängigkeit der konkreten Höhe entsprechend mindernd auf die Wertentwicklung
aus. Wir weisen darauf hin, dass für Anleger mit anderer Heimatwährung als der Fondswährung, die Rendite infolge von Währungsschwankungen steigen oder fallen kann. Es ist zu beachten, dass Investments in
Fonds neben Chancen auch Risiken bergen, so können Wert und Ertrag steigen, aber auch fallen.

Kathrein Privatbank Aktiengesellschaft erbringt keine Steuerberatung und übernimmt keine Haftung für eventuelle steuerliche Nachteile im Zusammenhang mit Wertpapiertransaktionen und Wertpapierveranlagungen
ihrer Kunden. Die Besteuerung der Kapitaleinkünfte hängt von den persönlichen Verhältnissen des Anlegers ab und kann künftigen Änderungen unterworfen sein..

Simulierte künftige Erträge sind somit kein verlässlicher Indikator für die tatsächliche künftige Wertentwicklung einer Veranlagung. Allfällige in dieser Unterlage enthaltene Simulationsrechnungen beruhen nicht auf
tatsächlichen Transaktionen, sondern rein auf historischen Daten.

Prospekthinweis
Die jeweils gültigen und veröffentlichten Prospekte bzw. Informationen gegenüber Anlegern nach § 21 AIFMG sowie die Kundeninformationsdokumente (Wesentliche Anlegerinformationen - KID) der von Kathrein
Privatbank Aktiengesellschaft verwalteten Fonds stehen Ihnen in deutscher Sprache kostenlos auf der Website www.rcm.at und/oder www.kathrein.at sowie bei der Kathrein Privatbank Aktiengesellschaft zur
Verfügung.

Offenlegungspflichten nach § 25 Mediengesetz
Die Angaben nach § 25 Mediengesetz (MedienG) finden sich im Impressum auf unserer Homepage: http://www.kathrein.at

Jede Form der Veröffentlichung oder Weitergabe ist untersagt.
© Kathrein Privatbank Aktiengesellschaft, Wipplingerstraße 25, 1010 Wien, Handelsgericht Wien, FN 144838y

                                                                                                                                                                                                                         37
You can also read