How to use SAS system to filter stock for trade - SAS Support
←
→
Page content transcription
If your browser does not render page correctly, please read the page content below
Paper 340-2017
                    How to use SAS® system to filter stock for trade
                                Brian Shen, Merlin Clinical Service LLC

ABSTRACT
Investors usually trade stocks or exchange-traded funds (ETFs) based on a methodology, such as a theory,
a model or a specific chart pattern1,2. There are more than 10,000+ stocks/ETFs listed on the stock
market. Picking the right one at the right moment based on a methodology from so many candidates is
usually a big challenge. This paper presents the methodology on how to accomplish such task based on
the CANSLIM3 theorem and momentum trading (MT) theorem4. With a high-speed computer (64G-128G
memory), one scan and plot from 8,000 stocks might take 2-4 minutes if your programming logic is
efficient.
We have heard of Cup-n-Handle shape (CnH), Double/Multiple bottoms (DB/MB), support/resist lines
(SRL), market direction (MD), fundamental analyses (FA) and technical analyses (TA). Those were all
covered in CANSLIM theorem. MT is a trading theorem based on stock moving direction or momentum.
Both theorems are easy to learn but difficult to apply without an appropriate tool. The brokers' application
system usually could not provide such filtering due to its complicity. For example, for CnH, where is the
handle? For the MB, where is the last bottom you should trade?
Now, the challenge task could be accomplished through SAS. This paper presents the methods on how to
apply those logics and graphically present them though SAS5.

INTRODUCTION
SAS Software extends the horizon for investors who are interested to obtain useful information on stock
trading based on a methodology described in CANSLIM and MT to make quick decisions and obtain better
financial results. CANSLIM is a growth stock investment strategy written by William J. O'Neil based on FA
and TA. For details of the theorem you can reference Mr. O’Neil’ book3. MT is the most important theorem
which consider the stock momentum, the pivotal support and resist point. The MT is important because
quite a lot auto-trading systems are set based on MT theorem.
Many institutions, like FINVIZ.com, Yahoo Finance and Google Finance also provide stock chart and basic
studies, but it is very time consuming to go through them one by one without an ideal graphical
presentation. Sometimes, we want to add some criteria based on our own model, which could not be
accomplished from broker’s application system and other open sources like yahoo finance.
This paper presents logics used on stock filtering, and methods to present them. It’s crucial for financial
organizations or individual investors to have such knowledge to help them take quick decision. Usually,
the earlier you see the pattern, the better edge and higher returns you can get compared with your
competitors.
SAS software and internet access are required for the running the program/package. You need
advanced level SAS and stock TA and FA knowledge to understand the programming logic and the
trading strategies.
This paper includes the business and technical concepts, ideas, tips, and strategies. Examples for
understanding the theorems and some programing logics are provided. Due to the scope of
knowledge involved, only a set of important TAs plus their programming techniques are presented,
you are welcome to contact the author for more detailed information.

OBJECTIVE
Analyses on big data are the gold mine for next generation, one important example for such analysis is
on financial market. If you treat an individual stock as boat, overall market is just like an ocean. No
matter how strong a boat is built, it is difficult to survive in the ocean Tsunami. This is why CANSLIM
theorem focuses on Market Direction (MD) first, then financial sectors (FS), and individual stocks
finally.

                                                      1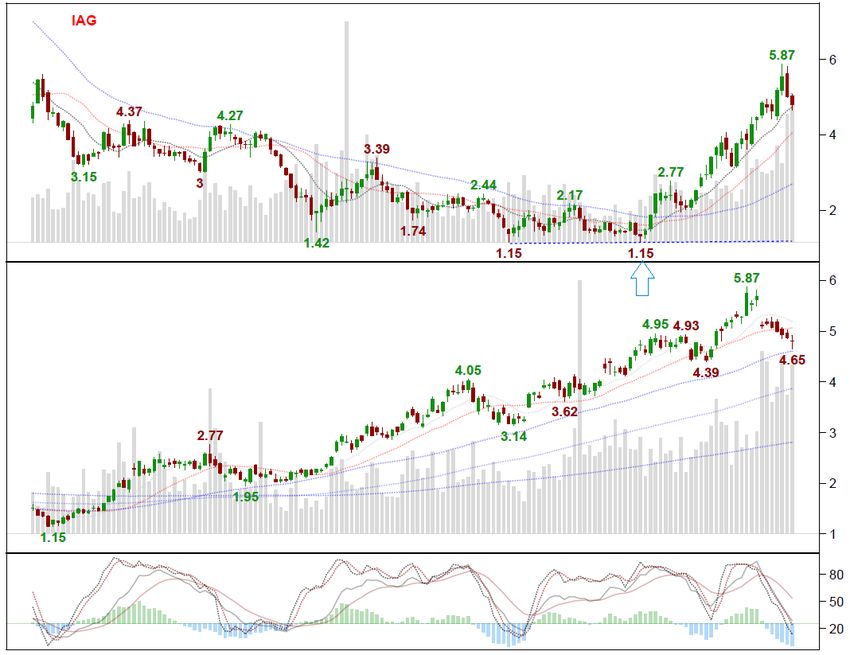
Statistically, the technical analyses on market/sector are the same as analyses on individual stocks. The
paper mainly focuses on individual stocks as examples. TA programming and graphical presentations are
provided. Once you find a stock satisfying TA, you will then perform FA analyses, which will significantly
reduce your research time. Sometimes for short-term investment, TA is much more important than FA.
The readers need to understand the risk managements for better returns, like stop loss/profit taking,
diversification, etc. Sector ETFs which follow better on TA are recommended based on simulation data as:
GLD (Gold), VDE (Energy), DIA (Dow Jones) and SPY (S&P), you need to perform similar simulation to
pick the right ETF for all other sectors.
This paper introduces some general ideas on how to collect the data and program some useful
technique studies used for stock filtering and analyses.
HOW TO GET THE REAL TIME AND HISTORICAL MARKETING DATA
The real time and historical stock daily data can be obtained from the Yahoo finance server, as the
following example provided for Disney stock.
Filename realtime url
"http://download.finance.yahoo.com/d/quotes.csv?s=DIS&f=sl1d1t1pohgvs7e7&e=
.csv";
data realtimedata;
length symbol
$15.; format date
date7.;
infile realtime dsd end=eof;
input symbol : $15. close date1 : $10. time: $7. pclose open high
low volume;
date = input(date1, ??mmddyy10.);
run;
Filename realtime clear;
filename History url "http://ichart.finance.yahoo.com/table.csv?s=DIS"
debug;
data HistoricalData(keep=date open low high close volume);
infile History dlm=',' firstobs=2 obs=8888;
input date yymmdd10. Open High Low Close Volume AdjClose;
format date date7. volume 12.0;
run;
filename History clear;
Data MarketData(keep=symbol date high low open close volume);
set realtimedata HistoricalData;
symbol = 'DIS';
run;
MARKET DIRECTION (MD)
Market Direction (MD) can usually be obtained by analyzing overall economic data, major index, selected
sector ETFs and leading stocks. The leading stocks can change over time. You can select top 50 highly
traded stocks on weekly basis.
FILTERING CRITERIA BASED ON THE TA STUDIES
Most stocks will form a flat bottom, which could be DB or MB, based on the shape of the bottom. The
bottom might be caused by the criteria set in the auto-trading system and the stop loss set by investors.
The bottom can last for a long period of time, like several months or even years. After the second bottom
on weekly chart, the stocks satisfying the pattern usually have more than 25% increase before correction
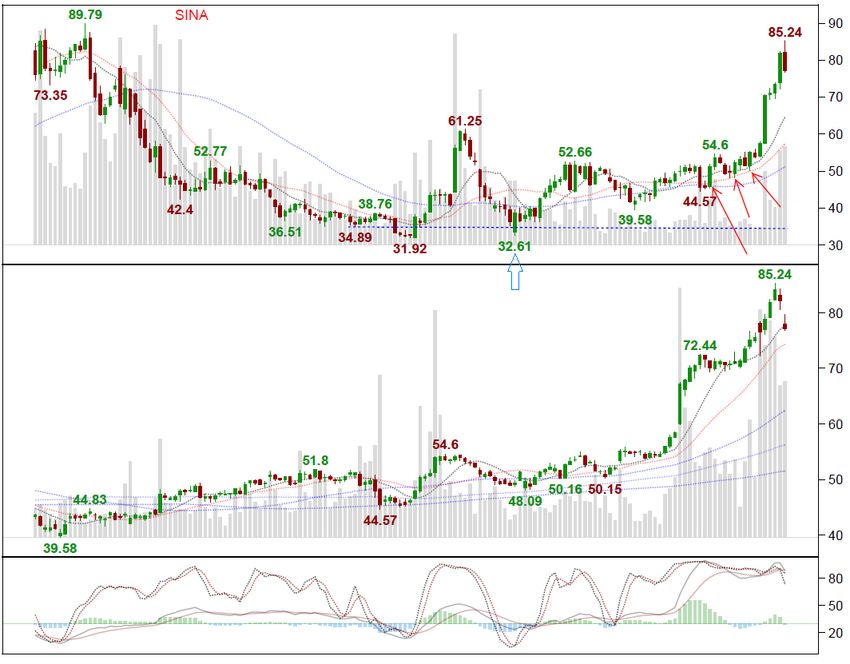
if the bottoms are real. Then the stock will fluctuate along both sides of Middle Bollinger band (MBB)6 with
volatility damping to minimum before launching off, like SINA (Figure 1), Some have just one correction to
2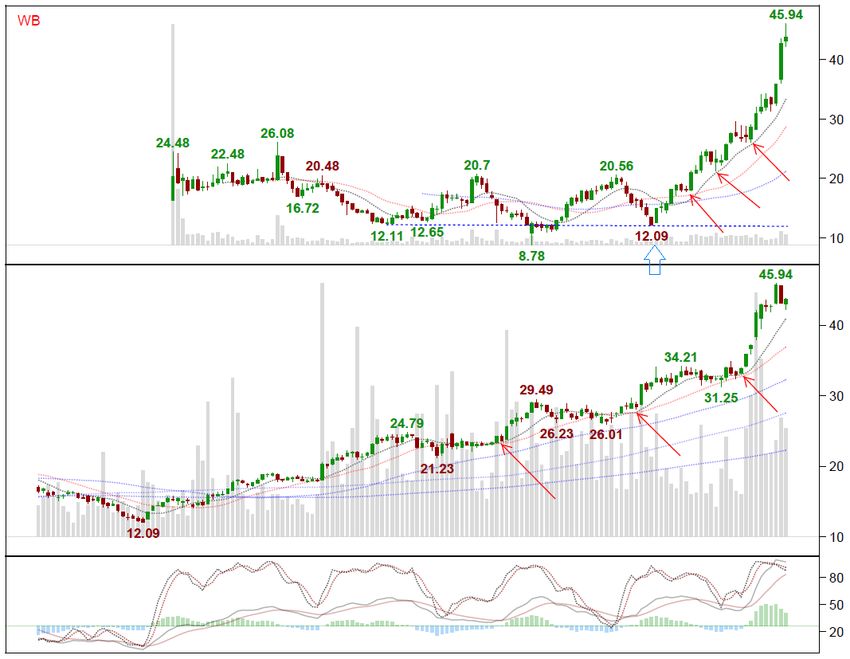
touch MBB before launching off, like WB (Figure 2). Usually, for middle term or short term investment,
buying at those critical points will make considerable returns.
Since the bottom might be faked or take considerable duration to launch off, it is not a very smart choice
to invest at bottom to get the “fastest” return. A wrong judgement might also cost you a fortune. If you
want to invest at this point, you have to take the overall Market Direction (MD)/Sector Direction (SD) into
consideration. Usually, when the bottoms happen at the same time as market bottom or Sector bottom,
the stock is much safer to invest and more considerable returns you might get. Especially for stocks less
than 10 dollars, sometimes you will get 5-10 folds returns within a year, like IAG (Figure 3), with the
second bottom (low = 1.15$) happened at the same time as the gold future bottom and S&P index
bottom.

Figure 1. Volatility damping to minimum before launching off (SINA)

Figure 2 One correction only to touch weekly MBB before launching off (WB)

                                                      3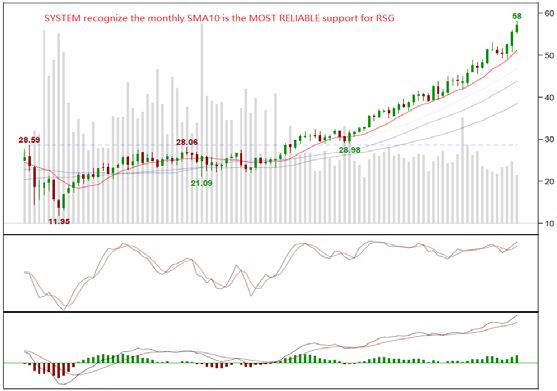
Figure 3 Bottoms happened at the same time as the Bottoms of gold future and S&P index

Based on simulation on data of 20 years on top 500 stocks, the best trading time frame is usually before
the market close for the trading period, for example, at daily market close for short term investment (in
days) and at weekly market close for middle term investment (in weeks). Filtering based on interim daily
or weekly data might yield unexpected results and increase the error rate, which is probably because
most trading by institutions happens at market close, like mutual funds which are combinations of
individual stocks.
Stocks satisfying the following logic are tradable.
1)      Stocks with minimum volatility in the ascending trend:
When the volatility is damping to a minimum range, the stock often has the pattern that the weekly
ranges is becoming minimum and move up above the top side of MBB with accelerating slope. Most
brokers’ applications have volatility parameter provided for each stocks or market index. Statistically,
fitting two LOESS curves by using local highs and local lows to observe if the two curves converge
working better
than the traditional volatility parameter, since the traditional one is highly affected by outliers. LOESS
curves will help to smooth the outliers. Please also be aware that, smoothing out outliers does not mean
the outlier is not important. Sometimes, the outliers of a stock or index provide very useful information on
future directions.
2)       Triple or multiple bottoms with long period of time (could be in months or years), with the
weekly MBB changing from down-trend to an approximate flat or slightly upward trend. Buying at those
points with appropriate stop-loss protection (2-3% below the lowest bottom price), might provide you a
multiple folder returns. For stocks below 10 dollars, if the bottom happening at the same time as market
or sector bottom, with 2-3% stop loss set below the lowest bottom, the win-lose odds might be a few
hundred to 1. The issue is it is very difficult to find such cases, which proves the systematical scanning
is important.
3)       Except that you are very confident that the company has a bright future in long run, do not
trade stocks with down trend, which means the slope of MBB is negative on weekly chart or monthly
chart.
4)      For short term, a stock with the daily/weekly high close to any resist line (linear SRL, daily
SMA100, Daily SMA200, etc.) should not be longed. Such stocks might break though, but you must
be patient to wait until the stock breaks all resist lines. A rush based on wrong judgement might cost
you 25+% loss due to stock correction.
                                                      4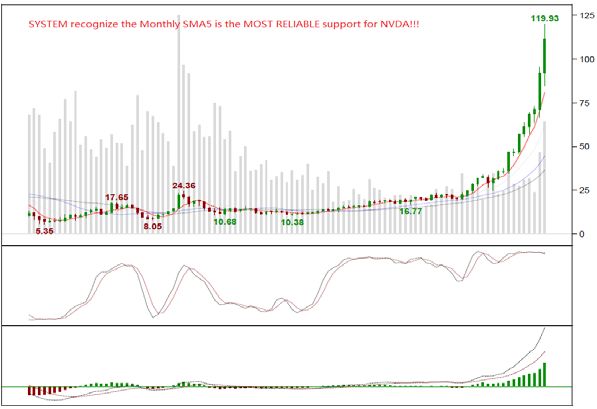
5)      Linear SRL works better for the third and fourth touches. You also need to consider overall
 trend and local patterns (like local double tops) to make better decisions.

 6)      Stocks with 5-6 supports on Monthly, weekly and daily with big volume, and without any resist,
 might jump up big in a short period of time, those stocks are very rare. Once scanned out, you can
 make invest and the chance to lose money is tiny if the market direction is also up (Figure 4).

 7)       Always find the most reliable support though simulation and trade based on it. The most
 reliable support could be SMA, EMA, linear support, ichimoku could, etc. You can use programming
 logic to figure out which support is the most reliable one. For examples, the monthly SMA5 for NVDA
 was recognized as most reliable support by the system (Figure 5), while the monthly SMA10 was
 recognized for RSG (Figure 6).

 8)      Only scan and trade stocks satisfying right-hand side rule, which means stocks with bullish
 signs, for example, after stock hit multiple support lines and rebound. Good traders always do
 something after they see something right.

 Figure 4 Stock with 10 supports (rare case) as indicated

Figure 5 Month SMA5 as most reliable support

                                                     5
Figure 6 Monthly SMA10 as most reliable support
PROGRAM ON SELECTED TA STUDIES WITH GRAPHICAL PRESENTATION
There are many TAs covered in graphical presentations using Graph Template Language (GTL). Due
to word limit, only a few are provided here. The MarketData is sorted ascendingly. All codes should be
run within macro. SAS LOESS code for converge checking, graphic annotations on local highs and
lows, support/resist line auto-annotations (Figure 8) (or manual correction on support/resist lines), right
hand trading rule filtering, volatility calculation, filtering on stocks satisfying MBB, etc., covered in the
overall package, but not presented in this paper.
SIMPLE MOVING AVERAGE (SMA100 AS EXAMPLE)
SMA100 = round((close %do j = 1 %to 99; + lag&j(close) %end;)/100, 0.0001);
EMA12, EMA26, MACD AND SIGNAL
SEQ = _N_;
SMA11 = round((close %do j = 1 %to 10; + lag&j(close) %end;)/11,
0.00001); SMA25 = round((close %do j = 1 %to 24; + lag&j(close)
%end;)/25, 0.00001); IF SEQ = 11 then EMA12 = SMA11;
IF SEQ = 25 then EMA26 = SMA25;
lagClose = lag(Close);
%DO SEQ = 12 %TO 500;
lagEMA12 = lag(EMA12);
IF SEQ = &SEQ. then EMA12 = lagEMA12 + (CLOSE - lagEMA12)*2/10;
%END;
%DO SEQ = 26 %TO 500;
lagEMA26 = lag(EMA26);
IF SEQ = &SEQ. then EMA26 = lagEMA26 + (CLOSE - lagEMA26)*2/20;
%END;
MACD = EMA12 - EMA26;
SEQ1 = SEQ -24;
SMA8 = round((MACD %do j = 1 %to 7; + lag&j(MACD) %end;)/8,
0.00001); IF SEQ1 = 8 then SIGNAL = SMA8;
lagMACD = lag(MACD);
%DO SEQ1 = 9 %TO 476;
lagSignal = lag(Signal);
IF SEQ1 = &SEQ1. then Signal = lagSignal + (MACD - lagSignal)*2/10;
%END;
6ICHIMOKU CLOUD7
Data Ichimoku;set
MarketData; by date;
high9 = max(%do j = 2 %to 9; lag&j(high), %end;
lag(high)); low9 = min(%do j = 2 %to 9;
lag&j(low), %end; lag(low));
high26 = max(%do j = 2 %to 26; lag&j(high), %end; lag(high));
low26 = min(%do j = 2 %to 26; lag&j(low), %end; lag(low));
high52 = max(%do j = 2 %to 52; lag&j(high), %end; lag(high));
low52 = min(%do j = 2 %to 52; lag&j(low), %end; lag(low));
Tenkan_sen = (high9 + low9)/2;
Kijun_Sen = (high26 + low26)/2;
spanA = lag26(Tenkan_sen+Kijun_Sen)/2;
spanB = lag26(High52 + low52)/2;
run;
BOLLINGER BAND6
Data BollingerBand; set MarketData;
by date;
seq = _n_;
MA20 = round((close %do j=1 %to 19; + lag&j(close) %end;)/20, 0.01);
STD = STD(%do j = 1 %to 19; lag&j(Close), %end; Close);
Upper = round(MA20 + 1.96*STD, 0.001);
Lower = round(MA20 - 1.96*STD, 0.001);
if seqFigure 7 Daily plot with ICHIMOKU Cloud and MACD/Histogram/SINGAL
Figure 8 System auto-annotation on support and resist lines
CONCLUSIONS
With a few examples, I have shown the general idea on how to program the most important TAs and how
to filter the ideal stocks satisfying the correct patterns. The SAS system could be used by financial
institutions or individual investors to provide more valuable information in timely manner. SAS has
extensive tools to help investors organize, analyze and present the data. It can also predict short term or
long term market direction based on the analyses on index, sector ETFs and leading stocks.
8REFERENCE
1. Kiselev, S.A. and Phillips, Andy and Gabitov, I, July 2000, “Long scale evolution of a nonlinear
stochastic dynamic system for modeling market price bubbles”, Physics Letter A, no.272: 130-
142.
2. Pan, Heping, “Multilevel Stochastic Dynamic Process Models and Possible Applications in
Global Financial Market Analysis and Surveillance”, JCIS-2006 Proceedings, ISSN: 1951-
6851, October, 2006.
3. O'Neil, William J., May 23, 2002, “How to Make Money in Stocks: A Winning System in Good
Times or Bad”, 3rd Edition, ISBN 0-07-137361-6.
4. Balvers, R. and Wu, Y., 2006. “Momentum and Mean Reversion across National Equity Markets”,
Journal of Empirical Finance 13, 24-48.
5. Shen, Brian, October 2012, “Systematically Reordering Axis Major Tick Values in SAS Graph”,
PharmaSUG, Beijing, China
6. Claassen, Matthew, July/August 2004, “Bollinger bands: using volatility”, the technique analyst.
7. Linton, David, March 2010, “Cloud Charts: Trading Success with the Ichimoku Technique”, ISBN-
13: 978-0956517104
ACKNOWLEDGMENTS
Brian Shen is the owner of Merlin Clinical Service, which provides general service on statistical analyses
and SAS programming for pharmaceutical companies, and also provides consulting service on
stock/finance market. Before Merlin Clinical Service, Brian was associate director for PPD and built and
directed the SAS programming team for Merck and PPD full service partnership (FSP) office in Asia.
Brian won the silver medal in China national math Olympic qualification exam in 1989 and holds dual
master degrees majoring in structural engineering and applied mathematics. He has self- studied most
courses on market finance.
RECOMMENDED READING
All SAS users, especially those who work directly on capital market business, can benefit reading this
document to achieve their investment goals. Many of those programming logics can also be adopted in
future SAS finance package provided for clients.
CONTACT INFORMATION
Your comments and questions are valued and encouraged. Contact the author at:
Name Brian Shen
Company Merlin Clinical Service LLC
Phone 301-978-7647
Email Brian.Shen2017@gmail.com
SAS and all other SAS Institute Inc. product or service names are registered trademarks or trademarks of
SAS Institute Inc. in the USA and other countries. ® indicates USA registration.
Other brand and product names are trademarks of their respective companies.
9You can also read