Q1-2018 Review and Commentary - Convergence Long/Short Strategies
←
→
Page content transcription
If your browser does not render page correctly, please read the page content below
Convergence Long/Short Strategies
Q1-2018 Review and Commentary
As we ended 2017, we foretold that the powerful bull market might slow as the countervailing
forces of global central bank tightening and U.S. Corporate Tax relief collide. We mentioned, and
still believe that despite this slowing, the global expansion should continue. What we did not
see was the inflation scare from a wage acceleration data point, and the massive uptick in tariff
and protectionist talk. These two events, along with a large dose of “tech wreck,” ratcheted up
market volatility and rattled complacent owners of tech companies that for many years could
“do no wrong.” We believe that as the trade talks mature with China, a reasonable compromise
will be worked out. Although interest rates are on an upward path, they remain low from a
long-term perspective and inflation appears contained. These higher rates may slow mortgage
refinancing, but with strong fiscal stimulus and a reduced regulatory environment, business
activity remains favorable. More importantly, small business optimism has remained elevated for
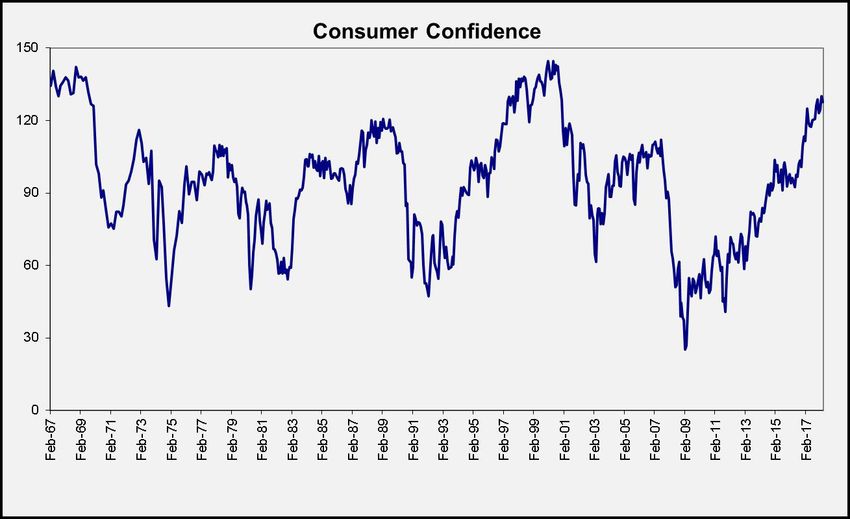
the last 5 quarters¹, and consumer confidence has been trending upward for nearly a decade
as shown in the chart below. Growth of the overall economy continues to trend upward as
GDP, housing, and manufacturing measures remain solid as shown in the following charts.
*
All Charts Sourced: Convergence Investment Partners, Bloomberg Finance L.P
Convergence Investment Partners, LLC | 1245 Cheyenne Ave. Suite 102, Grafton, WI 53024 www.investcip.com
Page 1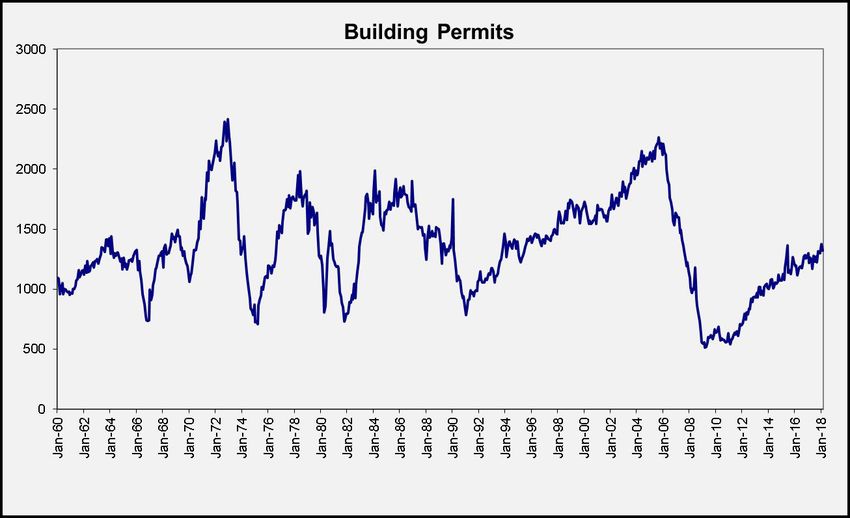
Convergence Investment Partners

    We believe that increased volatility and intra-stock dispersion should allow shrewd and
    discerning market participants who invest in fundamentally sound companies with strong growth
    characteristics, to add notable alpha for their clients. Moreover, the market movement can create
    opportunities for investors who take positions against (short) companies that exhibit poor and/
    or deteriorating fundamentals. As always, the Convergence guiding mission is to stay focused on
    long-term returns and identify companies that present opportunities based on their underlying
    fundamentals. We believe that successful investing is based on consistently executing on a sound
    and validated process. At Convergence our strategies are built on the premise that over the long
    run, companies with strong and improving fundamentals tend to win, while companies with weak or
    declining fundamentals tend to lose.

    Again, as always, stay fundamental.

    Overview of performance
    In the first quarter of 2018, the equity markets took a pause from their upward charge. Inflation
    worries, tariff threats and tech revaluations all served to temper U.S. stock returns with most major
    indices ending the three months largely unchanged.
    Much like the U.S. equity markets, the Convergence Long/Short strategies delivered “largely
    unchanged” returns to start 2018. Our large cap focused Core Plus Strategy slightly outperformed
    its Russell 3000 Index benchmark; our Market Neutral Strategy delivered a strong positive 1.87%
    return while our Small Cap Strategy slightly trailed the Russell 2000 Index for the quarter. The
    fundamentally favorable trends that began mid-year 2017 continued with the strong results we
    witnessed in January, however, they took a pause in February and March, especially in the small cap
    space.
    On an absolute basis, our longest running Core Plus Strategy delivered 15.45% for the twelve months
    ending 3/31/2018, and since inception (12/31/2009), this strategy, which maintains approximately
    30-35% of capital in short positions, has delivered a 14.43% average annual return. Our next longest
    running strategy, the Small Cap Strategy, returned 10.41% in the most recent 12 months. This small
    cap focused portfolio, which has maintained a short position of 35-45% of invested capital, has
    delivered a 13.50% average annual return since its May 2012 inception. And finally, our 35 month
    old Market Neutral Strategy delivered a 8.14% return in the trailing twelve months and has returned
    6.49% average annual since its May 2015 inception. This Market Neutral Strategy typically has
    approximately 100/80 as its long/short exposure, and seeks to maintain a forward looking beta of
    0.0-0.2. All of the aforementioned returns are stated net of fees as of 3/31/2018.

                                        Long/Short Strategy Performance, ended 3/31/2018
    Strategy                 % Short (of capital)       Inception               1 year     Since Inception Annualized
    Large Cap Core Plus          ~30-35%                Dec 2009               15.45%                14.43%
    Small Cap                     ~35-40%               May 2012                10.41%              13.50%
    Market Neutral                 ~80%                  May 2015                8.14%               6.49%
    Annualized Total Return presented net of fees, including reinvested dividends

Convergence Investment Partners, LLC | 1245 Cheyenne Ave. Suite 102, Grafton, WI 53024                  www.investcip.com
                                                                                                                   Page 2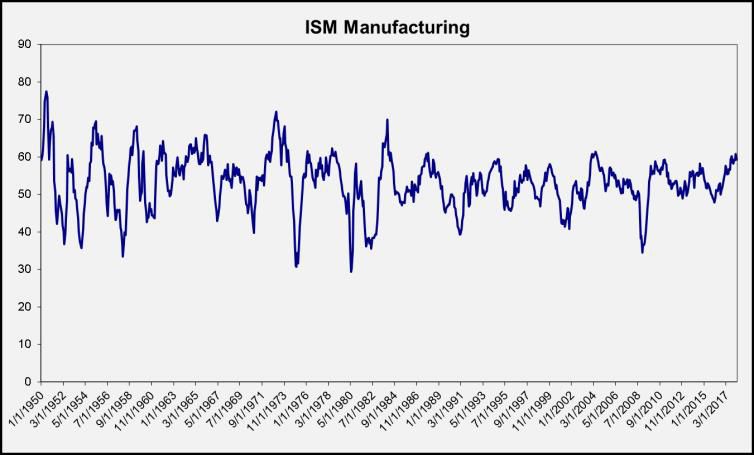
Convergence Investment Partners

    Beyond looking at the returns for each strategy in total, it is important to understand how the long
    and short sides of each portfolio performed. The spread between long and short holdings provides
    insight into how the market is rewarding/penalizing stocks based on fundamental rankings. We
    often say that our Market Neutral Strategy is the purest expression of our fundamentally biased
    investment philosophy, and the trend of months with positive long-short spread in this strategy
    tends to be unsurprisingly long. This trend took a bit of a step back in February and March of 2018,
    however, these months were not negative enough to counterbalance the powerful returns from
    January. The Market Neutral Strategy’s return spread between the long and short holdings was
    +2.3% for the quarter. Looking at the long and short sides individually, the long portfolio’s trend of
    outperforming the U.S. market has been intact since May 2017 and the short’s since August 2016.
    The Market Neutral Strategy (MN) delivered positive returns from its long positions, while the Russell
    3000 Index was negative for the quarter. The MN’s portfolio of short positions also contributed
    meaningfully to the quarter return by adding over 2%.
    In our Core Plus Strategy, the long positions delivered modest outperformance in the first quarter
    and the short positions provided a slight drag. The hedge ratio of the Core Plus Strategy (140/40)
    was the true star as it exaggerated our long outperformance and reduced the negative contribution
    of our shorts.
    Our Small Cap Strategy faced a challenging short environment to start 2018. The long positions of
    Small Cap underperformed by a few basis points while the short positions burdened performance
    by being up just over 2%, which is undesirable in a quarter where the Russell 2000 Index benchmark
    was down -0.10%. This negative long-short spread created a headwind that resulted in the Small
    Cap Strategy finishing the quarter behind its benchmark.
    The table below shows the industry groups from which each strategy had the most/least return
    contribution in the first quarter of 2018.

      Strategy                     Top Contributor(s) to Performance                  Top Detractor from Performance

      Market Neutral Long          Pharmaceuticals, Biotechnology & Life Sciences     Capital Goods
      Market Neutral Short         Real Estate                                        Software & Services
      Core Plus Long               Semiconductors & Semiconductor Equipment           Food, Beverage & Tobacco
      Core Plus Short              Food, Beverage & Tobacco                           Software & Services
                                   Capital Goods
                                   Semiconductors & Semiconductor Equipment

      Small Cap Long               Semiconductors & Semiconductor Equipment           Software & Services
      Small Cap Short              Real Estate                                        Software & Services

    The table above clearly shows that the Convergence Strategies had success selecting stocks in
    the Semiconductor and Real Estate groups in the first quarter. Conversely, our strategies lagged
    in the Software and Services group. During the second half of Q1, there was a meaningful “un-
    fundamental”² rally that occurred in a few industry groups.
    As active managers, we are hopeful that the recent months of rising stock dispersions and volatility
    represent a shift of market dynamics. As we previously highlighted, the aging bull market combined with
    rising interest rates, are resulting in higher volatility and stock dispersions. Those combined metrics tend
    to provide more opportunities for active managers like Convergence that utilize long and short positions
    to capitalize on stock dislocations.

Convergence Investment Partners, LLC | 1245 Cheyenne Ave. Suite 102, Grafton, WI 53024               www.investcip.com
                                                                                                                Page 3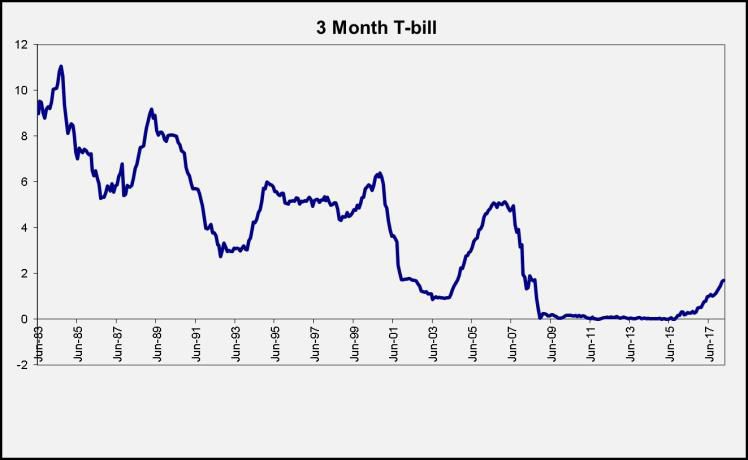
Convergence Investment Partners

    What Factors Worked?
    The following table shows our top and bottom three performing factors over different time periods.
    We ranked all 15 factor composites by quintile spread return³ in order to show that what works over
    the long term is not always true in the short term (see disclosures for a definition of quintile spread
    return).

                     3 mo            6 mo             12 mo               5 yr              10 yr           20 yr
                   Expected         Price            Price                                Traditional     Traditional
                                                                     Earnings Risk
                    Growth        Momentum         Momentum                                  Value           Value
                    Price           Earnings        Expected                                Price           Price
                                                                      Sales Growth
       Top 3

                  Momentum            Risk           Growth                                Reversal        Reversal
                                     Sales          Earnings           Earnings            Relative
                   Accruals                                                                                Low Risk
                                    Growth         Momentum           Momentum              Value

                   Relative         Relative        Traditional
                                                                       Accruals            Profits          Size
                    Value            Value             Value
       Bottom 3

                                   Traditional                          Relative          Expected         Price
                    RiskOn                          Low Risk
                                      Value                              Value             Growth        Momentum
                  Traditional                                                               Price         Expected
                                    RiskOn           RiskOn             RiskOn
                     Value                                                                Momentum         Growth

    The table below shows how the factors that we monitor and employ at Convergence Investment
    Partners performed over the 12 months ending 3/31/2018 based on long-short quintile spread
    return.

    One of our best long term factors, Traditional Value, had a rough trailing 12 months. We found
    that overvalued names outperformed undervalued names by 5.44% over this period. This is
    counterintuitive to Convergence logic, but we (like Warren Buffett) will always play the long game
    and bet on reasonably valued companies for our longs. Also, we found that lower risk companies
    (in terms of beta and historical volatility) trailed their higher risk counterparts by 5.72% in the
    trailing 12 months… again, the same principle applies.

Convergence Investment Partners, LLC | 1245 Cheyenne Ave. Suite 102, Grafton, WI 53024                 www.investcip.com
                                                                                                                  Page 4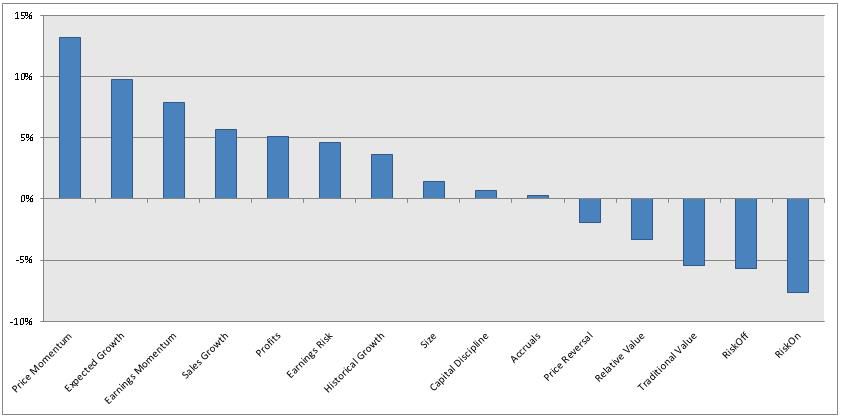
Convergence Investment Partners

     How is Convergence positioned?
     The following table illustrates a few of the many fundamental factors that we utilize to rank the
     relative attractiveness within our investment process. The values shown for each factor represent the
     weighted average value of that specific factor and the broader market overall.

                                                         LONG                           MARKET                         SHORT
    Category                 Factor            Market                            Russell 3000 Russell 2000   Market
                                               Neutral   Core Plus   Small Cap      Index        Index       Neutral   Core Plus   Small Cap

      Value             Price to Earnings       13.4       15.2        18.9         24.8         73.7         82.6      143.4       -60.1

      Value          Price to Free Cash Flow     11.2      13.4        11.5         23.3         41.1         -12.5     -22.1        -7.5

                        Free Cash Flow to
      Value                                     7.1%      6.5%        11.7%         3.9%        3.4%         -2.1%      -1.3%       -5.2%
                         Enterprise Value

   Profitability     Net Income Improvement    24.5%      17.9%      24.8%          3.1%        4.2%         0.9%       -1.4%      -10.7%

   Profitability       Cash Flow to Sales      20.3%      19.8%       21.6%        10.9%        -126%        -45.8%    -58.8%      -208.5%

   Profitability         Internal Growth       37.2%      36.6%       27.5%        15.8%        -0.6%        -20.5%    -22.2%      -26.3%

                        Change in Shares
Capital Discipline                              -0.9       -1.3        0.0           0.6         8.6          12.8       13.3       39.8
                          Outstanding

Capital Discipline      Dividend Growth         124%      150%        56%           101%         40%          52%       34%          26%

     Quality             Accruals/Assets        2.4%      2.4%         1.2%         4.5%        4.7%         13.1%      14.2%       10.5%

     Quality         Return on Assets (ROA)     7.0%      7.6%        7.2%          6.2%        -0.2%         -1.1%     -3.7%       -8.9%

                        Consecutive Qtrs
 Earnings Growth                                 2.1       1.8         2.2           1.3         0.6          0.0        -0.3        -0.7
                        Earnings Growth

 Earnings Growth        Slope of Earnings       0.18       0.14       -0.03         1.70         10.15       -0.09      -0.19       -0.29

    Cash Flow         Consecutive Qtrs Cash
                                                 1.2        1.1         1.4           1.1        0.4          0.0        -0.2        -0.6
     Growth               Flow Growth
 As of 03/31/2018; Source: Wilshire Analytics & Convergence Investment Partners.

     As the table above demonstrates, the Convergence fundamental stock selection methodology leads
     us toward holdings in the long portfolios with strong cash flow, earnings, revenues and other desirable
     financial characteristics, at reasonable valuations. Over time, companies with these qualities have
     typically rewarded investors as these are signs of healthy and growing companies with competitively
     strong business models. Separately, the Convergence process also identifies companies with weak or
     declining fundamentals demonstrated in the statistics, and our research has shown this to be effective
     in sourcing alpha from shorting.

Convergence Investment Partners, LLC | 1245 Cheyenne Ave. Suite 102, Grafton, WI 53024                                  www.investcip.com
                                                                                                                                   Page 5
Convergence Investment Partners
Disclosures
Past performance is no guarantee of future results.
Source of all factor data: Convergence Investment Partners.
No graph, chart, or formula should in and of itself be used to determine which securities to buy or sell.
This communication is limited to the dissemination of general information pertaining to Convergence Investment
Partners, LLC’s (Convergence) services and general economic market conditions. The information contained herein
is not intended to be personal legal or investment advice or a solicitation to buy or sell any security or engage in a
particular investment strategy. There is no guarantee that the views and opinions expressed in this letter will come to
pass. The views expressed do not take into account any individual personal, financial, or tax considerations. The opinions
and forecasts herein are based on information and sources of information deemed to be reliable, but Convergence
Investment Partners does not warrant the accuracy of the information that this opinion and forecast is based upon.
Opinions expressed are subject to change without notice.
Strategy returns are presented net of fees. Net of fee performance returns are presented after actual standard
management fees, actual performance-based management fees and all trading expenses. No other fees are deducted
aside from trading and management fees for the calculation of net of fee performance. Returns include the reinvestment
of income.
Convergence Investment Partners is an investment adviser registered with the Securities and Exchange Commission
and is a majority owned subsidiary of Mariner Holdings, LLC. Registration of an investment adviser does not imply any
level of skill or training. For additional information about Convergence please refer to the Investment Adviser Public
Disclosure website at www.adviserinfo.sec.gov.
The Russell 1000 Index, Russell 2000 Index and the Russell 3000 Index are measures of the performance of the largest
1000, 2000, and 3000 US companies respectively. They are constructed to provide a comprehensive, unbiased, and
stable barometer of the broad market and it is reconstituted annually to ensure new and growing equities are reflected.
Comparison to any index is for illustrative purposes only and the volatility of the benchmark may be materially different
from the volatility of the strategies due to varying degrees of diversification and/or other factors. Index performance
returns do not reflect any management fees, transaction costs, or expenses. Indices are unmanaged. You cannot invest
directly in an index.
1.The president of the National Federation of Independent Business (NFIB) was recently quoted saying, “This is the
first time in 35 years where the fewest number of small business owners have told us that taxes are their number
one business problem. They’ve been so optimistic that they feel confident enough to raise wages and invest in their
business, which grows the economy.”
2.Un-fundamental: An “un-fundamental” rally is a temporary environment where companies with strong, positive
corporate fundamentals underperform companies with weak or declining fundamentals. These periods tend to be
short in duration (days or weeks). Over the long-run, sound economic and financial principles such as profitability,
growth, valuation, capital discipline, etc. tend to work positively over time. A normal fundamental market environment
is one where positive fundamentals are rewarded, and conversely, negative fundamentals are punished.
3.Quintile spread return: The return difference between the top 20% of stocks and the bottom 20% of stocks as ranked
by a specific factor or statistic, such as Price-to-Earnings ratio or 5-year earnings growth rate.
Convergence Investment Partners, LLC | 1245 Cheyenne Ave. Suite 102, Grafton, WI 53024 www.investcip.com
Page 6You can also read