2020 Year-end Review & Outlook for 2021 - January 2021 - Bajaj Allianz Life
←
→
Page content transcription
If your browser does not render page correctly, please read the page content below

2020 Year-end Review & Outlook for 2021
January 2021

2020 – The Year That Was!

                                                                                           Economic & Market
                                                Massive monetary &
       Covid-19 lockdown                                                                    Recovery; Positive
                                                  fiscal stimulus                             Vaccine News
    • In March 2020, we witnessed the          • Global central banks &                 • With opening-up of economies,
      “Great Lockdown” across several            governments launch massive               we see a strong recovery in
      countries. India saw one of the            monetary & fiscal/economic               economic indicators.
      most stringent lock-downs                  stimulus to deal with Covid-19.        • Global markets see sharp recovery
      globally.                                • Leads to a liquidity surge in global     and some cross pre-covid levels.
    • Economic activity plunged to               markets, helping them to start         • Positive news on vaccine
      record lows.                               recovering.                              development & efficacy, although
    • Global markets (incl. India) saw a                                                  global cases continue to rise.
      sharp fall in March.                                                              • Countries start launching and
                                                                                          administering Covid-19 vaccines.

                               Greater digital adoption was a key theme due to the Covid lock-down,
                                          and we expect that to continue in coming years

2
Despite Covid-19 cases rising globally, India has seen a significant moderation
                                                                             Covid detection rate in India has come down from 12% to 2%
                         India- Covid-19 Cases Trend

    •   Globally, Covid-19 cases have been escalating (esp. in the US); Europe seeing some respite after a second wave

    •   In India, daily new cases have moderated significantly since the peak in Sep 2020, resulting in active cases coming down
        substantially and recovery rate rising to above 95%. Mortality rate has remained low in India (below 1.5%)

3          Source: Ministry of Health, ICMR, Jefferies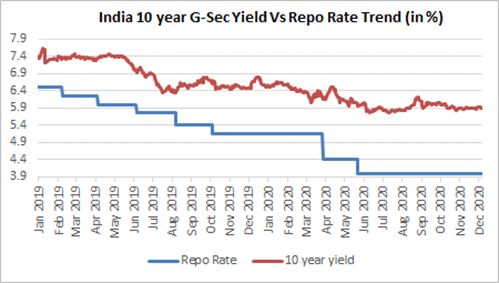
Global growth slowdown is not as sharp as feared; good recovery seen in Jul-Sep 20 Qtr

•       Sharp recovery seen in Q2 FY21 (July –Sep 20) on account of opening up of economies, post lock-downs imposed earlier

•       In India too, Q2 FY21 GDP contraction at -7.5% was better than RBI’s projection of -9.8%, and a significant recovery from a record Q1 FY21
        contraction of -23.9% (amidst one of the most stringent lock-downs globally)

    4   Source: Bloomberg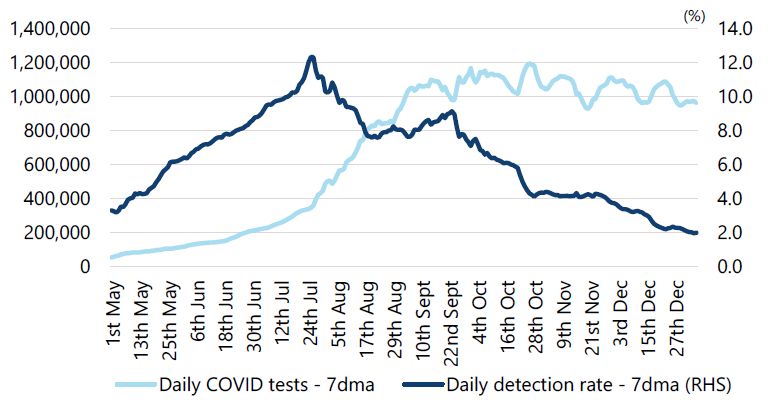
Global recession in 2020 may not be as deep as expected earlier; healthy recovery seen in 2021

                       Global GDP Growth Trend                                                                  Possible Scenarios of Global Growth

    •   World Bank projects global GDP to contract 4.3% in CY20 & grow by 4.0% in CY21. Global GDP expected to reach pre-pandemic
        level by end of 2021.

    •   Emerging markets GDP to contract by a lower 2.6% in CY20 (primarily helped by China) and grow by 5% in CY21.

5         Source: World Bank Global Economic Prospects, January 2021. EMDEs = Emerging Markets & Developing Economies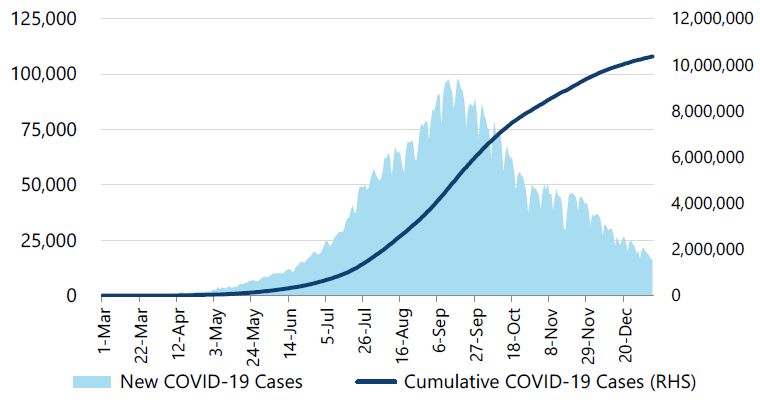
Major global central banks’ balance sheets have seen massive expansion in 2020

                            Central Bank Balance Sheet of G4* Countries - Combined (US$ in trillion)

    •   Major central banks (esp. US Fed & ECB) have gone for massive monetary stimulus, leading to a global liquidity surge

    •   G4 central bank combined balance sheet has expanded by around $9 trillion in 2020, dwarfing the expansion seen during Global
        Financial Crisis (GFC) of 2008-09.

6   Source: Bloomberg, IIFL Research. *G4 includes US Fed, ECB, Bank of England and Bank of Japan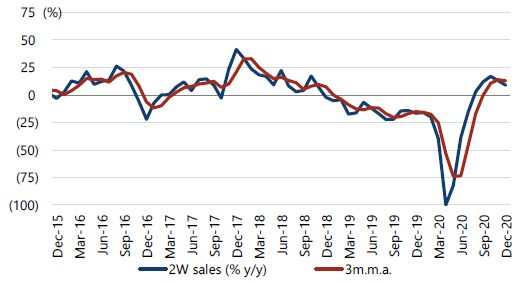
With massive Covid stimulus, government debt burden to expand

                              Government debt (as % of GDP)                                                Fiscal measures in response to Covid-19 pandemic (% of GDP)

    •        With large stimulus package to deal with Covid pandemic, global government debt burden (esp. of advanced economies) to further
             expand—which is a cause of concern.

        Source: World Bank Global Economic Prospects, January 2021. AEs = Advanced Economies, EMDEs = Emerging Markets & Developing Economies. LICs
7
        = Low Income Countries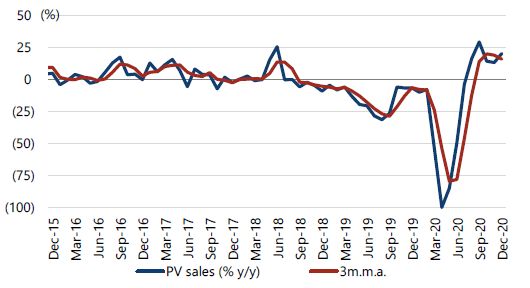
Most global markets have recovered and surpassed pre-covid levels
After a sharp correction in Feb-Mar 2020, a swift market
recovery during FYTD 21 (April – Dec 2020)
Indian markets among the top performers in
FYTD21
Massive liquidity infusion by major central banks
Positive news on Covid vaccine & launches
Strong economic recovery
• Over the long term (5 & 10 years) Indian market has
outperformed most peer Emerging Markets
8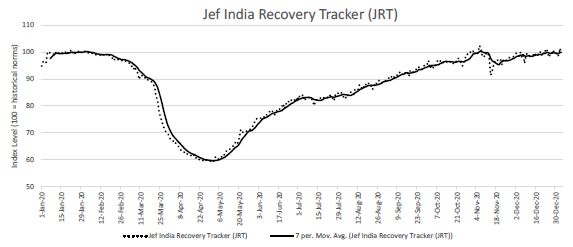
World market cap has crossed US$100 trn for the first time
                                                                World Market Cap (US$ in trillion)
    120
                                                                                                                                                                                103
    100                                                                                                                                                           87
     80
                                                 63
     60                                                                                                                                                                 68
     40
     20                                                        27
      0
          Dec-03

                      Dec-04

                               Dec-05

                                        Dec-06

                                                      Dec-07

                                                               Dec-08

                                                                        Dec-09

                                                                                 Dec-10

                                                                                          Dec-11

                                                                                                   Dec-12

                                                                                                            Dec-13

                                                                                                                     Dec-14

                                                                                                                              Dec-15

                                                                                                                                       Dec-16

                                                                                                                                                Dec-17

                                                                                                                                                         Dec-18

                                                                                                                                                                       Dec-19

                                                                                                                                                                                  Dec-20
•    Market capitalization of all listed stocks in the world crossed the US$100tn mark for the first time in Dec’2020.
•    This is a sharp recovery from Mar’2020 levels---world market cap fell 22% in March, followed by a 50% rise.

                   Source: Bloomberg
9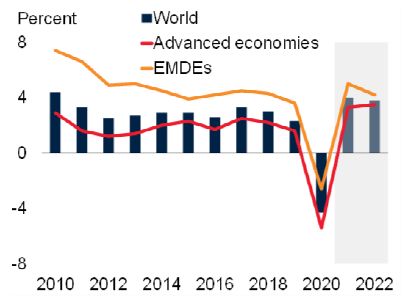
World market cap to GDP is at its highest level at ~120%, indicating that global market
valuations are elevated

                                                                 World Market Cap/GDP Trend (in %)
       140%
                                                                                                                                                                               122%
       120%
                                                       103%                                                                                        100%
       100%
         80%
         60%                                                      50%
         40%
         20%
           0%
                  Dec-03

                           Dec-04

                                    Dec-05

                                              Dec-06

                                                        Dec-07

                                                                  Dec-08

                                                                           Dec-09

                                                                                    Dec-10

                                                                                             Dec-11

                                                                                                      Dec-12

                                                                                                               Dec-13

                                                                                                                        Dec-14

                                                                                                                                 Dec-15

                                                                                                                                          Dec-16

                                                                                                                                                    Dec-17

                                                                                                                                                             Dec-18

                                                                                                                                                                      Dec-19

                                                                                                                                                                                Dec-20
     Source: Bloomberg
10   Market Cap is as of year end and GDP is nominal for the Calendar year
MSCI EM index now back to pre-GFC level; significantly underperformed MSCI World
• MSCI Emerging Market index has significantly underperformed MSCI World index (developed markets), primarily dragged down by China.
• Will the large divergence in performance correct to some extent in coming years? Dollar depreciation to help Emerging Markets?
Source: Bloomberg. GFC = Global Financial Crisis of 2008-09
11Global crude prices have seen a strong recovery
Brent Crude Price Trend in CY2020 (US$ / barrel)
• Crude oil prices have recovered from their lows in April 2020, with economic activity picking up, global risk appetite improving, and
on the back of OPEC production cuts
12 Source: BloombergIndia’s Q3 & Q4 FY21 GDP growth is expected to be positive; strong recovery expected in FY22
India GDP – Trend and Projections (% YoY)
• RBI now project’s India’s GDP to contract by 7.5%YoY in FY21 vs • RBI now estimates GDP growth to turn positive in Q3 FY21 vs Q4
earlier forecast of 9.5% contraction FY21 earlier
• Economists expects GDP to grow by 8.0-9.5% in FY22 • Q1 FY22 expected to register strong growth (helped by base effect)
13 Source: MOSPI, RBIEconomic / Business Activity in India back to ~95-100% of Pre-Covid levels
Nomura India Business Resumption Index indicates that economic Jefferies India Economic Activity index indicates that overall
activity is back to ~95% of Pre-Covid levels activity is back to ~100% of Pre-Covid levels
14 Source: Nomura, JefferiesHigh Frequency Indicators like auto sales point to strong recovery – in positive growth territory
Passenger Vehicle Sales (% YoY) 2-Wheeler Sales (% YoY)
15 Source: SIAM, JefferiesOther key indicators also pointing to strong recovery
Manufacturing & Services PMI surges into expansion territory GST collections hit record high in Dec 2020
Steel production has seen healthy recovery Cement production has also seen healthy recovery
16 Source: Jefferies, IHS Markit, CLSAExternal sector remains strong
India Current Account & Balance of Payment Trend Forex Reserves US$ Bln
US $ Billion FY19 FY20 FY21E 650
Exports 337 320 277 600 580
Imports 518 478 373
550
Trade Balance -181 -158 -96
500
Net invisibles 123 133 122
Current Account Balance -58 -25 26 450
CAD % to GDP -2.1% -0.9% 1.0% 400
FDI 31 43 44 350
FII -1 1 37
300
ECB 10 23 -6
NRI Deposits 10 9 10 250
Others 4 8 -7 200
Capital Account Balance 54 84 78
Balance of Payment -4 59 104
• Current account expected to be surplus in FY21, if crude price doesn’t rise much from current level.
• Balance of Payment (BoP) surplus has led to record annual accretion in forex reserves to all-time highs. BoP expected to be in strong
surplus in FY21 helped by robust foreign capital flows.FPI equity inflows have been robust in FYTD 21; DIIs register outflows • FPI equity flows surge on the back of strong global liquidity. Nov 2020 registered record high FPI flow & flow remained strong in Dec 2020. • However, DIIs have seen outflows. Nov 2020 registered record high DII outflow & outflows continued in Dec 2020. 18
India was among the only emerging markets to register strong FPI equity inflows in CY20

                               Country-wise FPI equity flows in CY 2020 (US$ in billion)

 •    India registered one of the strongest calendar-year wise FPI equity inflows in 2020 (CY10 saw highest FPI equity inflow of $29 billion)

 •    Most other peer emerging and Asian markets registered FPI equity outflow in CY20

19   Source: Bloomberg, CLSA
India FDI inflows were strong – helped by big stake sales by Reliance Industries
India FDI flow trend – Fiscal Year-wise (US$ in billion)
20 Source: Ministry of Commerce, CLSAMarket rally has become broad-based
• Equity markets rallied strongly during FYTD21 (April – Dec 2020)
Due to strong FII inflows, positive vaccine news, healthy corporate
earnings and strong recovery in economic activity
Mid/Small-caps outperformed, making the rally more broad-based
Sectors like metals, IT auto, realty and healthcare outperformed
Sectors like PSU, FMCG, oil & gas underperformed
Cyclical sectors trying to play catch-up
• For CY20 too, equity markets closed with healthy gains. IT, pharma &
broader markets (small/mid-caps) outperformed
21Top & Bottom Five Performers of Nifty index in CY 2020 & FYTD 21 22 Source: Bloomberg. FYTD-21 = April 2020 to Dec 2020. Past performance is not an indicator of future performance.
Equity market activity has been buoyant – Cash volumes up significantly

                                               NSE Daily Avg. Cash market volumes (Rs. cr)
     70,000

     60,000                                                                                                                      57,359

     50,000

     40,000                                                                                                           36,432

     30,000
                                                                                                      20,387
     20,000

     10,000

          -
                FY01 FY02 FY03 FY04 FY05 FY06 FY07 FY08 FY09 FY10 FY11 FY12 FY13 FY14 FY15 FY16 FY17 FY18 FY19 FY20 FY21
                                                                                                                    YTD

•    Equity market activity has been buoyant with NSE’s FY21 daily volume averaging ~57,000cr v/s ~36,000cr in FY20 (up 57%).

•    Retail participation in equity markets has moved up to ~65% levels in FY21 v/s ~42% two years ago. Sharp addition of 8 mln demat
     accounts in FYTD21 (upto Nov)– around 50% YoY growth.

23            Source: NSE, MOFSL
Equity market issuances have picked up significantly in 2020; comparable to 2017
• With buoyancy in equity markets, equity market issuances have picked up, and the trend could continue (if market conditions remain favourable)
• Some of the recent IPOs have seen massive over-subscription and a robust listing gain, indicating that appetite remains strong
24 Source: Prime Database, Kotak Institutional Equities. * Equity Market issuances includes IPO, FPO, QIP & OFSQ2 FY21 earnings have come in better than expected, helped by cost control
Nifty Q2 FY21 PAT growth (%YoY) strong vs expectation of decline Nifty Q2 FY21 Sales decline (%YoY), in-line
• Nifty Q2 FY21 earnings were quite strong, helped by cost control. As a result we have seen earnings getting upgraded.
• Earnings expected to continue to recover through FY21 (~7% growth during the year), and pick up strongly by ~30% in FY22.
25 Source: Motilal OswalEarnings expected to recover in FY22; Corporate profit to GDP may have bottomed out
Nifty EPS Trend Corporate Profit to GDP expected to recover in coming years
26 Source: Bloomberg, Jefferies, IIFL ResearchValuations are quite elevated; Market cap to GDP near its peak
Nifty Forward P/E Ratio at peak levels India Market Cap to GDP Trend (in %)
27 Source: Bloomberg, Jefferies, Motilal OswalDomestic liquidity is ample - RBI’s focus has been on growth
• RBI had cut policy rates earlier by 115 bps responding to the
pandemic, but has left rates unchanged post May 2020.
• Dovish undertone continues in Dec 2020 policy
• Accommodative stance till next fiscal year
• Growth over inflation
• CPI inflation has been elevated and above RBI’s 6% upper limit for
a while, primarily due to supply disruptions
• Oct’20 at 7.6% and Nov’20 at 6.9%
Net Liquidity in the system (Rs trillion) • RBI expects inflation to moderate to 4.6% by Sep 2021.
• Liquidity remains high at Rs 5-6 trn
• With inflation being elevated, minimal space for more rate cuts,
and further monetary action will be dependent on inflation
trajectory.
• We prefer medium term part of yield curve
28 Source: BloombergIndia Yield Curve and Spread
India G-Sec Yield Curve AAA Spread (over G-Sec) %
AAA Spreads 5yr 10yr
Dec-20 0.3% 0.7%
Mar-20 0.4% 0.9%
Mar-19 0.8% 0.8%
Oct-18 1.0% 0.7%
Term Premium has increased significantly
• Shorter end of yield curve (short term yields) has come down
much more than the rest of the yield curve (esp. long term yields)
• Corporate bond spreads have come down, indicating reduction in
risk aversion
29 Source: FBIL, BloombergWhile fiscal remains a worry, it can wait due to growth concerns
Fiscal deficit to balloon in FY21
• Center’s gross borrowing up from Rs 7.8 trln to Rs 13.1 trln for FY21. Borrowing calendar for H2 FY21 revised to Rs 5.4 trln
• State’s allowed to increase their fiscal deficit from 3% to 5% of GDP subject to conditions.
• Consolidated fiscal deficit (both centre & states) could rise to 11-12% of GDP in FY21
30 Source: Kotak Institutional EquitiesMarket Outlook for 2021
With launch of Covid vaccines, the • Even though global Covid cases are escalating (esp. in US), with the launch of Covid vaccines—
worst is behind us; Economies to the worst seems to be behind us. The big theme in 2021 will be vaccine administration drive.
• 2021 will be the year of economic normalization & healthy recovery in economic growth.
normalize & pick-up
Global liquidity surge helps to • The global liquidity surge helps markets to recover strongly—with some touching all-time highs.
• The easy global liquidity scenario/monetary policy stance expected to continue for a while—to
boosts markets help in economic recovery
Market valuations are elevated;
• Market valuations are elevated, with Nifty index trading at ~22X FY22 EPS.
Corporate Earnings expected to • Corporate earnings to see strong recovery, with Nifty EPS growth expected to grow ~30% in FY22
recover strongly in FY22
• At this juncture, investors should systematically invest in equities, or use an asset allocation
Investment Strategy approach (based on their risk profile).
• Limited space available for further rate cuts, and dependent on future inflation trajectory
Debt Markets & Strategy • We prefer medium term part of the G-Sec yield curve.
• Global monetary policy stance, upcoming India Union Budget (Feb 2021), movement of Dollar
Factors to watch out for index (as it can impact EM flows), geo-political tensions, clarity on policy changes under new US
govt, and progress of administration & efficacy of Covid vaccine
31DISCLAIMER: The contents of this presentation is confidential, may contain proprietary or privileged information and is intended for reserved recipient(s) for information Purpose only. Unintended recipients are prohibited from taking action on the basis of information in this presentation and must delete all copies. The information provided is on “as is” basis and Bajaj Allianz disclaims any warranty, responsibility or liability for the accuracy or completeness of this presentation and assumes no responsibility or liability for errors or omissions in the contents of the presentation. Bajaj Allianz reserves the right to make additions, deletions, or modification to the contents of the presentation at any time without prior notice. In no event shall Bajaj Allianz be liable to any entity or individual for any direct, indirect, special, consequential, or incidental claims or damages or any claims/damages whatsoever, whether in an action of contract, negligence or other tort, arising out of or in connection with the use of this Presentation or the contents of this Presentation. Any reference to the aforesaid content shall be subject to formal written confirmation by Bajaj Allianz. No confidentiality or privilege is waived or lost by Bajaj Allianz by any mis-transmission of this presentation. Any reference to "Bajaj Allianz" is a reference to Bajaj Allianz Life Insurance Company Limited. The Logo of Bajaj Allianz Life Insurance Co. Ltd. is provided on the basis of license given by Bajaj Finserv Ltd. to use its “Bajaj” Logo and Allianz SE to use its “Allianz” logo. The Presentation is not intended to be construed as any advisory from Bajaj Allianz for any investment or any other purpose. Any reliance of the same by the individual for any purpose, is on the sole independent understanding and requirement of the individual. The Public is advised to consult their advisor in regards to their investment. © Bajaj Allianz Life Insurance Co. Ltd. 2020. Bajaj Allianz Life Insurance Co. Ltd., Regd. Office Address: Bajaj Allianz House, Airport Road, Yerawada, Pune – 411006, IRDAI Reg. No: 116, CIN : U66010PN2001PLC015959, Mail us : customercare@bajajallianz.co.in, Call on : Toll free no. 1800 209 7272/ Fax No: 02066026789 32
You can also read