Global Forest Resources Assessment 2020 - Key findings - Food and ...
←
→
Page content transcription
If your browser does not render page correctly, please read the page content below
Global
     Forest
 Resources
Assessment
     2020
     Key findings
This publication contains the main findings of the Global Forest Resources Assessment
2020 (FRA 2020). The data in FRA 2020 – the “backbone” of the assessment –
have been obtained through a transparent, traceable reporting process and
a well-established network of officially nominated national correspondents.
The application of a standardized reporting methodology enables the monitoring of
change over time in parameters such as forest area, management, ownership
and use and the aggregation of data at the regional and global levels.
The information provided by FRA presents a comprehensive view of the world’s
forests and the ways in which the resource is changing. Such a clear global picture
supports the development of sound policies, practices and investments affecting
forests and forestry.
FRA is the mechanism for collecting data on two forest-related indicators of the
Sustainable Development Goals (SDGs), which the United Nations General Assembly
adopted in 2015. Specifically, data submitted to FRA contribute to reporting on SDG
indicator 15.1.1 (forest area as a proportion of total land area in 2015) and indicator
15.2.1 (progress towards sustainable forest management).
Required citation: FAO. 2020. Global Forest Resources Assessment 2020 – Key findings. Rome. https://doi.org/10.4060/ca8753en
The designations employed and the presentation of material in this information product do not imply the expression of any opinion
whatsoever on the part of the Food and Agriculture Organization of the United Nations (FAO) concerning the legal or development status of
any country, territory, city or area or of its authorities, or concerning the delimitation of its frontiers or boundaries. The mention of specific
companies or products of manufacturers, whether or not these have been patented, does not imply that these have been endorsed or
recommended by FAO in preference to others of a similar nature that are not mentioned.
The views expressed in this information product are those of the author(s) and do not necessarily reflect the views or policies of FAO.
© FAO, 2020
Some rights reserved. This work is made available under the Creative Commons Attribution-NonCommercial-ShareAlike
3.0 IGO licence (CC BY-NC-SA 3.0 IGO; https://creativecommons.org/licenses/by-nc-sa/3.0/igo/legalcode).
Under the terms of this licence, this work may be copied, redistributed and adapted for non-commercial purposes, provided that the work is
appropriately cited. In any use of this work, there should be no suggestion that FAO endorses any specific organization, products or services.
The use of the FAO logo is not permitted. If the work is adapted, then it must be licensed under the same or equivalent Creative Commons
licence. If a translation of this work is created, it must include the following disclaimer along with the required citation: “This translation was
not created by the Food and Agriculture Organization of the United Nations (FAO). FAO is not responsible for the content or accuracy of this
translation. The original [Language] edition shall be the authoritative edition.”
Disputes arising under the licence that cannot be settled amicably will be resolved by mediation and arbitration as described in Article 8
of the licence except as otherwise provided herein. The applicable mediation rules will be the mediation rules of the World Intellectual
Property Organization http://www.wipo.int/amc/en/mediation/rules and any arbitration will be conducted in accordance with the
Arbitration Rules of the United Nations Commission on International Trade Law (UNCITRAL).
Third-party materials. Users wishing to reuse material from this work that is attributed to a third party, such as tables, figures or images, are
responsible for determining whether permission is needed for that reuse and for obtaining permission from the copyright holder. The risk of
claims resulting from infringement of any third-party-owned component in the work rests solely with the user.
Sales, rights and licensing. FAO information products are available on the FAO website (www.fao.org/publications) and can be purchased
through publications-sales@fao.org. Requests for commercial use should be submitted via: www.fao.org/contact-us/licence-request.
Queries regarding rights and licensing should be submitted to: copyright@fao.org.Forests cover nearly
one-third of the land globally
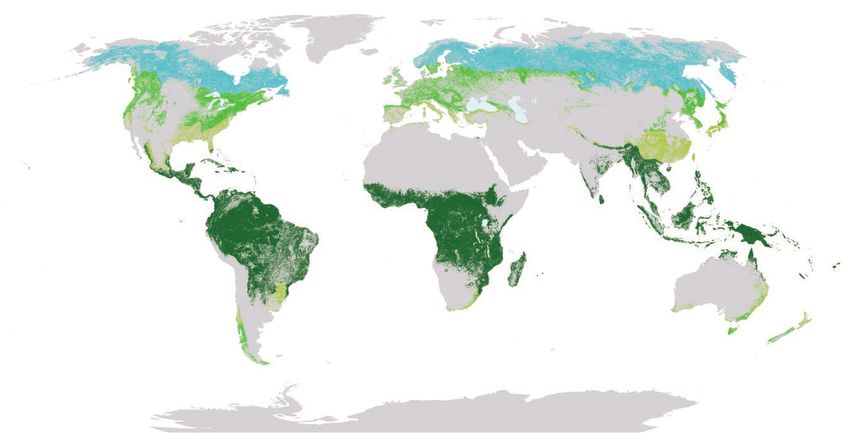
The world has a total forest area of 4.06 billion hectares (ha), which is 31 percent
of the total land area. This area is equivalent to 0.52 ha per person1 – although
forests are not distributed equally among the world’s peoples or geographically.
The tropical domain has the largest proportion of the world’s forests (45 percent),
followed by the boreal, temperate and subtropical domains.
More than half (54 percent) of the world’s forests is in only five countries –
the Russian Federation, Brazil, Canada, the United States of America
and China.
Proportion and distribution of global forest area by climatic domain, 2020
Proportion and distribution of global forest area by climatic domain, 2020
Tropical
Tropical
45%
45%
Boreal
Boreal
27%
27%
Temperate
Temperate
16%
16%
Subtropical
Subtropical
11%
11%
Source: Adapted from United Nations World map, 2020.
Top five countries for forest area, 2020 (million ha)
Top five countries for forest area, 2020 (million ha)
Russian Brazil Canada United China Rest of
Russian
Federation Brazil
497 Canada Unitedof China
347 States 220 Restworld
the of
Federation
815 497 347 States of 220
America the1world
870
815 America
310 1 870
310
% 20 12 9 8 5 46
% 20 12 9 8 5 46
1
Calculated assuming a global population of 7.79 billion people, as estimated in United Nations, Department
of Economic and Social Affairs, Population Division. 2019. World Population Prospects 2019, Online Edition.
1 Global Forest Resources Assessment 2020 Key findingsThe world’s forest area is decreasing,
but the rate of loss has slowed
The world has lost 178 million ha of forest since 1990, which is an area about
the size of Libya.
The rate of net forest loss decreased substantially over the period 1990–2020
due to a reduction in deforestation in some countries, plus increases in forest
area in others through afforestation and the natural expansion of forests.
The rate of net forest loss declined from 7.8 million ha per year in the
decade 1990–2000 to 5.2 million ha per year in 2000–2010 and 4.7 million ha
per year in 2010–2020. The rate of decline of net forest loss slowed in the most
recent decade due to a reduction in the rate of forest expansion.
Global annual forest area net change,
by decade, 1990–2020
FAO defines deforestation as the conversion
3
of forest to other land uses (regardless
of whether it is human-induced). 2
“Deforestation” and “forest area net change” 1
are not the same: the latter is the sum of 0
all forest losses (deforestation) and all forest
Million ha per year
-1
gains (forest expansion) in a given period.
-2
Net change, therefore, can be positive
or negative, depending on whether gains -3
exceed losses, or vice versa. -4
-5 -4.7
-5.2
-6
-7
-7.8
-8
1990–2000 2000–2010 2010–2020
2 Global Forest Resources Assessment 2020 Key findingsAfrica has the highest net loss of forest area
Africa had the largest annual rate of net forest loss in 2010–2020,
at 3.9 million ha, followed by South America, at 2.6 million ha.
The rate of net forest loss has increased in Africa in each of the three decades
since 1990. It has declined substantially in South America, however, to about half
the rate in 2010–2020 compared with 2000–2010.
Asia had the highest net gain of forest area in 2010–2020, followed by Oceania
and Europe.2 Nevertheless, both Europe and Asia recorded substantially lower
rates of net gain in 2010–2020 than in 2000–2010. Oceania experienced net losses
of forest area in the decades 1990–2000 and 2000–2010.
Annual forest area net change, by decade and region, 1990–2020
3
2.4
2
1.2 1.2
1 0.8
0.4 0.3
0.2 0.2
0
-0.2 -0.2 -0.3 -0.1
Million ha per year
-1
-2
-3 -2.6
-3.3 -3.4
-4 -3.9
-5
-5.1 -5.2
-6
-7
-8
Asia Oceania Europe North and Central South America Africa
America
1990–2000 2000–2010 2010–2020
2
According to the regional breakdown used in FRA 2020, Europe includes the Russian Federation.
3 Global Forest Resources Assessment 2020 Key findingsDeforestation continues, but at a lower rate
An estimated 420 million ha of forest has been lost worldwide through
deforestation since 1990, but the rate of forest loss has declined substantially.
In the most recent five-year period (2015–2020), the annual rate of deforestation
was estimated at 10 million ha, down from 12 million ha in 2010–2015.
Annual rate of forest expansion and deforestation, 1990–2020
15
10
10 8
7
5
5
Million ha per year
0
-5
-10
-10
-12
-15
-16 -15
-20
1990–2000 2000–2010 2010–2015 2015–2020
Forest expansion Deforestation
More than 90 percent of the world’s forests
have regenerated naturally
Ninety-three percent (3.75 billion ha) of the forest area worldwide is composed of
naturally regenerating forests and 7 percent (290 million ha) is planted.
The area of naturally regenerating forests has decreased since 1990
(at a declining rate of loss), but the area of planted forests has increased by
123 million ha. The rate of increase in the area of planted forest has slowed in
the last ten years.
4 Global Forest Resources Assessment 2020 Key findingsNaturally regenerating versus planted forests, 2020 (% of global forest area)
Naturally regenerating Other planted forest
forest Plantation forest
% 93 3 4
Annual net change in area of naturally regenerating and planted forest,
by decade, 1990–2020
6 5
4
4 3
2
Million ha per year
0
-2
-4
-6
-8
-8
-10
-10
-12
-12
-14
1990–2000 2000–2010 2010–2020
Naturally regenerating forest Planted forest
Plantations account for
about 3 percent of the world’s forests
Plantation forests cover about 131 million ha, which is 3 percent of the global
forest area and 45 percent of the total area of planted forests.
Plantation forests are intensively managed, composed of one or two
species, even-aged, planted with regular spacing, and established mainly
for productive purposes. Other planted forests, which comprise 55 percent
of all planted forests, are not intensively managed, and they may resemble
natural forests at stand maturity. The purposes of other planted forests may
include ecosystem restoration and the protection of soil and water values.
5 Global Forest Resources Assessment 2020 Key findingsThe highest share of plantation forest is in South America, where this forest
type represents 99 percent of the total planted-forest area and 2 percent of the
total forest area.
The lowest share of plantation forest is in Europe, where it represents 6 percent
of the planted forest estate and 0.4 percent of the total forest area.
Globally, 44 percent of plantation forests are composed mainly of introduced
species. There are large differences between regions: for example, plantation
forests in North and Central America mostly comprise native species and those in
South America consist almost entirely of introduced species.
Proportion of introduced and native species in plantation forest, by region, 2020
Africa
Asia
Europe
North and Central America
Oceania
South America
World
0 10 20 30 40 50 60 70 80 90 100
%
Introduced species Native species
6 Global Forest Resources Assessment 2020 Key findingsMore than 700 million ha of forest is
in legally established protected areas
There is an estimated 726 million ha of forest in protected areas worldwide.
Of the six major world regions, South America has the highest share of forests in
protected areas, at 31 percent.
The area of forest in protected areas globally has increased by 191 million ha
since 1990, but the rate of annual increase slowed in 2010–2020.
Proportion of forest in protected areas, by region, 2020
Africa 27%
Asia 25%
Europe 6%
North and Central America 11%
Oceania 16%
South America 31%
World 18%
0 5 10 15 20 25 30 35
%
Primary forests cover about 1 billion ha
The world still has at least 1.11 billion ha of primary forest – that is, forests
composed of native species in which there are no clearly visible indications
of human activities and the ecological processes have not been significantly
disturbed. Combined, three countries – Brazil, Canada and the Russian
Federation – host more than half (61 percent) of the world’s primary forest.
The area of primary forest has decreased by 81 million ha since 1990, but the
rate of loss more than halved in 2010–2020 compared with the previous decade.
7 Global Forest Resources Assessment 2020 Key findingsMore than 2 billion ha of forest has management plans
Most of the forests in Europe have management plans; on the other hand,
management plans exist for less than 25 percent of forests in Africa and less
than 20 percent in South America. The area of forest under management plans is
increasing in all regions – globally, it has increased by 233 million ha since 2000,
reaching 2.05 billion ha in 2020.
Proportion of forest area with long-term management plans, by region, 2020
Africa 24%
Asia
64%
Europe
96%
North and Central America
59%
Oceania 31%
South America 17%
World 54%
0 10 20 30 40 50 60 70 80 90 100
%
Fire is a prevalent forest disturbance in the tropics
Forests face many disturbances that can adversely affect their health and vitality
and reduce their ability to provide a full range of goods and ecosystem services.
About 98 million ha of forest were affected by fire in 2015;3 this was mainly in
the tropical domain, where fire burned about 4 percent of the total forest area in
that year. More than two-thirds of the total forest area affected was in Africa
and South America.
Insects, diseases and severe weather events damaged about 40 million ha of
forests in 2015, mainly in the temperate and boreal domains.
3
The latest year for which data are available.
8 Global Forest Resources Assessment 2020 Key findingsThe world’s forests are mostly publicly owned,
but the share of privately owned forests
has increased since 1990
Seventy-three percent of the world’s forests is under public ownership,4
22 percent is privately owned, and the ownership of the remainder is categorized
as either “unknown” or “other” (the latter mainly comprising forests where
ownership is disputed or in transition).
Public ownership is predominant in all regions and most subregions.
Of the regions, Oceania, North and Central America and South America have
the highest proportions of private forests.
Globally, the share of publicly owned forests has decreased since 1990 and the
area of forest under private ownership has increased.
Forest ownership, by region, 2015
100
90
80
70
60
50
%
40
30
20
10
0
Africa Asia Europe North and Oceania South World
Central America America
Public Private Unknown/other
4
As of 2015, the latest year for which global data are available.
9 Global Forest Resources Assessment 2020 Key findingsPublic administrations hold management rights to 83 percent of the publicly
owned forest area globally. Management by public administrations is particularly
predominant in South America, where it accounts for 97 percent of management
responsibility in publicly owned forests. The share of public administration
management rights has decreased globally since 1990, with an increasing
share of publicly owned forests managed by private businesses, entities and
institutions and by indigenous and tribal communities.
The world’s forest growing stock
is declining
The world’s total growing stock of trees decreased slightly, from 560 billion m3
in 1990 to 557 billion m3 in 2020, due to a net decrease in forest area. On the
other hand, growing stock is increasing per unit area globally and in all regions;
it rose from 132 m3 per ha in 1990 to 137 m3 per ha in 2020. Growing stock
per unit area is highest in the tropical forests of South and Central America and
West and Central Africa.
The world’s forests contain about 606 gigatonnes of living biomass
(above- and below-ground) and 59 gigatonnes of dead wood. The total biomass
has decreased slightly since 1990 but biomass per unit area has increased.
10 Global Forest Resources Assessment 2020 Key findingsTotal forest carbon stock
is decreasing
Most forest carbon is found in the living biomass (44 percent) and soil organic
matter (45 percent), with the remainder in dead wood and litter. The total carbon
stock in forests decreased from 668 gigatonnes in 1990 to 662 gigatonnes
in 2020; carbon density increased slightly over the same period, from 159 tonnes
to 163 tonnes per ha.
Proportion of carbon stock in forest carbon pools, 2020
44% in living
biomass
4% in dead wood
6% in litter
45% in soil organic
matter
About 30 percent of all forests
is used primarily for production
Globally, about 1.15 billion ha of forest is managed primarily for the production
of wood and non-wood forest products. In addition, 749 million ha is designated
for multiple use, which often includes production.
Worldwide, the area of forest designated primarily for production has been
relatively stable since 1990 but the area of multiple-use forest has decreased by
about 71 million ha.
11 Global Forest Resources Assessment 2020 Key findingsAbout ten percent of the world’s forests
is allocated for biodiversity conservation
Globally, 424 million ha of forest is designated primarily for biodiversity
conservation. In total, 111 million ha has been so designated since 1990,
of which the largest part was allocated between 2000 and 2010. The rate of
increase in the area of forest designated primarily for biodiversity conservation
has slowed in the last ten years.
The area of forest designated primarily for
soil and water protection is increasing
An estimated 398 million ha of forest is designated primarily for the protection
of soil and water, an increase of 119 million ha since 1990. The rate of increase in
the area of forest allocated for this purpose has grown over the entire period but
especially in the last ten years.
More than 180 million ha of forest
is used mainly for social services
An area of 186 million ha of forest worldwide is allocated for social services
such as recreation, tourism, education research and the conservation of cultural
and spiritual sites. The area designated for this forest use has increased at a rate
of 186 000 ha per year since 2010.
Note that numbers may not sum to the totals indicated and percentages may not tally to 100 due to rounding.
Not all countries reported on all parameters mentioned here.
12 Global Forest Resources Assessment 2020 Key findingsThe full report of FRA 2020, including an in-depth analysis and individual reports from the 236 countries and territories covered by the assessment, will be published in June 2020. The complete FRA 2020 database and the 236 individual reports will be available online from mid-2020. Visit www.fao.org/forest-resources-assessment In collaboration with its member countries, FAO is conducting a remote sensing survey to derive independent regional and global estimates of forest area and its changes. The results of this survey will be published in 2021. Visit www.fao.org/forest-resources-assessment/remote-sensing FRA 2020 is the result of a joint effort, including by 187 officially nominated national correspondents, 156 alternate national correspondents, and their national teams; an advisory group; partners of the Collaborative Forest Resources Questionnaire; international experts and organizations; FAO staff; consultants; and volunteers from around the world. FAO expresses its gratitude to all these people and organizations for their invaluable contributions to FRA 2020.
Since 1946, FAO has been monitoring
the world’s forest resources through
periodic assessments conducted
in cooperation with its member countries.

The Global Forest Resources Assessment
2020 (FRA 2020), the latest of these
assessments, examines the status of,
and trends in, more than 60 forest-related
variables in 236 countries and territories
in the period 1990–2020.

                                                                      Design and illustration: Chiara Caproni
This publication, which contains
the key findings of FRA 2020, presents
a comprehensive view of the world’s
forests and the ways in which the resource
is changing. Such a clear global picture
supports the development of sound
policies, practices and investments
affecting forests and forestry.

This publication has been produced with the assistance of
the European Union, the Government of Finland and
the Government of Norway.
The contents of this publication are the sole responsibility of FAO
and can in no way be taken to reflect the views of
the European Union, the Government of Finland or
the Government of Norway.
                                                                      CA8753EN/1/04.20
You can also read