INTERIM RESULTS FOR THE SIX MONTHS ENDED 30 JUNE 2018 - Metair
←
→
Page content transcription
If your browser does not render page correctly, please read the page content below
INTERIM RESULTS FOR THE SIX MONTHS ENDED
30 JUNE 2018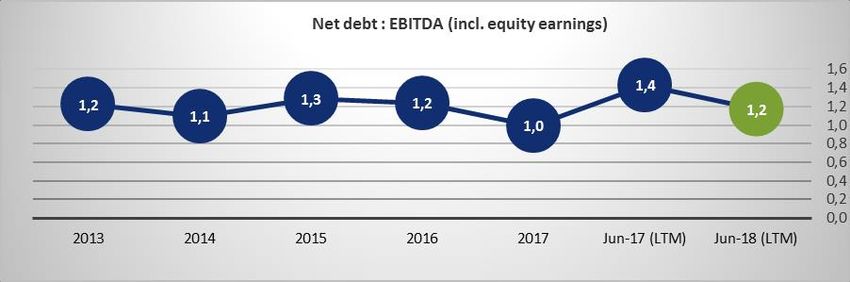
AGENDA

  •   Welcoming & Opening Observations
      •   Interim Results Statement
      •   Strategy Statement
      •   Acquisition Statement
      •   Governance Statement
      •   Factual Corrective Statement
  •   Financial & Operational Overview
  •   Prospects Statement
  •   Q&A

                                         2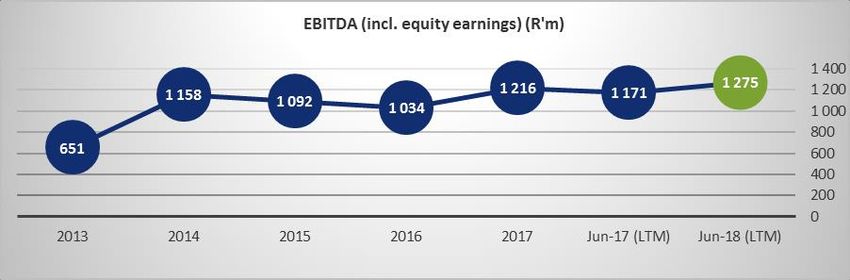
WELCOME & OPENING OBSERVATION
INTERIM RESULTS STATEMENT
SALIENT FEATURES

   •   Turnover up 10% to R4.5 billion
   •   HEPS up 16% to 132 cents per share
   •   Energy Storage Vertical up 10%
   •   Automotive Components Vertical up 31%
   •   Turkey – Mutlu Aku up 25% (Exports and industrial business up)
   •   FNB maintain performance even with
       •   Support to customers especially in industrial and mining
       •   Huge OEM support
       •   Battery Centre rebranding
       •   Product rebranding
       •   Good cash generation R223 million
       •   Working capital reduction

                                                                        4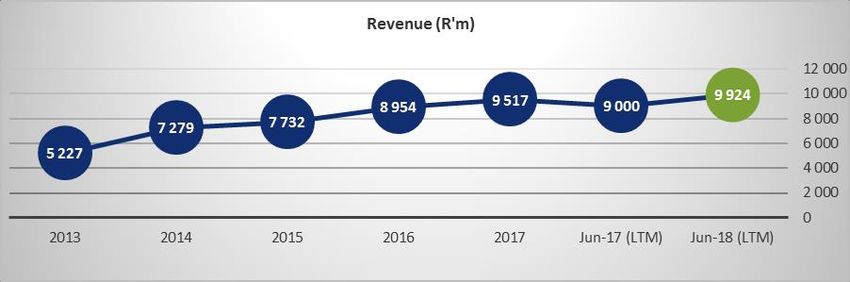
INTERIM RESULTS STATEMENT
SALIENT FEATURES

                           ENERGY STORAGE                     AUTOMOTIVE COMPONENTS

                   H1’17                   H1’18              H1’17                    H1’18

               REVENUE                   REVENUE            REVENUE                  REVENUE
                                   8%                                          12%
               R2.5 billion              R2.7 billion       R2.1 billion             R2.4 billion
               54% Contribution          53% Contribution   46% Contribution         47% Contribution

               OPERATING PROFIT          OPERATING PROFIT   OPERATING PROFIT         OPERATING PROFIT
                                   10%                                         31%
               R227 million              R250 million       R199 million             R261 million
               53% Contribution          49% Contribution   47% Contribution         51% Contribution

               PBIT :       9.2%         PBIT :     9.4%    PBIT :     9.3%          PBIT :    10.9%
               ROIC :      14.7%         ROIC :    16.7%    ROIC :    28.0%          ROIC :    32.4%

                                                                                                        5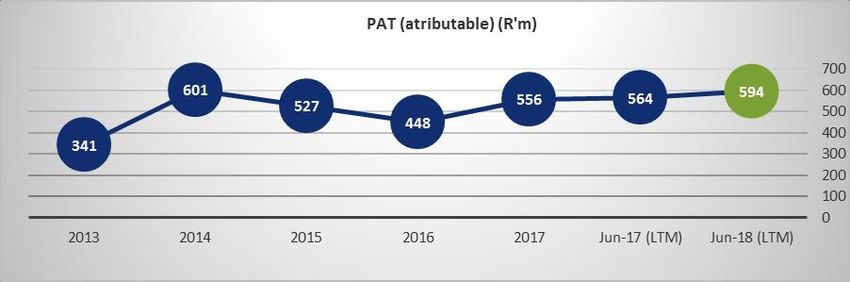
STRATEGY STATEMENT

  •   Key drivers of long-term sustainability
      •   Ability to follow market
      •   Ability to breathe with the market
      •   Ability to adjust to technology shifts
  •   Requires local, international and global relevance
  •   50 million battery strategy aim to secure the relevance and support customers
  •   Pace of execution depends on
  •   External conditions
      •   Operational conditions
      •   Earnings
      •   Shareholder value delivery
      •   Shareholder support

                                                                                      6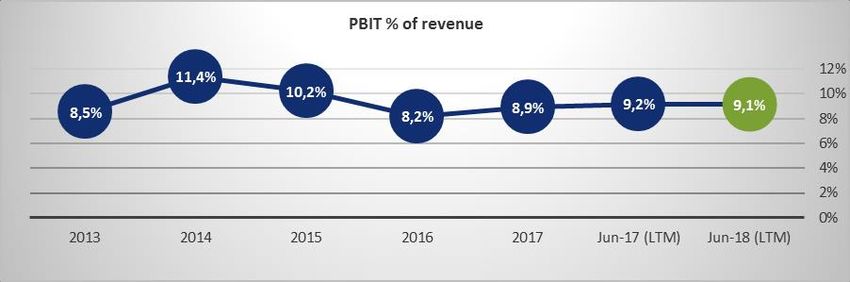
ACQUISITION STATEMENT

  •   TAB acquisition
      •   Confidentiality breach unfortunate
      •   Recent, and potentially protracted, emerging market volatility
      •   Board prioritised operational stability in Turkey
      •   Terminate negotiations and due diligence process
      •   Withdraw cautionary announcement

                                                                           7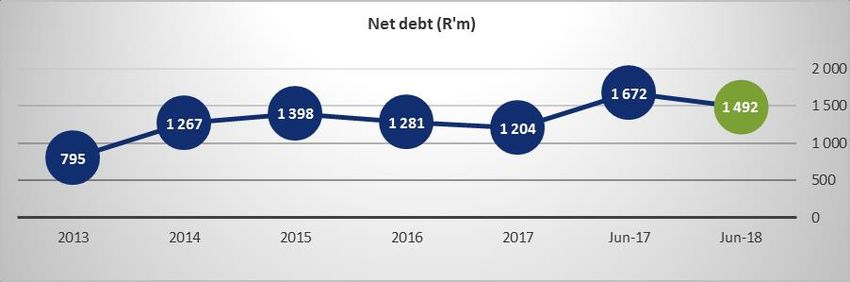
GOVERNANCE STATEMENT

  •   Speaks to the system we designed to direct, grow and control our business
  •   We continuously challenge our approach, design and application in this area
  •   Require balanced focus on performance and conformance, keeping all stakeholders interest in
      mind

  Design Principles
  •   Collective system
      •   Group Marketing Conference – Interpretation of the Market and Marketing Excellence
      •   Group Finance Conference – Financial and Commercial Drivers
      •   Group Technical Conference – Technology Shifts
      •   Group Manufacturing Conference – Manufacturing Excellence
      •   Group HR Conference – Human Capital Optimisation
      •   Group Purchasing Conference – Sourcing Strategies

                                                                                                    8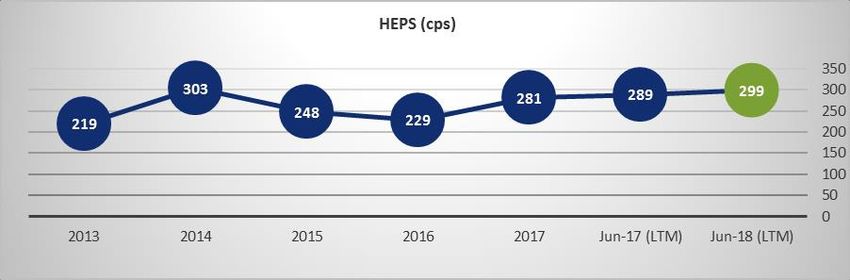
GOVERNANCE STATEMENT

  •   Autonomous Subsidiaries
      •   KPI’s
      •   Budgets
      •   Forecasts

  •   Annual MD’s Conference
      •   All MD’s
      •   Metair Board
      •   Specialists

                                9
GOVERNANCE STATEMENT
• Inputs
• Shareholder Expectations
• Operational Overviews
• Strategic Overviews
• Technology Trends
• Proposed Budget
• Proposed KPI’s
• Proposed Capital Expenditure
• Proposed Return Matrix
• Outputs
• Final KPI’s
• Budgets
• Targets
• Capital Expenditure
• Group Objectives
• Annual Performance Expectation Letters
• Institutionalised System (Bigger than any one person)
10FACTUAL CORRECTIVE STATEMENT
• Earnings declined because of acquisitions
• ROE declined because of acquisitions
• ROIC introduction
11FACTUAL CORRECTIVE STATEMENT
HEPS EVOLUTION
Earnings improved because of acquisitions
12FACTUAL CORRECTIVE STATEMENT
2012 CHANGE POINT
Earnings improved because of Mutlu/Rombat
• There is a fundamental incorrect assumption in the market that it is Metair’s overseas acquisitions that has
led to the decline in earnings from our highest position in 2014
• The fact is that 2017 HEPS was at 281 cents because of Mutlu and Rombat.
• If we strip the Rombat and Mutlu contributions out of the 2017 result it would have been 220 cents per
share only
• This trend is true since 2012. The overseas acquisition added 61 cents in 2017
• Where does the decline come from?
• From the reduced contribution from the South African operations including the Automotive Component
Vertical that went through a major model change
• Our strategy was always to smooth out the dramatic effect of a major model change with the
establishment of the Energy Storage Vertical. As can be seen from the graph above the strategy worked
well in 2016 and 2017 with the model run out in 2016 and new model introduction in 2017
13FACTUAL CORRECTIVE STATEMENT
ROE: 2007 VS 2017
Current ROE improved because of acquisitions
14FACTUAL CORRECTIVE STATEMENT
ROE / ROIC COMMENTS
ROE improved over time (2007 – 2012)
• We believe our return matrix is still good with a ROIC of 32.4% in Automotive Components Vertical, 16.7% in
Energy Vertical and 12.9% at group level
• Yes, it has changed over the last years. It all has to do with the necessary redesign that Metair has been going
through as we had to shift to the aftermarket and energy vertical as from 2012 where we operated in different
countries with very different WACCs. The aftermarket dominant Energy Storage Vertical has a completely different
finished goods stock, route to market inventory, raw material, WIP and related investment profile than that of our
traditional OE components business in SA
• It is the nature of our required redesign as we correct our dislocation to market, follow our customers, leverage our
IP and ensure long term sustainability as we deal with major technology shifts
• A key sustainability imperative in our industry is to breath with the market, follow the market and adjust to
technology shifts
• One of the key drivers in the redesign was the planned major model change by our material customer Toyota
• Metair clearly stated time and time again that once the model change kicked in that the nature of our business will
change forever as Toyota volumes and margin outlook on the new model was always going to be much lower than
the previous model
15FINANCIAL & OPERATIONAL OVERVIEW
H1 2018 MAIN TRADING HIGHLIGHTS
Metair
Group turnover increase of 10% for H1 to R4.5bn from R4.1bn, as both energy and automotive
businesses performed well in the period
>16% HEPS improvement from 114cps in H1’17 to 132cps in H1’18
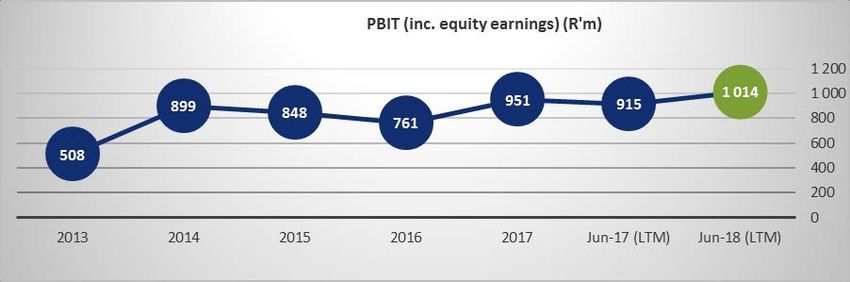
Considering currency translation impact (TRY/ZAR down 17%), pleasing group PBIT of R413m, 16%
higher from previous comparative
Operating margin up 0.5ppt to 9.2% from 8.7% as Automotive Components achieved 10,9% and
Energy Storage 9.4%
Cash generated from operations of R223m reflecting improvement in working capital and earnings
Returns on invested capital (ROIC LTM) up from 11.6% to 11.9%
Balance sheet remains strong, net D:E ratio of 38% and net debt : EBITDA of 1.2x
Dividend of 80cps declared and paid (2017: 70cps)
17FINANCIAL HIGHLIGHTS
INCOME STATEMENT
1. Revenue up 10% due to good volume growth. ROA, ROE 2. EPS and HEPS up 17% and 16% respectively. Net debt of 3. Other operating income analysis
and ROIC improved. Operating margins improved to 9.2% R1.5bn, represents net debt : EBITDA ratio of 1.2.
Dec 17 Jun 17 Jun 18
despite high commodity prices and TRY/ZAR devaluation. Dividend of 80cps declared and paid Item
R'million R'million R'million
Effective tax rate of 25.7% slightly higher as Turkish Government grants and s imilar 95 45 58
corporate tax rates increased to 22% from 20% Derivatives * (34) (12) 27
Dec 17 Jun 17 Jun 18 Dec 17 Jun 17 Jun 18 Other 28 16 15
Item Mvt. Item Mvt.
R'million R'million R'million R'million R'million R'million Other operating income 89 49 100
Revenue 9 517 4 076 4 483 10% Attributable profit 556 223 262 17%
EBITDA (incl. share of assoc.) 1 216 527 586 11% Earnings per share 281 113 132 17%
* Refers to mark to market valuation gains/(losses) on
Operating profit 848 355 413 16% Weighted avg. number of forward exchange and similar contracts
Operating profit margin 8,9% 8,7% 9,2% 0,5ppt 197 987 197 980 198 003 0%
shares ('000)
Profit after tax / 588 / 240 / 282 / 17% / Headline earnings per share 281 114 132 16% • Forex losses of R42m (H1’17: R16m loss) are
effective tax rate 24,3% 25,4% 25,7% 0,3ppt Net debt (1 204) (1 672) (1 492) 11% classified within operating expenses
Dividend per share declared
ROA 12,9% 11,5% 13,3% 1,8ppt
(gross of WHT)
70 70 80 14% • The net forex/derivative position is a R15m loss
ROE 13,6% 12,9% 14,8% 1,9ppt (H1’17: R28m loss)
ROIC 12,3% 11,6% 11,9% 0,3ppt
4. Group consolidated PBIT shows stabilising trend, strong 5. Currency impacts 6. ROIC and invested capital trends improved, in line with
recovery in Automotive Components supported by stable our strategy for capital allocations
Energy Storage margins
18FINANCIAL HIGHLIGHTS
BALANCE SHEET
1. Balance sheet stable, with the exception of currency 2. Equity stable, with earnings offset by R216m FCTR mvt 3. Debt and capital structure remains stable while debt
translation impact. Inventory up on Dec 17 position with Item
Dec 17 Jun 17 Jun 18 ratios improve
higher commodity prices and ES seasonality R'million R'million R'million
Item Dec 17 Jun 17 Jun 18
Total equity 4 196 4 164 4 070
Dec 17 Jun 17 Jun 18 Debt* : Equity 44% 50% 48%
Item Non-current liabilities 1 754 1 611 1 773
R'million R'million R'million Net debt** : Equity 30% 41% 38%
Borrowi ngs 1 149 979 1 162
Non-current assets 4 034 4 134 3 912 Pos t empl oyment benefi ts 79 88 76 Dec 17 Jun 17 Jun 18
Property, pla nt a nd equipment 2 606 2 764 2 523 Deferred ta xa tion 298 325 283 Item
Inta ngible a s s ets 835 952 741 R'million R'million R'million
Deferred gra nt i ncome 175 168 198
Other non-current a s s ets 593 418 648 Net debt** 1 204 1 672 1 492
Provi s i on for l i a bi l i ties 53 51 54
Current assets 4 071 4 076 4 132 Net debt** : EBITDA 1,0 1,4 1,2
Current liabilities 2 155 2 436 2 201
Inventory 1 698 1 975 1 796 Tra de a nd other pa ya bl es 1 236 1 026 1 275 Over time our target remains c.25% D:E
Tra de a nd other receiva bles 1 670 1 499 1 580 Contra ct l i a bi l i ties 6
Contra ct a s s ets 231
May fluctuate short-term during redesign phase
Borrowi ngs 653 1 069 734
Ca s h a nd ca s h equiva lents 671 578 466 Provi s i on for l i a bi l i ties 136 94 119 Our debt levels not to exceed 2 or 2.5 X EBITDA
Other current a s s ets 32 24 59 Ba nk overdra fts 73 203 63
Total assets 8 105 8 210 8 044 Other current l i a bi l i ties 57 44 4 * Interest bearing borrowings
Total liabilities 3 909 4 047 3 974 ** Includes overdrafts and cash equivalents
4. NWC (days) improved on comparative, mainly due to 5. Pref. share revised maturity in the process of being 6. Efficiency and expansion capex focused on smaller
FNB leaner manufacturing. Investment in ES (sales growth finalised investments that meet Metair return metrics
and commodity prices) off-set by translation impact
Dec 17 Jun 17 Jun 18 Funding analysis and debt repayment for 2018
Item
R'million R'million R'million Dec 17 Jun 17 Jun 18
Inventory 1 698 1 975 1 796
Maturity
R'million R'million R'million
Tra de a nd other receiva bles 1 670 1 499 1 580 Total preference shares 840 1 400 840 2019
Prefs
Tra de a nd other pa ya bles (1 236) (1 026) (1 275)
Contra ct a s s ets /lia bilities - net 225 Effective rate - 69% prime
Total working capital 2 132 2 448 2 326
RCF 1 750 750 750 2019
Days Dec 17 Jun 17 Jun 18 Util i s ed (667) (381) (667)
Inventory 65 80 66 Effective rate - JIBAR + 205bps Capital commitments
RCF
Tra de a nd other receiva bles 64 61 58 Efficiency & Health, safety
Tra de a nd other pa ya bles (47) (42) (46) RCF 2 525 525 2023 Sector (R'000) Maintenance expansion & environ. Total
Contra ct a s s ets /lia bilities - net 8 Util i s ed Energy s torage 59 214 40 206 44 627 144 047
Total days 82 99 86 Effective rate - JIBAR + 235bps Automotive components 18 877 42 277 4 019 65 173
All days calculations based on turnover Total commitments 78 091 82 483 48 646 209 220
19ENERGY STORAGE VERTICAL
MAIN TRADING OBSERVATIONS
ENERGY STORAGE at a glance
REVENUE
Auto battery Var Industrial Var
units in '000 s Dec-17 Jun-17 Jun-18 (units) OEM volume decline in MwH sold Jun-17 Jun-18 (units)
8% Mutlu 4 043 1 463 1 399 (64) Turkey offset by higher Mutlu 53 97 44
Rombat 2 205 942 1 023 81 exports. ES overall softer Rombat
R2.7 BILLION FNB 1 780 899 905 6 local AFM volumes but FNB 96 82 (13)
TOTAL 8 027 3 304 3 327 23 17% increase in exports TOTAL 149 180 31
53% Contribution
• Managed to completely offset the TRY devaluation with strong local currency performance. Currency impact was
OPERATING PROFIT
negative 17% on TRY/ZAR translation, but local currency PAT grew by 42% due to excellent focus on cost control and
improvements in export volumes and industrial business
10% • Mutlu PBIT increased from R88m to R110 m (25.3% increase) in ZAR terms.
• FNB’s PBIT maintained at R95m despite investment and increased spend on FNB branding, retail network, training
R250 MILLION and OEM support for OEM AGM products
49% Contribution • Despite warmer than normal European winter season impacting on AFM business as well as circ. 6% increase in USD
lead price, strong performance overall from ES vertical with 9.4% operating margin
LOCAL CURRENCY OPERATING PROFIT
Mutlu 51,1%
Rombat -1,4%
FNB 1,4%
PBIT MARGIN: 9.4% ( 0.2ppt from the PY)
ROIC: 16.7% ( 2ppt from the PY)
20ENERGY STORAGE RESULTS
1. Mutlu contributed > 42% of total vertical revenue 2. Mutlu PBIT increased > R23m, FNB and Rombat flat 3. Energy Storage Vertical PBIT grew over the past 18
months despite TRY currency depreciation against the USD
and ZAR, H1’18 much higher lead input cost
4. Automotive volumes improved marginally with 7% 5. Lower aftermarket content mix and higher lead prices 6. ROIC & LME prices
increase in sales, higher export volumes offset the impact had a dilutive impact on auto margins. Industrial margins
of the warmer winter on aftermarket volumes increased on targeted price corrections and new long term
contractual business at Mutlu
21AUTOMOTIVE COMPONENTS VERTICAL
MAIN TRADING OBSERVATIONS
AUTOMOTIVE COMPONENTS at a glance
Var
OEM Dec-17 Jun-17 Jun-18 (units) Market production volumes
REVENUE MBSA 118 277 51 987 44 190 (7 797) 1.9% (5.3k units)
FMCSA 93 817 45 143 47 850 2 707
VWSA 108 156 61 103 65 783 4 680
12% TSAM 128 578 61 470 67 439 5 969 Metair significant customer volumes
BMW 53 337 19 925 14 094 (5 831)
8% (13.4k units)
NISSAN 31 712 16 975 16 599 (376)
R2.4 BILLION OTHER 29 980 15 545 10 913 (4 632)
47% Contribution TOTAL 563 857 272 148 266 868 (5 280)
• Improved vertical performance, PBIT % increase to 10.9%, above long term market guidance of 7% - 9%
OPERATING PROFIT
• Automotive production in SA 2% lower, but much stronger than expected for Ford, VW and TSAM, mainly on export
volumes and new models
31% • The higher volumes combined with a stable manufacturing environment increased the PBIT contribution from R199
million to R261 million
R261 MILLION • The continued expansion and deepening of localisation and therefore the parts we manufacture for our customers,
51% Contribution assisted in revenue growth of 12.5%
PBIT MARGIN: 10.9% ( 1.6ppt from the PY)
ROIC: 32.4% ( 4.4ppt from the PY)
22AUTOMOTIVE COMPONENTS RESULTS
1. Direct revenue by major OEM customers shows improving 2. Automotive Components Vertical PBIT & margin of 10.9% 3. SA vehicle production volumes (NAAMSA) remains largely
trend of growing our customer base and positioning to shows a strong recovery after model launch first half of 2016 flat, with lower domestic sales offset by record exports. We
deliver on localisation initiatives think there is opportunity to grow to 650k – 700k units in
the medium term
4. ROIC has recovered to pre-model launch levels. Working 5. Anticipated model changes in the next 5 years do not 6. 2020 APDP review:
capital investment relatively low compared to Energy include our major customer
Storage Vertical The new APDP automotive production support program
likely to be announced in Q3/Q4 2018
ANTICIPATED MODEL CHANGES
More focused on BBBEE levels, good for Metair as
Metair and all of its subsidiaries are level 4 or better
Increased focus on local content, which benefits SA
2017 2018 2019 2020 2021 2022 industry
23PROSPECT STATEMENT
PROSPECT STATEMENT

  2018 Prospects

  •   The prospect statement in the IAR of Metair for 2017 indicated that the group had a positive outlook for 2018
  •   The good first half performance is supportive of this statement
  •   Unfortunately Turkish Lira volatility could negatively impact this, however annualised automotive export volumes
      of R1.5m secured with two strategic partners

  Turkey
  •   Mutlu Aku first half
  •   Turkish Lira devaluation
  •   Mutlu Aku very resilient first half performance
  •   Overcome the 17% devaluation in the Turkish Lira
  •   Managed to deliver a 25% improvement in Rand performance
  •   Increased exports by 28%

                                                                                                                         25
PROSPECT STATEMENT
TURKISH LIRA DEVALUATION
• Emerging market experience is key
• Rand experience good schooling
• Exports becomes a focus
• 80% - 85% of vehicles manufactured is for export market
• Non discretionary product
• Strong winter demand required
• Lead recycling and balance big focus
• Require correct OEM pricing structure
• Capital expenditure constraint
• Pricing power in local market important
BUT
• As long as the currency weakness and volatility doesn’t escalate into a full-on banking and liquidity crisis
26SUPPLEMENTARY INFORMATION
FINANCIAL HIGHLIGHTS
   June’18 (LTM)       June’18 (LTM)

                          HEPS
    Revenue
                       (6months)
    R9.9 bn
                         132 cps

     PBIT               Net debt
    R1.0 bn             R1.5 bn

    Attribut.          Net Debt:
      PAT               EBITDA
    R594 m                1.2

     PBIT %             EBITDA
      9.1%              R1.3 bn

                                       28
ENERGY STORAGE VOLUMES
(*ROUNDED)
1. Total automotive volumes by operation (including 2. Warm winter conditions restricted growth to 2.5%. 3. Export automotive volumes grew c.28%. Local aftermarket
industrial). and OEM volumes softer.
4. Rombat automotive volumes grew 9% with strong 5. FNB – auto battery volume sales marginally up with 6. Industrial volume were boosted by new contractual
exports. focus on quality of volumes in a competitive landscape. business secured at Mutlu.
Energy Value - Industrial (MwH) sold
200
82
100 96
97
53
0
Jun 17 Jun 18
Mutlu Group FNB
29Q&A WWW.METAIR.CO.ZA
DISCLAIMER

       The information supplied herewith is believed to be correct but the accuracy thereof at the time of
         going to print is not guaranteed. The company and its employees cannot accept liability for loss
         suffered in consequence of reliance on the information provided. Provision of this data does not
      obviate the need to make further appropriate enquiries and inspections. The financial information has
                     not been reviewed or reported on by the Company’s external auditors.

                                                                                                              31
You can also read